


Most traders treat the Market Facilitation Index like a traffic light, green means go, red means stop. That’s exactly why they lose money with it.
MFI doesn’t tell you when to trade. It tells you whether the market is actually doing anything useful with the price move you’re watching. A breakout might look perfect on the chart, but if MFI shows weak participation, you’re probably about to get faked out.
In this guide, you will learn how to read MFI alongside tick volume, how to combine it with Bill Williams’ momentum tools, and most importantly, how to avoid the three mistakes that turn this brilliant indicator into expensive noise.

- MFI measures how efficiently the market moves price relative to activity, not whether you should buy or sell.
- Tick volume counts price updates, not actual contracts traded, so treat it as a participation signal, not true volume.
- MFI has no sensitivity settings to adjust; if you want different behaviour, change your chart timeframe instead.
- When MFI shows strong participation but momentum tools like AC or AO diverge, the move is likely running out of steam.
Understanding the Market Facilitation Index
In this section, the goal is to learn what the Market Facilitation Index (MFI) measures and why it matters to traders. This index helps you judge whether a price move reflects real market participation or is merely a short-term, weak fluctuation.
In simple terms, MFI helps you assess the link between volume and price movement and evaluate the quality of that move using the data from the same candle.
What the MFI Is and How It Works
If we answer, What is the market facilitation index in the simplest way, it compares the price range with volume to show how willing the market is to move the price. In other words, it checks whether higher activity actually turns into real price movement.
Its standard formula is clear:
(High − Low) / Volume
On most platforms, the market facilitation index indicator is displayed as a histogram in a separate window, making it easier to track changes from one candle to the next.
Q: Why does MFI divide by volume instead of multiplying by it?
A: The division structure reveals efficiency, not just activity. When you divide price range by volume, you’re measuring “how much price movement you got per unit of activity”.
A high result means the market moved the price easily with little resistance. A low result means lots of activity was needed to achieve only a small price change, which often signals congestion or strong opposition between buyers and sellers.
Measuring MFI Price Efficiency and Tick Volume
In Measuring MFI Price Efficiency and Tick Volume, it helps to think of price efficiency like this: “how far the price travelled” compared with “how much activity” the market needed to create that move. If price moves a lot but activity is low, the move may be fragile. If activity is high but prices do not move, it can signal strong buyer-seller conflict or a reversal may be near.
In spot FX, what you see as volume is usually tick volume. Tick volume counts price updates, not the number of real contracts traded. So it is better to treat it as a sign of participation and trading activity, not as true traded volume like you would see in futures markets.
Core Components of the MFI Indicator
In Core Components of the MFI Indicator, you learn the main parts of the market facilitation index indicator so you can read price action alongside tick volume and volatility correctly. This approach helps you judge the quality of a move and make a clearer decision about trend strength.
Tick Volume and Market Activity
When tick volume rises, it means there are more price updates, which typically indicates more traders are active in the market. The market facilitation index indicator uses tick volume as a measure of market participation and trading activity.
MFI focuses on changes from candle to candle, or bar to bar, rather than absolute values. This comparative approach helps you track shifts in market behaviour as they develop across consecutive price bars.
Volatility and Its Effect on MFI
Volatility increases as candle ranges widen. In this case, MFI often rises as well because the distance between High and Low increases in the formula.
This creates a direct mechanical relationship: wider candles typically produce higher MFI values, while narrower candles produce lower values. However, this relationship is based purely on price range, not on the quality or sustainability of the move.
That’s why MFI combines both range and volume in its formula. The indicator helps you assess whether increased volatility is accompanied by stronger participation or just a brief spiIgnoring Market Conditionske in price movement.
Trend Strength Analysis via MFI
Your trend-strength analysis with MFI improves when MFI rises alongside volume. This usually means the market is moving the price further, while participation is also increasing, so the move has better support.
But when MFI and volume fall together, the market often loses energy. In that case, it makes sense to tighten risk control, reduce position size, or trade less often to avoid low-quality setups.
How to Trade Using the MFI
The aim is to turn the market facilitation index into a practical decision tool, not a decorative chart. This indicator is valuable because it tells you whether a price move is driven by real market participation or is only a short, shallow move.
Basic Trading Approach with MFI
A practical MFI trading strategy is to enter trades when MFI and volume rise together. This combination usually indicates the market is more active, and the price is delivering a stronger move relative to that activity.
Basic entry and exit logic:
- Enter when both MFI and volume increase compared to the previous candle
- Use a clear, pre-planned stop-loss for every trade
- Tighten risk control or reduce position size when MFI and volume fall together
- Exit or take partial profits when participation signals weaken
After entry, you must take risk management seriously. Set your stop-loss level before the trade, not during it.

Common Trap
Many traders see MFI + volume rising and immediately enter, but the first green bar after a consolidation or reversal is often a false start. Wait for the second green bar or a structural confirmation (like a higher high in an uptrend) before committing capital. Patience filters out 50% of losing trades.
Spotting Trend Reversals and Fakeouts
In the classic approach, the colour logic of the market facilitation index indicator is based on whether MFI and volume increased or decreased compared with the previous candle. This comparison helps you spot trend reversal signals earlier and assess fakeout risk more accurately.
However, seeing a colour is not enough on its own. The best approach is to read the state from the colour and the MFI-volume combination, then confirm it with the market structure before you enter. Confirmation can be a valid break, a confirming candle, or a clear reaction at a level.
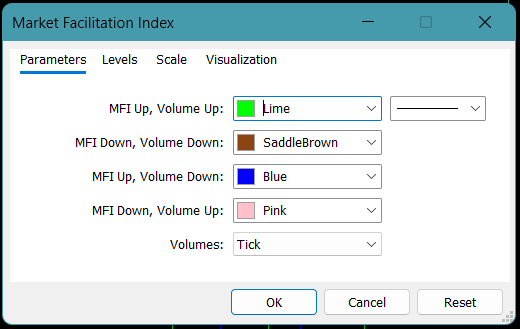
The table below shows the four main states:
| MFI vs Volume state | Common platform colour | What it often suggests | What you do next |
|---|---|---|---|
| MFI up + volume up | Green | Participation supports the move | Consider trend-following entries with defined risk |
| MFI down + volume down | Brown | Interest fades, and the trend may weaken | Reduce size, take profits, or stand aside for now |
| MFI up + volume down | Blue | The move continues, but with weaker activity behind it | Be cautious and watch for exhaustion or reversal signs |
| MFI down + volume up | Pink | Activity is high, but the price is not progressing well | Expect a possible breakout or sharp reversal; wait for confirmation |
Q: Can I trust a green bar (MFI up + volume up) that appears after a long downtrend?
A: Not immediately. A single green bar after a prolonged downtrend can be a trap, especially if it forms in the middle of a range with no structural support nearby. Wait for a second to confirm the green bar, or check whether the price holds above a key level, such as a broken trendline or a previous swing low. Context and position matter more than colour alone.
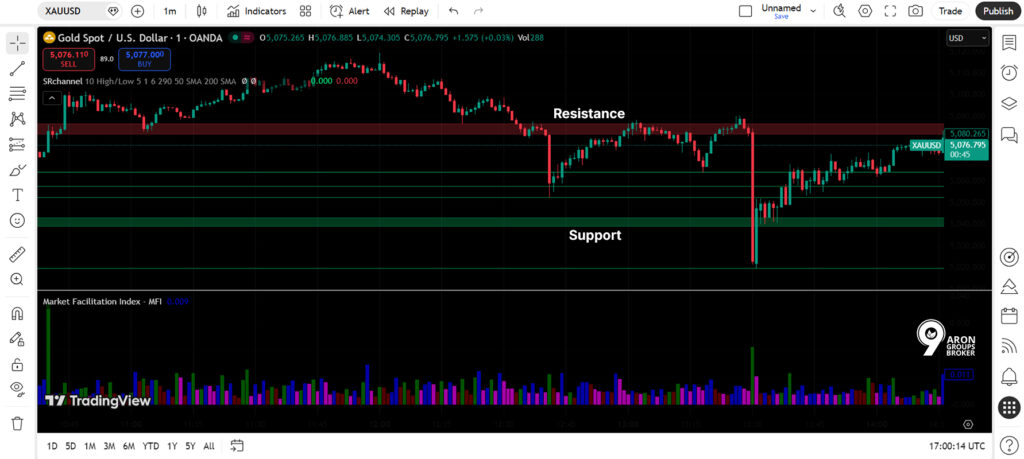
Combining MFI with Trendlines and Support/Resistance
For a cleaner market facilitation index trading strategy, use MFI as a “filter” alongside structural tools. This means you focus on trades that form near support/resistance levels or key trendlines, not in the noisy middle of a range.
The key principle is that:
You're not entering just because MFI is high or the colour is favourable. Your entry should be justified by the combination of supportive MFI readings and a valid structural setup on the chart.
For Example: If a price breaks a trendline but MFI shows weak participation, that break can be suspicious. In this situation, it’s safer to treat it as a fakeout warning until the market proves continuation with the next move.
Always wait for confirmation before committing to the trade. Confirmation can be a valid break, a confirming candle, or a clear reaction at a level.
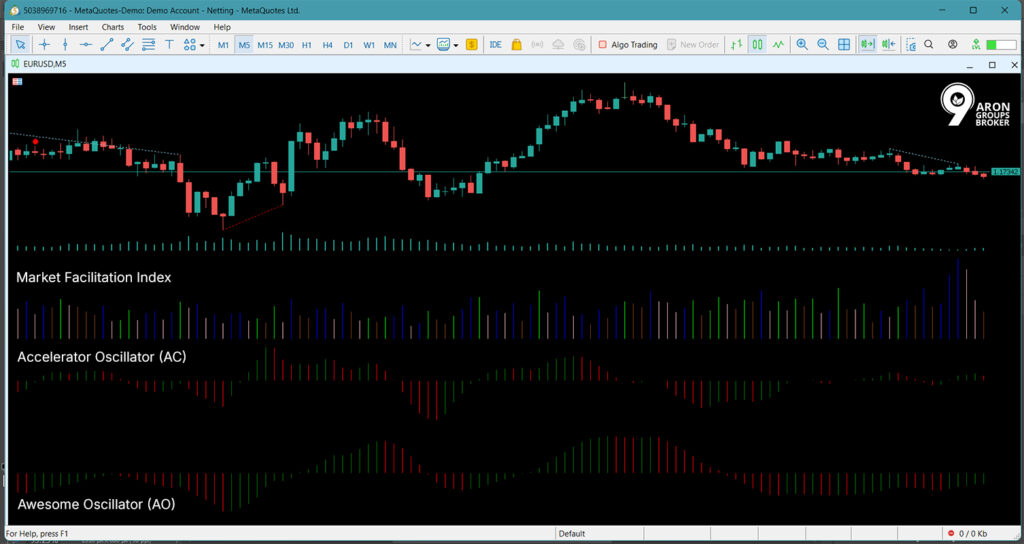
Integrating MFI with Bill Williams Indicators
In Integrating MFI with Bill Williams Indicators, the goal is to place the market facilitation index (MFI) next to Bill Williams’ other tools, so your signals become clearer and more reliable.
MFI mainly speaks about participation and the quality of a move, but for a trading decision, you also need to know whether momentum and acceleration are moving in the same direction.
This Is Where Two Key Tools Help: the Accelerator Oscillator (AC) and the Awesome Oscillator (AO).
Using the Accelerator Oscillator (AC) with MFI
A logical approach is to use MFI first to check whether the price move is supported by market participation. Then use the Accelerator Oscillator (AC) to judge whether momentum is accelerating in your trade direction.
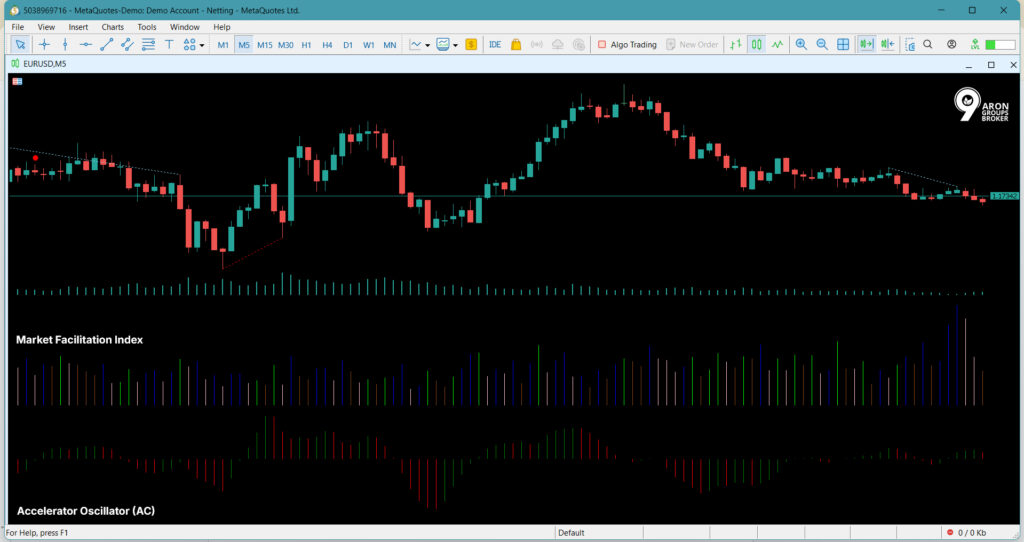
In other words, you check whether there is a move, and whether its speed and impulse are also increasing.
If MFI shows strong participation but AC turns against your trade direction, it can be an early warning sign. This often means the move is losing momentum, even if a clear price reversal is not yet visible. In that case, it’s better to be more cautious, set a sensible stop-loss, or wait for stronger confirmation.
Combining MFI with the Awesome Oscillator (AO)
Combining MFI with the Awesome Oscillator (AO) helps you separate two serious situations:
- Active trend continuation with real participation;
- High activity, but indecision in the market.
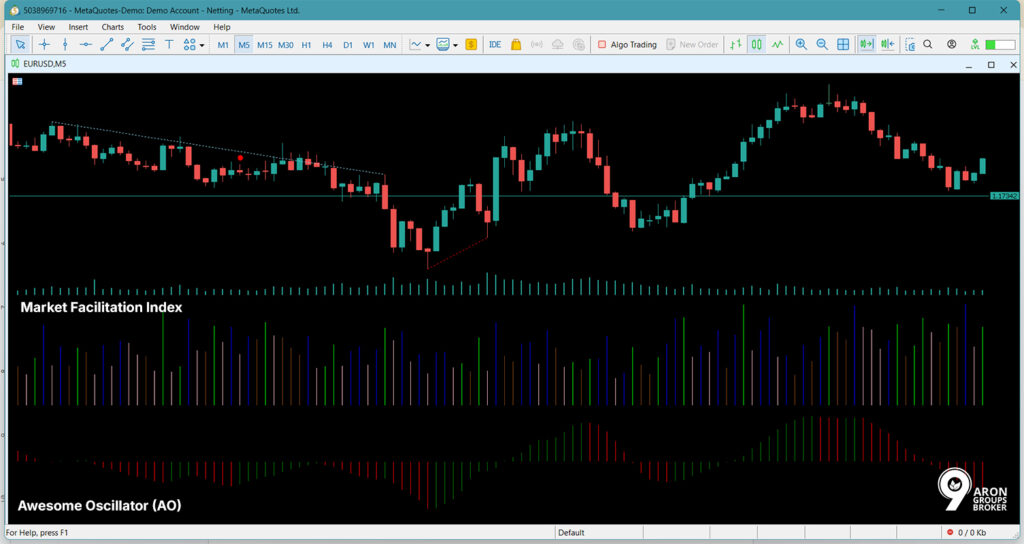
This difference matters most when volatility is high, because the market can be very active while still failing to show a clear direction.
If MFI looks supportive but AO diverges or fails to confirm momentum strength, you should prioritise risk control. Participation without momentum often creates choppy, fast back-and-forth ranges, which can lead to repeated stop-out events.
Setting Up and Using MFI Across Platforms
In Setting Up and Using MFI Across Platforms, you learn how to install, configure, and apply the market facilitation index indicator on MT4, MT5, and TradingView to analyse participation and price movement correctly.
Installing and Configuring MFI on MT4
For the market facilitation index (MT4), you do not need to download anything because the indicator is built into the platform by default. To add it to your chart, follow this path:
Insert → Indicators → Bill Williams → Market Facilitation Index.
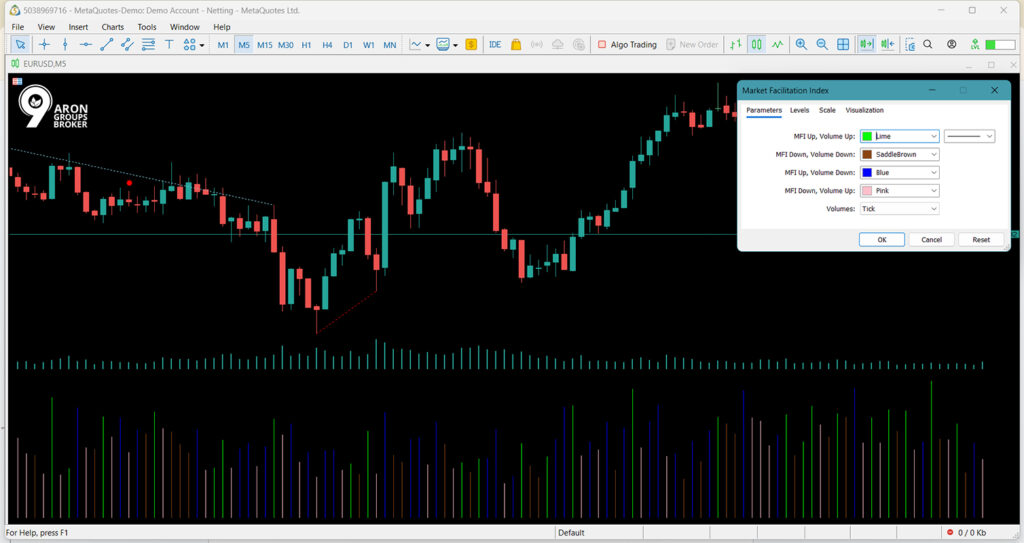
After you add it, the market facilitation index indicator usually appears as a histogram in a separate window, allowing you to review changes candle by candle.
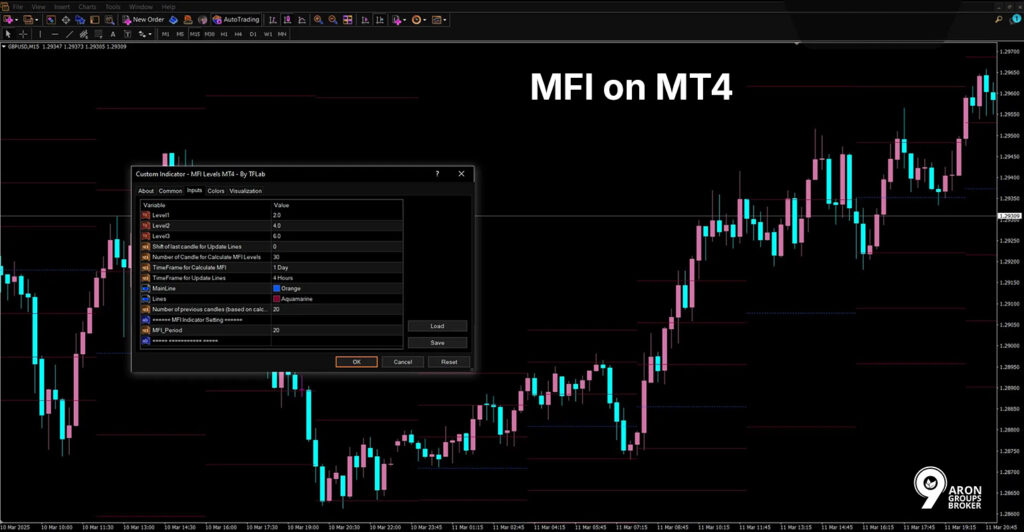
Most MFI indicator settings in MT4 are about display, not calculation. So, keep the default settings first, and only adjust colours or line style if you need better chart readability.
Q: Should I change the default settings in MT4 to make MFI more sensitive?
A: No. MFI doesn’t have period-based settings, such as moving averages. It calculates directly from each candle’s High, Low, and volume, so there’s no sensitivity parameter to adjust. If you want different behaviour, change your chart timeframe instead. Lower timeframes give you faster signals, and higher timeframes filter out noise.
Installing and Configuring MFI on MT5
In MetaTrader 5, the steps are almost the same as MT4, and the indicator is also under the Bill Williams group. You can add it using:
Insert → Indicators → Bill Williams → Market Facilitation Index.
This tool is part of the MetaTrader 5 default indicators, so it does not require a separate installation.
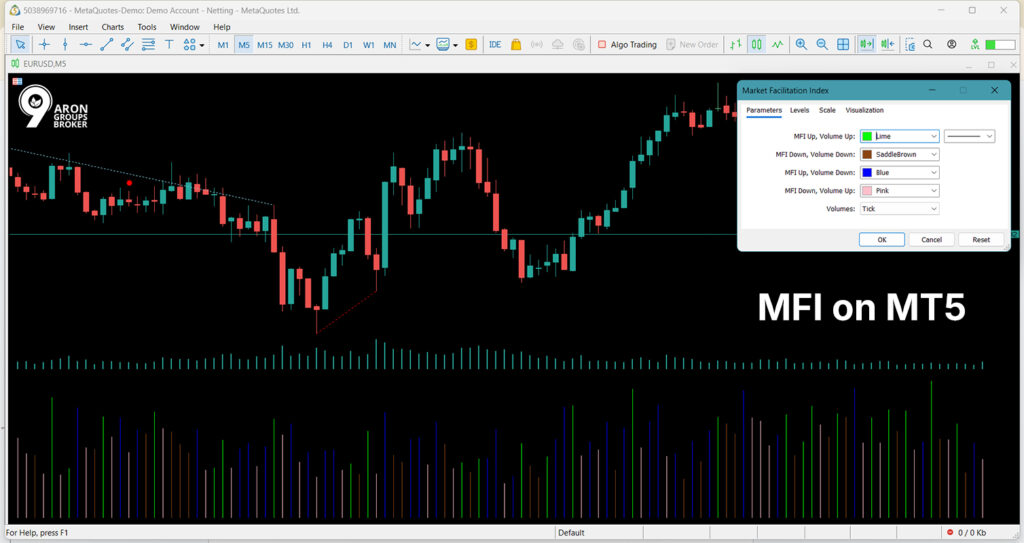
MT5 uses the same core calculation as well, so switching platforms does not change the meaning of the market facilitation index indicator. Only the layout and display options may look slightly different.
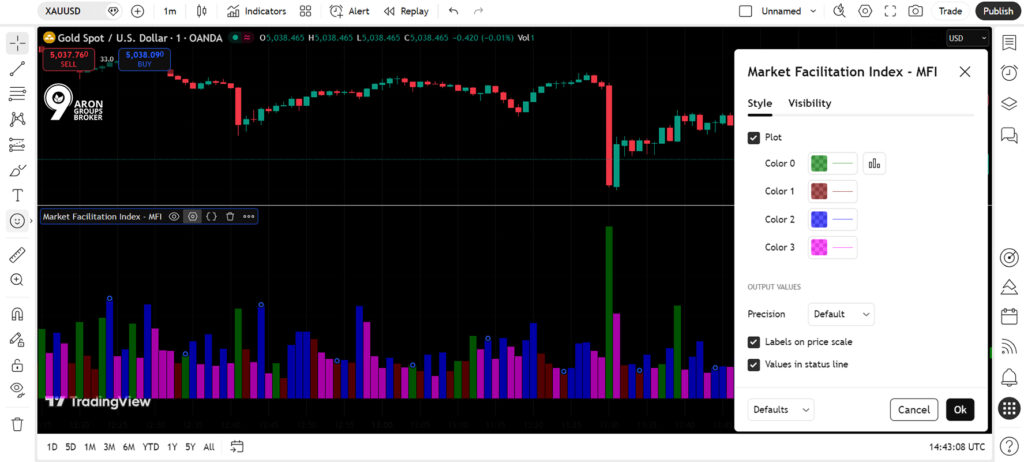
Setting Up MFI on TradingView
To set up MFI on TradingView, open the Indicators menu, type “Market Facilitation Index” in the search bar, and add it to your chart. Like MetaTrader, it usually appears in a separate indicator pane.
If you use a community script, make sure it matches the standard formula:
(High − Low) / Volume
Some scripts use variations, so their output may not fully match the classic definition.
Adjusting MFI Sensitivity for Different Markets
The market facilitation index (MFI) does not behave the same across all timeframes and markets. Because MFI is sensitive to candle-to-candle changes and tick volume, it reacts faster in some markets while producing noisy, high-frequency signals in others.
“Adjusting sensitivity” mainly means choosing the right timeframe and being stricter with confirmation.
On lower timeframes
MFI changes more quickly, so scalpers should expect more colour shifts and faster state transitions. A colour change alone is not enough. You should demand stronger confirmation from the price structure:
- A valid break.
- Consolidation after the break.
- A clear reaction at a key level.
In slower, heavier markets
Large-cap indices and similar instruments often work better on higher timeframes to reduce noise. In these markets, tick volume changes can be small and sometimes misleading. On lower timeframes, they may lead to wrong conclusions about participation and the quality of the price move.
Common Mistakes and How to Avoid Them
The goal is to recognise common errors when using the market facilitation index (MFI) so that your strategy doesn’t produce low-quality signals due to misunderstanding the data or market conditions.
Many problems arise not from the indicator itself, but from incorrect interpretation of tick volume, neglecting market conditions, and relying too heavily on a single tool.
Misreading Tick Volume
According to Forex Tester, one common mistake is treating tick volume like “actual trading volume” and building rigid, fixed rules based on it. These types of rules break down quickly when liquidity conditions change or the market enters different phases, and they don’t produce reliable output.
A better approach is to view tick volume as an indicator of participation, not actual volume. Then, before assessing a candle or bar as “strong”, examine it alongside price action and its position on the chart. Ask yourself:
- Has the candle formed at a significant level?
- Has a valid breakout occurred?
- Has the market’s reaction been logical?
Avoid making trading decisions based purely on high tick volume readings. Instead, use tick volume as one piece of context within your broader analysis of market structure and price behaviour.
Ignoring Market Conditions
MFI performs best when you understand the “trading session context” and market conditions. In a quiet, range-bound market, you might see signals that appear perfectly technical, but in practice, they don’t continue and lack follow-through. This is exactly where traders enter low-quality trades.
Pay special attention to these risk factors:
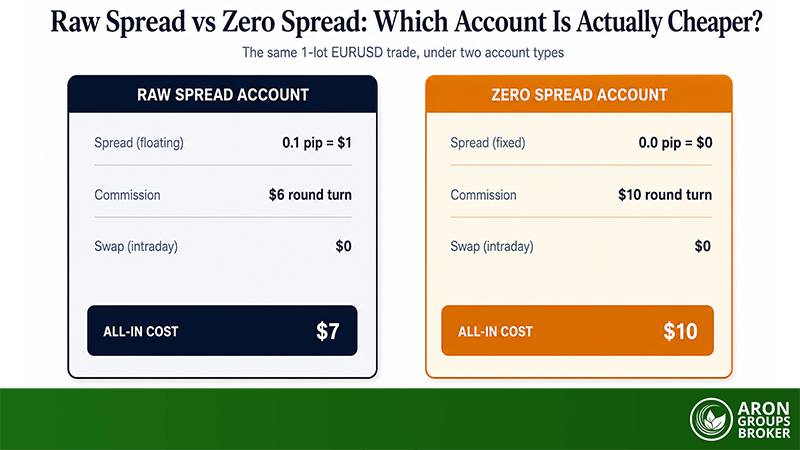
- Wide spreads: Transaction costs increase, and price action becomes less reliable
- High news risk: Scheduled announcements can trigger sudden, unpredictable moves
- Low liquidity sessions: Thin markets produce erratic price behaviour
If spreads widen or the news risk is high, you should prioritise risk management. In such conditions, volatility shocks can invalidate even the cleanest indicator reading. Therefore, it’s better to focus on conservative position sizing and precise stop-losses and avoid hasty trades.
Relying on a Single Indicator
A market facilitation index indicator strategy fails when it becomes a single-tool system.
The reason is simple:
The market might show high participation but provide no clear direction. In this case, indicator signals can lead you into choppy, high-risk ranges.
To avoid this mistake, combine MFI with other tools as explained earlier in this guide. Use structural tools like trendlines and support/resistance levels, and add momentum confirmation with tools like the Awesome Oscillator or Accelerator Oscillator.
Conclusion
The Market Facilitation Index won’t make trading decisions for you, and that’s exactly why it works.
It forces you to ask the right question before every trade: Is this move backed by real participation, or is it just price drifting on thin air? That one filter can cut your losing trades in half.
But MFI only delivers when used properly alongside structure, momentum confirmation, and a proper understanding of tick volume. Treat it as a standalone signal, and you’ll get chopped up. Treat it as a quality filter, and you’ll see which setups deserve your capital.