


The New York Reversal is one of the most-watched intraday setups in Forex, indices, and gold markets. It often appears after a strong London session move and forms during the New York open, when liquidity spikes and institutional orders enter the market.
In this guide, you will learn how the New York session reversal works, how to identify the ICT New York kill zone, and how to build a structured execution model for high-probability intraday trades.

- The New York Reversal works best when London expansion fails to clear higher-timeframe liquidity.
- The ICT New York kill zone (13:30–16:00 GMT) provides the timing window where liquidity spikes and institutional execution increase.
- The highest-probability New York open reversal setups align with premium/discount positioning and higher-timeframe bias.
- Not every stop hunt becomes a reversal; only a sweep followed by MSS and follow-through qualifies as a true smart money session reversal.
Foundations of New York Reversal
Before trading the New York Reversal, you must understand its structural logic. This setup is not about guessing tops and bottoms. It is about recognising how the London session begins a move, and the New York session completes and reverses it.
Understanding the New York Reversal: Key Principles
According to Forexfactory, the New York Reversal is an intraday price action setup that often forms in the ICT New York kill zone, when volatility increases after the U.S. market opens.
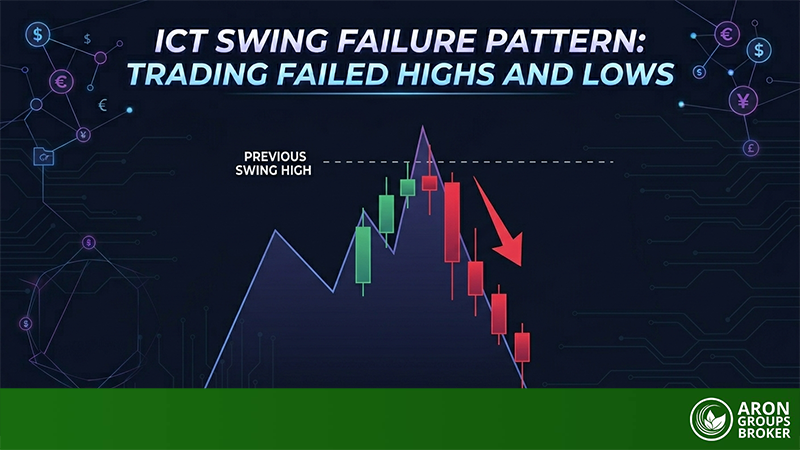
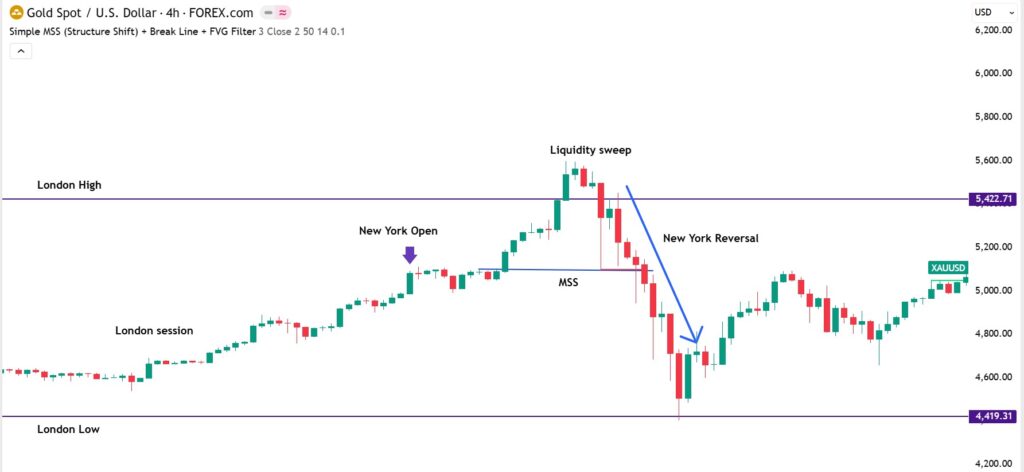
London session typically leads the move, but the price often fails to reach a key higher-timeframe level, such as the previous day’s high/low or a clear liquidity pool.
At the New York open, price frequently makes a final push to complete that missed objective, triggering a liquidity sweep and trapping late breakout traders.
After this sweep, intraday structure shifts and price flips direction, creating a high-probability New York session reversal and the classic New York open reversal.
Key principles to remember:
- London often creates intention, but not completion.
- New York often completes the objective, then reprices.
- The reversal usually occurs after the key level is reached, not before.
ICT Methodology Behind Intraday Session Reversals
In the New York reversal, the trade idea is built on liquidity engineering. The setup becomes tradable only after the market shows it has done two things:
- Finished the objective (a key liquidity level finally gets tagged in NY), and
- Changed behaviour (micro-structure stops respecting the old trend)
This is why traders who short too early get crushed. The higher-quality approach is to wait for evidence that institutions are no longer pushing continuation.
What does that evidence look like?
- A clean break of the most recent intraday swing structure after the key level is taken
- A strong impulse candle that leaves inefficiency (often an FVG)
- A controlled pullback that offers a defined entry zone
Q: If price taps the prior day’s high in New York, should I instantly sell?
A: No. A level getting hit is not a signal. The signal is the market failing to continue after hitting it.
Why the New York Session Reversal Matters for Traders
The New York open reversal matters because it often produces the day’s cleanest risk-to-reward window. The reason is simple: the market becomes “honest” only after liquidity is harvested. Before that, price action is designed to be misleading.
For intraday traders, this setup helps you avoid two common traps:
- Buying the final part of a London move right before it exhausts
- Selling too early without confirmation while the market is still hunting stops
Another key advantage is structural clarity. When the reversal is real, you can usually anchor your trade around very specific points.
That gives you tighter stops and more logical targets compared with random entries.
Morning vs Afternoon Reversals: Key Differences
According to Daytraderplaybook, a morning reversal is an early-session setup in which price initially moves one way, but market internals signal institutional activity.
The key tell is divergence between surface price direction and market breadth (advancing vs declining issues), which often shows up in the first 15–20 minutes.
Because that divergence appears before price fully “confirms” it, morning reversals can flip sharply and reward fast execution with clear level-based triggers.
By contrast, an afternoon reversal is usually less about early divergence and more about a move that has already trended and stretched, and is now fading into profit-taking and rebalancing.
Comparison table: Morning vs Afternoon Reversals
| Feature | Morning Reversal | Afternoon Reversal |
|---|---|---|
| Time of Occurrence | Forms shortly after the market opens, often within the first 15–30 minutes | Develops later in the session, usually after several hours of trending |
| Market Condition | Early directional push loses internal strength quickly | The extended trend becomes overstretched and loses momentum |
| Primary Driver | Divergence between price and market internals or order flow | Profit-taking, exhaustion, and institutional rebalancing |
| Volatility | Typically sharp and fast with aggressive moves | Slower and more controlled price development |
| Structure Formation | Quick shift in short-term structure after initial push | Gradual breakdown of trend structure over time |
| Risk Profile | Higher volatility requires fast execution and tight risk control | Generally cleaner setups with slightly wider but more stable entries |
| Trader Type Suitability | Best for active intraday traders comfortable with speed | Better suited for patient traders who wait for exhaustion signals |

A blunt reality:
If you can’t handle speed and you hesitate, afternoon setups might fit you better—slower, clearer, fewer fake-outs.
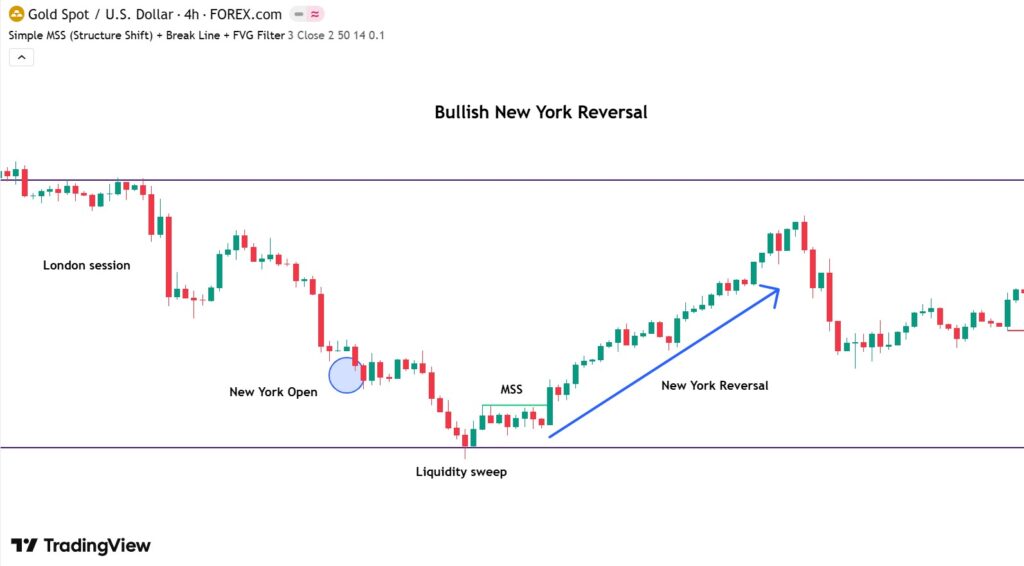
Practical Mechanics of NY Reversal
Understanding the New York Reversal requires more than spotting a sharp turn at the open. You must break down what actually happens during the transition from London to New York. Most high-probability reversals follow a mechanical sequence: liquidity is targeted, stops are triggered, and only then does structure shift.
The New York open brings a surge in volume. This is when institutions can execute large orders efficiently. If London has already created directional momentum but left obvious liquidity untouched, New York often becomes the session that completes the task.
Liquidity Sweeps and Stop Hunts at NY Open
During the New York open reversal, the price often targets visible liquidity created during London. Stops cluster above London highs and below London lows. Retail traders also place breakout orders around these levels.
Example:
London high forms at 1.2120 on GBP/USD. Buy stops and breakout entries sit above 1.2125. At 8:30 AM New York time, the price spikes to 1.2135, triggering those orders. Minutes later, the price falls back below 1.2120.
That move is a liquidity sweep in the New York session. It provides the fuel institutions need to take positions in the opposite direction.
Key point:
A stop hunt alone is not enough. The real trade appears only after the price fails to continue higher and breaks the short-term structure.
Smart Money Influence in New York Session Reversals
The smart money session reversal concept revolves around execution efficiency. Institutions do not reverse markets randomly. They need sufficient liquidity to enter or exit large positions without excessive slippage.
When New York opens, participation increases sharply. U.S. banks, hedge funds, asset managers, and futures traders enter the market. Volume in FX, gold, and indices rises significantly during this window. More participants mean deeper order books and tighter spreads.
This is why New York can provide liquidity. Large institutions need counterparties to execute size. The overlap between London and New York creates one of the most liquid periods of the day. That liquidity allows smart money to complete objectives and then reprice the market.
Key Insight:
The reversal is not random. It is usually the result of liquidity being engineered, filled, and then redistributed.
London Expansion’s Effect on New York Reversal
The relationship between London and New York is critical. London often creates the day’s initial expansion and directional bias. However, it frequently fails to fully clear higher-timeframe liquidity.
For example, Gold may rise from $4900 to $4940 in London, while the previous day’s high was $4950. Momentum slows. The level remains untouched.
At the New York open, the price pushes quickly to $4960, clearing the prior high. Once that liquidity is taken, selling pressure enters, and the price rotates lower.
The New York reversal often happens because New York finishes what London started.
Key Note:
If London had already cleared all major liquidity levels, the probability of reversal would be lower. In that case, continuation is more likely.
Timing & Market Structure
Timing is everything in a New York Reversal.
Enter too early, and you get trapped in the liquidity sweep. Enter too late, and the move is gone. The edge comes from combining session timing with structural confirmation.
Identifying the New York Kill Zone for Optimal Entries
According to ttrades, the ICT New York kill zone typically runs from 8:30 AM to 11:00 AM New York time (13:30 to 16:00 GMT).
This window overlaps with major U.S. data releases, and the equity market opens at 9:30 AM EST (14:30 GMT).
Volatility increases during this period because:
- U.S. institutional desks become active
- Futures and equities open
- Economic data is released
If London failed to reach a key liquidity level, this window often provides the final push.
Example:
EUR/USD trades between 1.0950 and 1.0980 during London. The previous day’s high sits at 1.0992. At 8:35 AM, the price spikes to 1.0998, then quickly drops back below 1.0980.
That spike inside the kill zone is the liquidity event. The trade opportunity appears only after price breaks short-term structure following the sweep.
Intraday Patterns Signalling Potential Reversals
Several intraday behaviours increase the probability of a New York session reversal:
- Sweep of London, high or low
- Failure to continue after the sweep
- Break of a short-term higher low or lower high
- Strong displacement candle, leaving an imbalance
For instance, assume Gold sweeps above $4950 during the New York open. Minutes later, price breaks below a recent higher low at $4030 with a strong bearish candle. That break signals a Market Structure Shift (MSS).
Q: After the liquidity sweep, how can you tell if a real reversal is forming?
A: Watch how the price behaves at the swept level. If the price shows aggressive rejection with strong displacement and quickly breaks the intraday structure, it suggests institutional selling and increases reversal probability. If price instead holds above the level and consolidates slowly without strong rejection, continuation risk remains high.
Recognising High-Probability Afternoon Reversals
An afternoon reversal behaves differently from the morning setup. It often forms after a strong directional move has already played out.
Typical signs include:
- Extended distance from the daily open
- Clear exhaustion near prior session highs or lows
- Slower structure breakdown instead of sharp displacement
Afternoon reversals usually offer smaller targets compared to morning kill zone setups. However, they often provide cleaner entries with less aggressive volatility.
Timing and Key Market Signals for New York Reversals
Many traders see a spike at the New York open and instantly fade it. That’s amateur behaviour. Spikes happen every day. A high-probability reversal is different: it shows a deliberate liquidity event, followed by a clear change in structure and momentum.
This section focuses on the signals that matter most during the New York open window: stop hunts, manipulation moves, MSS confirmation, and the hidden threat that ruins clean setups, high-impact news.
Use these signals like a checklist. If two or three are missing, the “reversal” is probably just noise.
Stop Hunt Strategies and Market Implications
A stop hunt in New York open is a targeted push into obvious liquidity. It often hits:
- London high/low
- Asian range high/low
- Previous day high/low
- Equal highs/lows
The strategy is not “sell the spike” or “buy the dip.” The strategy is to wait for the market to show it has collected stops and then lost the ability to continue.
Stop hunts create trapped traders. Those trapped positions become fuel for the reversal move.
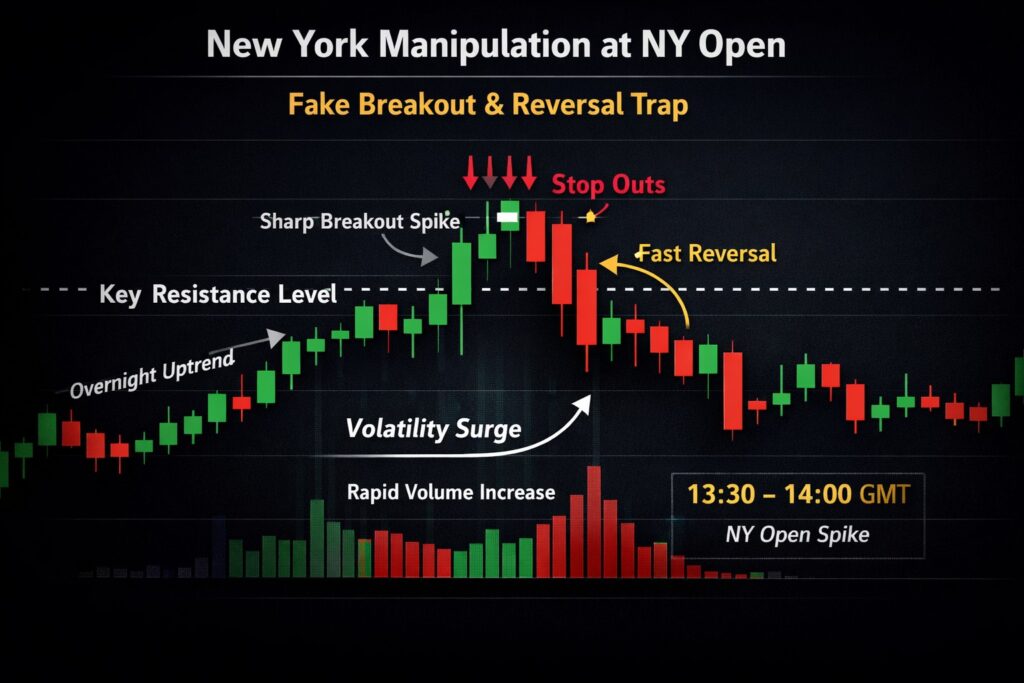
Manipulation Moves During NY Open
A New York manipulation move is the aggressive “fake continuation” phase that appears during the New York open liquidity burst. It is designed to do two things:
- Trigger breakout entries in the direction of the prior move
- Force premature counter-trend traders to stop out
This manipulation is usually quick and emotional. You’ll often see:
- Long wicks into a key level
- A sharp expansion candle followed by immediate rejection
- A sudden spread/volatility increase around 13:30–14:30 GMT
If you try to trade inside the manipulation candle, you are donating money. The smarter approach is to treat it as the setup’s “liquidity collection” step and wait for the structure to shift.
Market Structure Shift (MSS) Confirming a Reversal
A Market Structure Shift (MSS) is the confirmation that separates a true reversal from a simple pullback. In practice, it happens when the price stops respecting the current trend and breaks a protected swing point.
- In a bullish move, the market should keep printing higher highs and higher lows. An MSS forms when price breaks the most recent higher low that was holding the uptrend.
- In a bearish move, the market should keep printing lower lows and lower highs. An MSS forms when price breaks the most recent lower high that was holding the downtrend.
That break is the MSS. If the structure does not break, you are not trading a confirmed reversal — you’re guessing.
Q: What if price sweeps liquidity but never breaks structure?
A: Then it is likely continuation, consolidation, or a deeper pullback—not a reversal trade.
High-Impact News Risk at New York Open
High-impact news is the fastest way to break an otherwise clean New York Reversal setup. Many major U.S. releases drop at 13:30 GMT—including CPI, NFP, GDP, Retail Sales, and the Unemployment Rate—and they can override normal liquidity behaviour.
Why is the news risk so dangerous? Because it changes market mechanics:
- Order books thin out seconds before the release as liquidity providers pull quotes.
- Spreads widen, and slippage jumps, so your stop can be hit even if your idea is right.
- The first candle is often a volatility shock, not a true “smart money” move. It can sweep both sides, then choose a direction later.
On news days, reversals can still happen, but the market often needs extra time to “settle,” meaning the MSS may form later and stops often need more room.
Rules that keep you alive:
- Don’t enter right before a red-folder release. You’re gambling on the print.
- Let the first spike happen, then wait for an MSS and displacement to confirm direction.
- If spreads explode, cut position size or skip the trade entirely.
Practical ICT Trading Strategies
An ICT-based trading focuses on structure, liquidity, and timing. You are not predicting reversals. You are reacting to confirmed behaviour after liquidity has been taken. Every trade must answer three questions:
- Has liquidity been swept?
- Has market structure shifted?
- Is the entry aligned with the session timing?
If one of these is missing, the setup is incomplete.
Setting Up Trades for the New York Reversal
According to Tradingfinder, a structured New York session trading strategy follows a repeatable process:
- Step 1 – Identify the Draw on Liquidity
Mark London high/low, previous day high/low, and equal highs/lows. - Step 2 – Wait for the Sweep During 13:30–16:00 GMT
Do not enter before liquidity is taken. - Step 3 – Confirm Market Structure Shift (MSS)
That break confirms a potential bearish reversal. - Step 4 – Enter on Retracement
Wait for price to retrace into an imbalance (FVG) or order block.
Combining London and New York Session Analysis
A high-probability New York Reversal starts with proper session alignment. London builds the narrative. New York decides whether that narrative continues or collapses.
London often creates the initial expansion and directional bias. It shows where liquidity is building and where momentum is slowing. But London does not always complete the higher-timeframe objective.
Before trading the New York open, ask:
- Did London produce a clean directional move?
- Did price stall before reaching a key higher-timeframe level (previous day high/low, equal highs/lows, weekly level)?
- Is New York now pushing into that untouched liquidity?
Your answers to these three questions create four main scenarios:
| Scenario | London Session Behaviour | HTF Liquidity Status | New York Behaviour | Probability Bias | Trading Approach |
|---|---|---|---|---|---|
| Scenario 1 | Strong directional expansion | Not yet reached | Pushes into untouched liquidity | High reversal probability | Wait for liquidity sweep + MSS confirmation |
| Scenario 2 | Strong expansion | Already cleared | No new external target | Higher continuation probability | Look for pullback or trend continuation setups |
| Scenario 3 | Range-bound / choppy | Liquidity on both sides | Creates fresh expansion | Breakout probability | Trade NY breakout, not reversal |
| Scenario 4 | Strong trend | Untouched | Fails to reach key level | Delayed or weaker reversal | Wait for later session sweep or continuation |
Risk Management During Session Reversals
New York reversals are volatile. Risk must be precise.
Basic rules:
- Stop goes beyond the liquidity sweep high/low.
- Do not place stops inside the manipulation zone.
- Avoid over-leveraging during high-impact news days.
Position Sizing and Profit Targets for Intraday Moves
Intraday trading is not about massive moves. It is about consistent risk control.
Professional guidelines:
- Risk 0.5%–1% per trade
- Target at least 1:2 R: R
- Scale partial profits at internal liquidity levels
For profit targets:
- First target = internal liquidity (equal lows/highs)
- Second target = opposite side of daily range
Pro Tip:
The goal is not to catch the entire move.
The goal is to extract structured profit from a high-probability New York open reversal.
Practical Strategies for Trading New York Reversals
A professional New York session trading strategy focuses on precision entries after a displacement, not on emotional reactions during a spike. The goal is simple: enter where institutions are likely rebalancing, not where retail traders panic.
Entry on Retracement: FVG vs Order Block Return
After displacement, price often retraces before continuing. Two common ICT entry models are:
- Fair Value Gap (FVG) Entry
An FVG forms when a strong impulse leaves an imbalance. Price frequently retraces into that gap before resuming direction.
FVG entries are precise and offer tight stops. - Order Block (OB) Return
An order block represents the last opposing candle before displacement. Price may revisit that zone before continuing.
OB entries are slightly deeper retracements than FVG entries and may offer better R:R but require patience.
Premium/Discount Context Within Daily Range
A New York Reversal carries more weight when it aligns with PD arrays positioning inside the daily range.
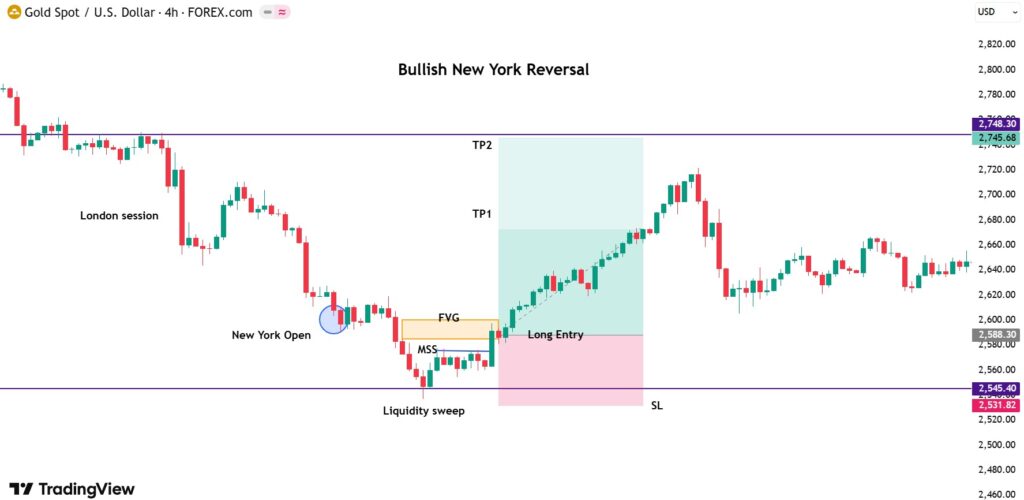
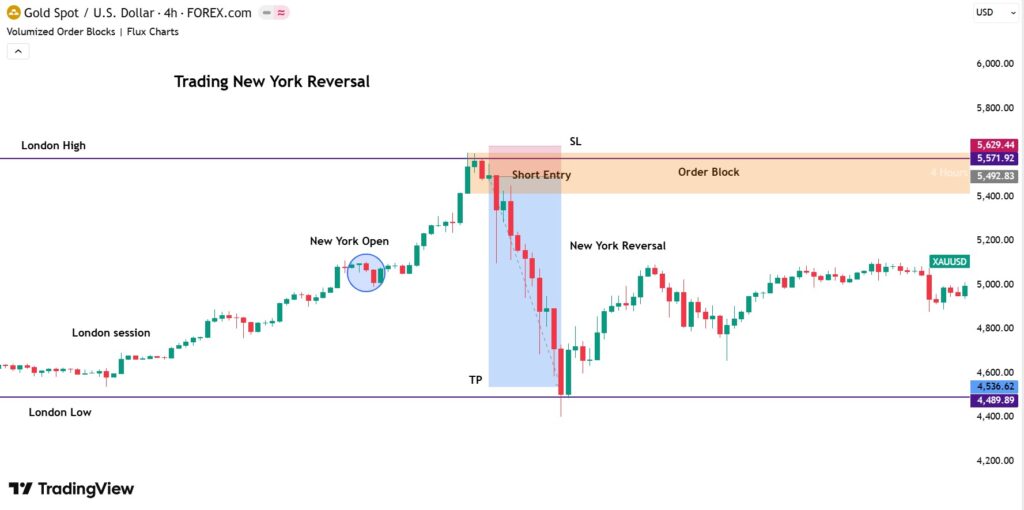
- If New York pushes price above the Premium zone, sweeps liquidity, and then shows an MSS while price remains in premium territory, short positions carry stronger structural logic.
- If New York pushes price below the discount zone, sweeps liquidity under the daily low or equal lows, and then prints a clear MSS while price remains in discount territory, long positions carry stronger structural logic.
Smart Money Session Reversal Tactics
Professional traders focus on behaviour, not indicators. A smart money session reversal typically shows:
- Aggressive liquidity grab
- Immediate rejection
- Displacement breaking structure
- Controlled retracement
Applying Liquidity Sweep Concepts to Trades
Liquidity is fuel. Without trapped traders, reversals lack momentum.
When liquidity above a key high is taken:
- Breakout buyers are trapped
- Short sellers are stopped out
- Buy-side liquidity becomes sell-side fuel
That trapped positioning creates an imbalance when smart money sells into it.
Your role is not to predict the sweep. Your role is to wait for it and trade the reaction.
Step-by-Step Entry and Exit in NY Open Reversals
Here is a cleaner execution framework built around structure and liquidity:
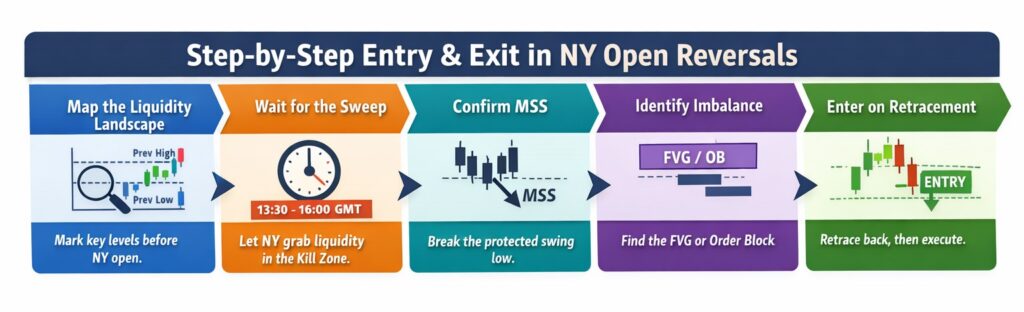
- Before New York opens, map the Liquidity Landscape
- Let New York Deliver the Sweep (13:30–16:00 GMT)
- A reversal is valid only after a Market Structure Shift (MSS)
- After displacement, identify the imbalance (FVG, OB)
- Enter on the Retracement, Not the Spike
Advanced Insights for New York Reversal
Advanced trading of the New York Reversal is not about reacting to volatility at the open. It is about preparation. Before 13:30 GMT arrives, you should already know whether the day statistically favours continuation or reversal. That decision comes from combining higher-timeframe bias with London session behaviour.
Professionals separate three stages:
Expectation → Confirmation → Execution.
Regarding ACY, a structured bias framework is useful in the Expectation stage:
Table: Quick NY Session Bias Map
| London Session Move | Higher-Timeframe (HTF) Bias | New York Likely Behaviour | Reversal Probability |
|---|---|---|---|
| Strong Bullish Expansion | Bullish | Continuation / Shallow Pullback | Low |
| Strong Bearish Expansion | Bearish | Continuation / Shallow Pullback | Low |
| Bullish move into HTF Supply | Bearish | Liquidity Sweep → Reversal | High |
| Bearish move into HTF Demand | Bullish | Liquidity Sweep → Reversal | High |
| Choppy London | Neutral | NY Defines Direction | Moderate |
How to Use the Bias Map
- If London aligns with a higher-timeframe trend, fading New York open strength is unlikely.
- If London drives directly into opposing higher-timeframe supply or demand, New York often completes liquidity and shifts structure. That is where New York session reversal setups become attractive.
- If London is choppy, New York is more likely to produce the day’s true expansion rather than a reversal.
Multi-Timeframe Confirmation Techniques for NY Reversals
Once the expectation is defined, move to confirmation.
A practical framework:
- Daily timeframe: Identify premium/discount positioning and major liquidity targets.
- 4H / 1H timeframe: Mark external liquidity pools and directional bias.
- 15M/5 M timeframe: Wait for the liquidity sweep and MSS confirmation.
Example:
- The daily chart shows the price trading in a premium above equilibrium.
- The 4H chart shows equal highs above the current price.
- The 5M chart shows the sweep of those highs during the New York open and a bearish MSS.
That alignment increases confidence.
If you are selling at a discount against a higher timeframe bullish bias, you are fighting momentum. Multi-timeframe context prevents that mistake.
Common Trader Mistakes During New York Reversals
Most losses come from impatience, not poor strategy.
Common errors:
- Selling before liquidity is swept
- Trading inside the manipulation candle
- Ignoring red-folder news at 13:30 GMT
- Fighting higher-timeframe bias
- Forcing reversals on clear continuation days
Distinguishing Stop Hunts from Genuine Reversals
Every reversal begins with a stop hunt. Not every stop hunt becomes a reversal.
Simple Stop Hunt:
- Sweep of liquidity
- Wick reaction
- Trend resumes
Genuine New York Reversal:
- Liquidity sweep
- Immediate MSS
- Strong displacement
- Controlled retracement
- Continuation in a new direction
The difference is follow-through. If the price cannot reclaim the swept level and decisively breaks the structure, institutional intent is visible.
Conclusion
The New York Reversal is not a random spike at the U.S. open. It is a structured liquidity event that often begins in London and completes in New York. When London extends but fails to reach a key higher-timeframe level, New York often delivers the final sweep before repricing the market.
The edge comes from preparation, not prediction. By combining session bias, liquidity mapping, Market Structure Shift (MSS), and disciplined execution inside the ICT New York kill zone, traders can turn volatility into a structured opportunity.