


Double bottoms and double tops are among the first reversal patterns traders encounter, but not all double formations carry the same weight. The Adam and Eve chart pattern is a specific variation where the two troughs (or peaks) have distinctly different shapes, and that structural difference is what gives it an edge.
In this guide, we break down how the pattern forms, why it signals a reversal, and how to trade it with clear entry, stop, and target rules. Whether you trade forex, indices, or crypto, the mechanics remain the same.
Overview of the Adam and Eve Chart Pattern
This section introduces the core concept, walks through how the pattern appears on a chart, and explains the reversal logic that makes it worth trading.
Risk Disclosure
CFDs are complex instruments and come with a high risk of losing money rapidly due to leverage. You should consider whether you understand how CFDs work and whether you can afford to take the high risk of losing your money. Past performance is not indicative of future results. This content is provided for educational purposes only and does not constitute investment advice.
Definition of the Adam and Eve Chart Pattern
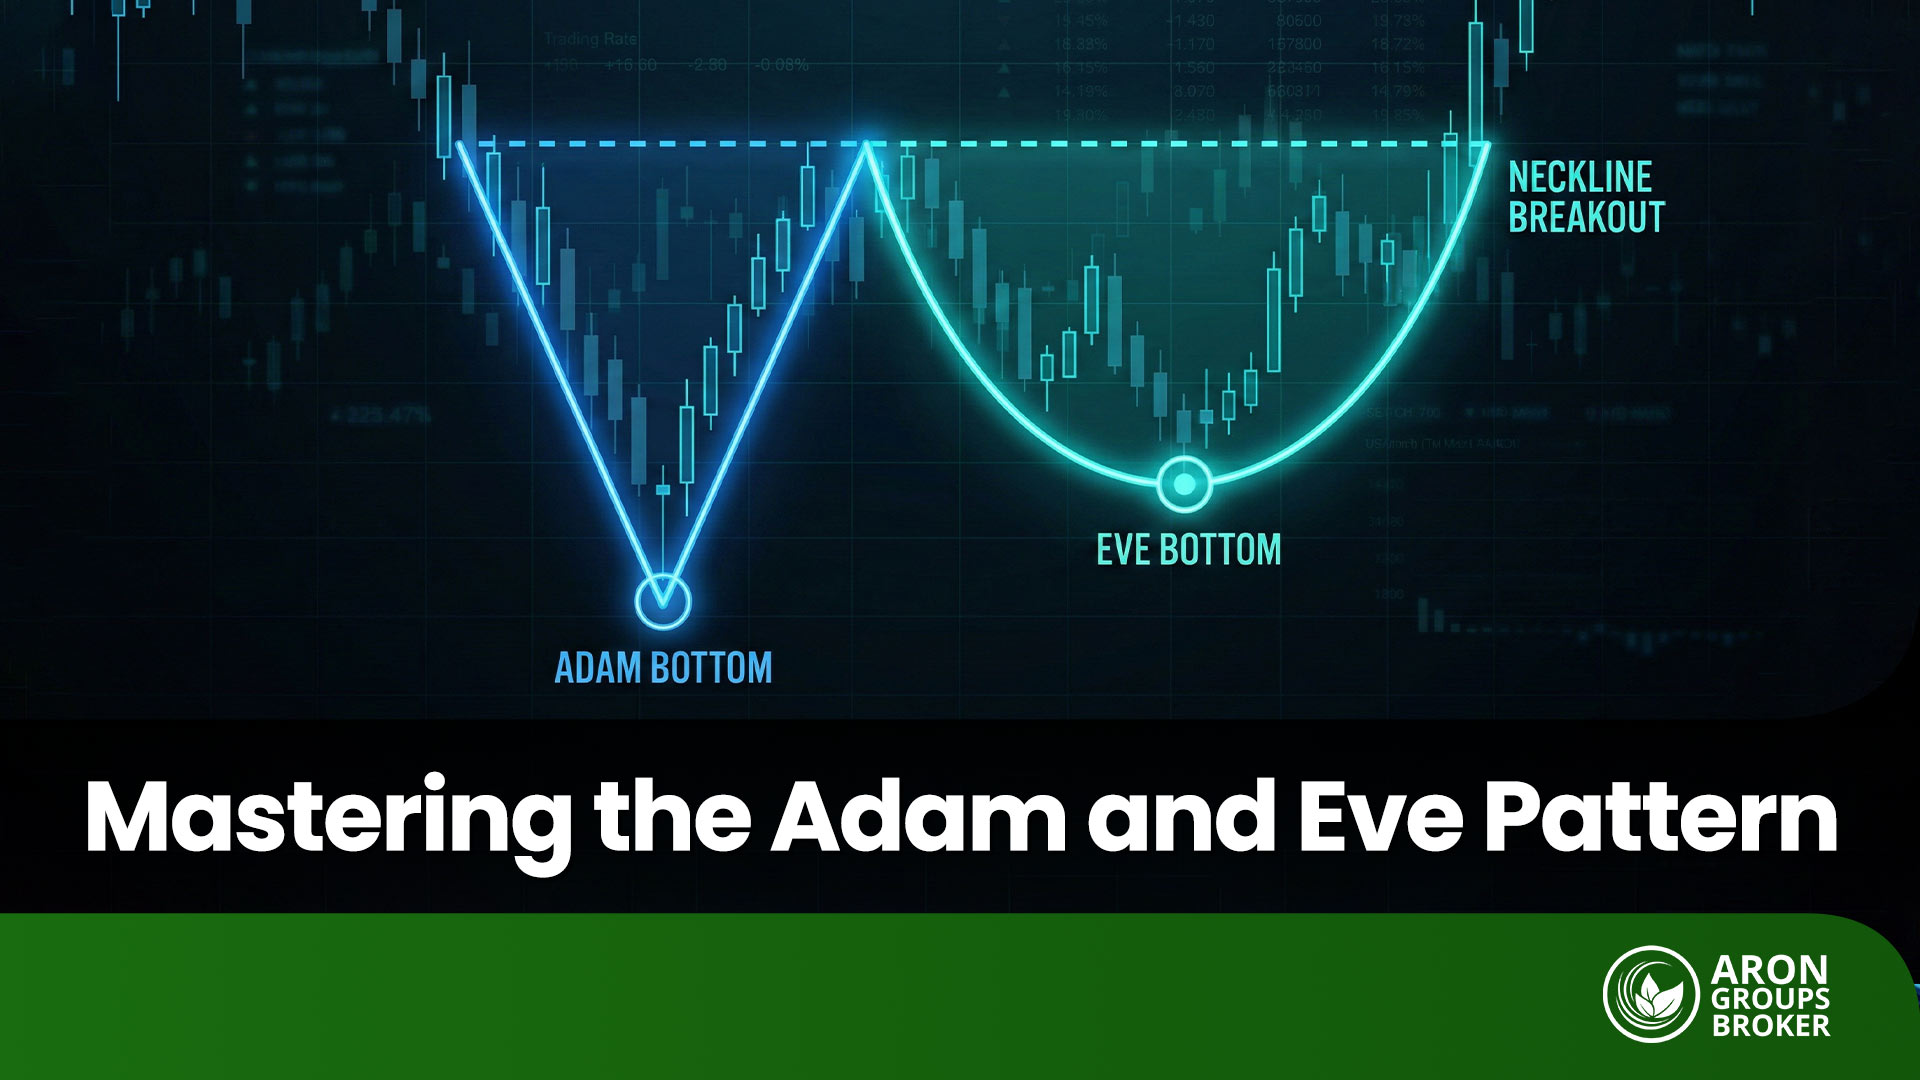
The Adam and Eve pattern is a double bottom (or double top) formation where the first trough or peak is sharp and narrow, while the second is rounded and broader. The sharp formation is referred to as Adam, and the rounded formation is called Eve.
What makes this pattern distinct from a standard double bottom is the contrast in shape.
Adam reflects a sudden, panic-driven move that reverses quickly, often on a single candle or a very tight cluster. Eve, by contrast, forms gradually as the market tests the same area with less urgency, building a wider base.

- Adam: V-shaped, sharp, narrow. Typically, a single spike or a tight group of candles with long wicks.
- Eve: U-shaped, rounded, wider. A gradual consolidation that tests the same price zone over multiple sessions.
- The two formations reach approximately the same price level, creating a recognisable double bottom or double top.
How the Adam and Eve Pattern Forms on a Price Chart
The pattern develops in two stages. First, during a downtrend, price drops sharply to a low and bounces aggressively. This creates the V-shaped Adam bottom. Volume during Adam tends to be elevated because the move is driven by emotional selling, followed by a snap reversal.
After the bounce, price rallies toward a resistance level (the neckline) but fails to break through. It pulls back again toward the same low area, but this time the decline is slower, and the bottom is rounded. This is the Eve formation.
Scenario Example
Imagine EURUSD is in a downtrend.
Price suddenly crashes 120 pips in one session and instantly rebounds.
This sharp spike forms the Adam bottom.
Price then rallies but fails to break resistance.
Over the next several sessions, it slowly drifts back toward the same low.
Instead of another sharp drop, price forms a rounded base.
This gradual structure is Eve.
When price finally breaks above the neckline, the Adam and Eve reversal is confirmed.
Eve typically shows declining volume as it consolidates, followed by increasing volume on the breakout above the neckline. The same logic applies in reverse for double top variations.
Why the Adam and Eve Pattern Signals a Trend Reversal
The reversal logic is rooted in how supply and demand shift between the two formations. Adam shows that sellers pushed price to an extreme, but buyers absorbed the pressure almost immediately. The sharp bounce signals that the low was rejected with conviction.
When Eve retests the same zone weeks or sessions later, the rounded shape indicates that sellers have lost momentum. They can no longer drive price down with the same force. Meanwhile, buyers are accumulating quietly during the consolidation.
The neckline breakout confirms that demand has fully overtaken supply. This transition mirrors the mechanics of a market structure shift, where the balance of power between buyers and sellers changes decisively
Q: What is the Adam and Eve pattern?
A: It is a double bottom (or double top) where the first formation is sharp and V-shaped (Adam) and the second is rounded and U-shaped (Eve). The contrast between the two shapes reflects a shift in market sentiment from panic to controlled accumulation, making the subsequent breakout more reliable.
Structure of the Adam and Eve Pattern
Recognising the pattern correctly depends on understanding the specific characteristics of each component. This section covers the Adam formation, the Eve consolidation, and how to draw the neckline accurately.
Identifying the V-Shaped Adam Formation
Adam is defined by a sharp, sudden move to the low (or high, in a double top). On a candlestick chart, it often appears as one or two candles with long wicks and full bodies, suggesting a rapid rejection of the price level.
The key feature is the narrowness. If you were to draw a line around the bottom, it would form a tight V shape. The bounce from Adam is typically aggressive, covering a significant portion of the prior decline in just a few sessions.
Volume during Adam is usually above average. This spike in activity reflects the emotional nature of the move, whether it is panic selling at a bottom or euphoric buying at a top.
Recognising the U-Shaped Eve Consolidation
Eve is the opposite in character. Price approaches the same zone as Adam, but instead of a sharp spike, it rolls over gradually. The bottom (or top) is rounded and extends over several candles, sometimes spanning multiple trading sessions.
Volume during Eve tends to contract as the consolidation deepens. This declining volume is constructive because it shows that selling pressure is drying up. Towards the right side of Eve, as price begins to turn back toward the neckline, volume often starts to pick up again.
The width of Eve relative to Adam is an important visual cue. If both formations look equally sharp or equally rounded, you are likely looking at a standard double bottom rather than a true Adam and Eve pattern.
Drawing the Neckline in an Adam and Eve Chart Pattern
The neckline connects the high point between Adam and Eve. In a double bottom, this is the peak of the rally that separates the two troughs. In a double top, it is the low between the two peaks.
Draw the neckline as a horizontal line at the closing price of that intermediate high (or low). Some traders use the wick, but the body close tends to produce more reliable breakout signals.
The neckline serves as the trigger. The pattern is not confirmed until price closes above the neckline (double bottom) or below it (double top) on a meaningful candle with supporting volume.
For a general introduction to neckline mechanics in double formations, see Investopedia’s overview of double bottom patterns.
Q: How do I distinguish Adam from Eve on a chart?
A: Adam is narrow and sharp, typically one to three candles with long wicks forming a tight V. Eve is wider and rounded, spanning several candles in a gradual U shape. If both formations look the same, the pattern is a standard double bottom or top, not an Adam and Eve variation.
Types of Adam and Eve Patterns
The Adam and Eve formation appears in both bullish and bearish contexts. This section covers the three main variations traders encounter.
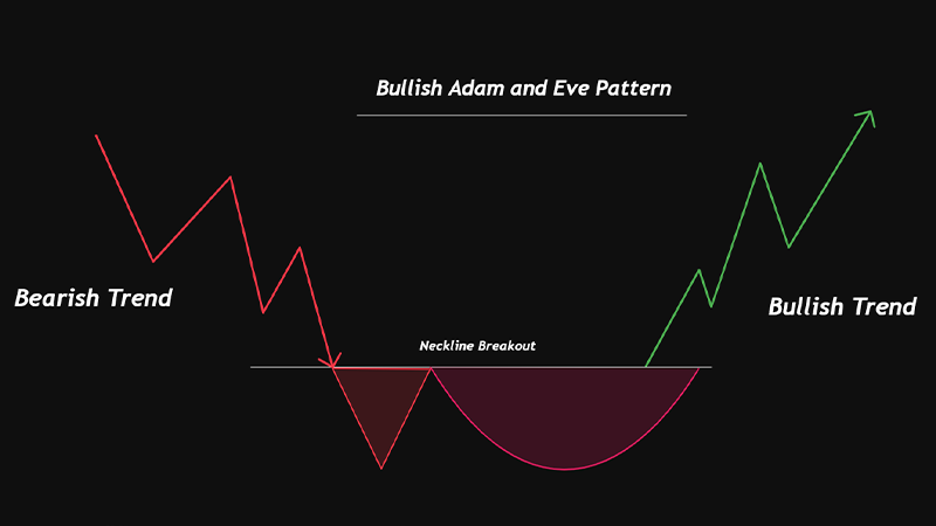
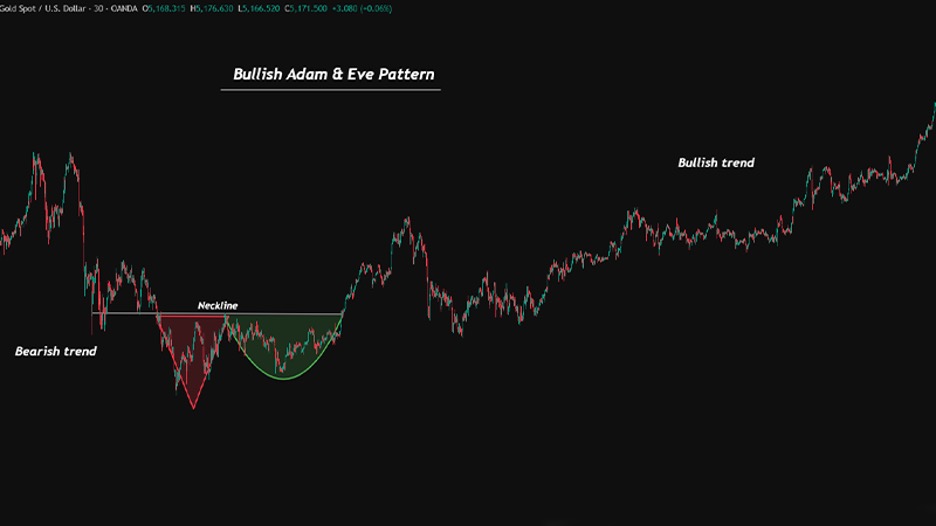
Adam and Eve Double Bottom Pattern (Bullish Reversal)
This is the most commonly referenced version. It forms at the end of a downtrend, with Adam creating a V-shaped low and Eve forming a rounded low at approximately the same level. The breakout above the neckline signals a bullish reversal.
The bullish Adam and Eve double bottom is particularly effective when it forms near a significant support level or a higher-timeframe demand zone. The confluence of the pattern structure with an existing support area increases the probability of a sustained move higher.
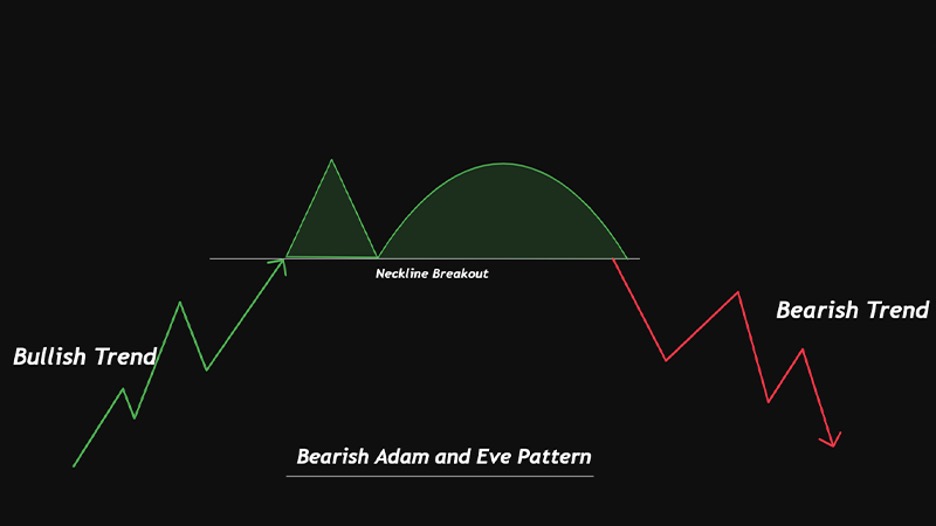
Adam and Eve Double Top Pattern (Bearish Reversal)
The bearish version is the mirror image. During an uptrend, price spikes sharply to a high (Adam), pulls back, and then grinds back toward the same level in a rounded formation (Eve). A breakdown below the neckline confirms the bearish reversal.
Bearish Adam and Eve patterns are sometimes harder to spot because rallies tend to be more gradual than sell-offs. The Adam peak in a double top often coincides with a news spike or a liquidity grab above a key high.
Inverse Adam and Eve Pattern Explained
The inverse Adam and Eve pattern reverses the order of the formations. Eve appears first as a rounded bottom (or top), followed by Adam as a sharp second formation. The reversal logic remains the same: the pattern signals a shift in momentum.
Some traders refer to this as the Eve and Adam pattern. The key difference is that the gradual formation comes first, suggesting that the market was already absorbing supply (or demand) quietly before the sharp second test confirmed the level.
| Adam and Eve (Standard) | Eve and Adam (Inverse) |
|---|---|
| Sharp formation first, rounded second | Rounded formation first, sharp second |
| V-shape followed by U-shape | U-shape followed by V-shape |
| More common in textbook examples | Less frequently discussed but equally valid |
| Adam often driven by panic/news | Eve shows quiet accumulation first |
| Breakout follows Eve consolidation | Breakout follows Adam spike |
Q: Is the bearish Adam and Eve pattern as reliable as the bullish version?
A: Both versions follow the same structural logic. Bearish Adam and Eve double tops can be slightly harder to identify because uptrend peaks are often less dramatic than downtrend lows. However, when confirmed with a neckline breakdown and volume expansion, the bearish version is equally tradeable.
Trading the Adam and Eve Pattern
Identifying the pattern is only half the job. This section provides specific entry, stop loss, and confirmation rules for both bullish and bearish setups.
Entry Rules After a Confirmed Neckline Breakout
The safest entry occurs after a candle closes above the neckline (bullish) or below it (bearish) with above-average volume. A close through the neckline that lacks volume may indicate a false breakout.
Conservative traders wait for a retest of the neckline after the breakout. Price often pulls back to the neckline area before continuing in the breakout direction. Entering on the retest provides a tighter stop and a better risk-to-reward ratio.
Pro Tip
Neckline retests often provide the best entry.
After the breakout, price frequently pulls back to test the neckline as support or resistance.
Entering on the retest allows traders to:
- Reduce stop loss distance
- Improve risk-to-reward
- Confirm the breakout is valid
Aggressive traders enter on the breakout candle itself, placing the order as soon as the candle closes beyond the neckline. This approach captures more of the initial move but carries the risk of a failed breakout.
Stop Loss Placement in Adam and Eve Double Bottom Setups
In a bullish double bottom, the stop loss goes below the lower of the two formations. If Adam made a deeper hole than Eve, the stop sits below Adam’s wick. If Eve dipped slightly lower, the stop sits below Eve.
A common approach is to place the stop a few pips (or points, depending on the instrument) below the absolute low of the pattern. This gives the trade enough room to breathe without exposing you to excessive risk.
Stop Loss Placement in Adam and Eve Double Top Setups
For bearish double tops, the stop loss goes above the higher of the two peaks. The logic is identical: you are placing the stop beyond the point where the pattern would be invalidated.
If Adam spiked higher than Eve (which is common in news-driven peaks), the stop should sit above Adam’s wick. Add a small buffer to account for spread and minor volatility.
Q: Should I enter on the breakout or wait for a retest?
A: Both approaches are valid. Entering on the breakout gives you a better fill if the move is strong, but you risk a false breakout. Waiting for a retest gives you a tighter stop and better risk-to-reward, but the retest does not always occur. Many traders split their position: partial entry on the breakout, the rest on the retest.
Adam and Eve Pattern Target and Trade Management
A pattern without a clear target is difficult to manage. This section covers how to project the Adam and Eve pattern target and how to handle the trade once it is live.
How to Calculate the Adam and Eve Pattern Target
The target is calculated by measuring the height of the pattern and projecting that distance from the neckline breakout point.
For a double bottom: measure the distance from the lowest point of the pattern (typically Adam’s low) to the neckline. Then add that distance to the neckline level. The result is your minimum price target.
For a double top: measure from the highest point (Adam’s peak) down to the neckline, then subtract that distance from the neckline. That gives you the projected downside target.
Target calculation example (bullish)
Adam’s low: 1.0750
Neckline: 1.0900
Pattern height: 1.0900 – 1.0750 = 150 pips
Target: 1.0900 + 0.0150 = 1.1050
Measuring Pattern Height for Price Target Projection
Always measure from the absolute extreme of the pattern (the deepest low or highest high) to the neckline. Using the candle body rather than the wick will give a more conservative target, which tends to be hit more frequently.
Some traders use 75% of the pattern height as their primary target rather than the full projection. This approach sacrifices potential profit for a higher hit rate and is worth considering in choppy or ranging conditions.
Managing Risk-to-Reward in Adam and Eve Trades
Before entering any Adam and Eve trade, calculate the risk-to-reward ratio. The distance from your entry to the stop loss is your risk. The distance from your entry to the target is your reward.
A minimum ratio of 1:1.5 is generally expected from a valid Adam and Eve setup. If the pattern is shallow (the height is small relative to the neckline level), the trade may not offer enough reward to justify the risk.
Once the trade is live, consider trailing your stop to breakeven after price has moved halfway to the target. This protects your capital while giving the trade room to reach its full projection.
For further reading on risk management principles in leveraged markets, the Bank for International Settlements offers a comprehensive overview of market risk frameworks.
Q: How accurate is the Adam and Eve pattern target?
A: The measured move target is a guideline, not a guarantee. In trending markets, price often exceeds the target. In choppy conditions, it may fall short. Using 75% to 100% of the pattern height as your projection gives a realistic expectation. Always pair the target with nearby support and resistance levels for confirmation.
Applying the Adam and Eve Pattern in Different Markets
The Adam and Eve pattern is not limited to a single market. This section covers how it behaves in crypto, forex, and across different timeframes.
Trading the Adam and Eve Crypto Pattern
Crypto markets are well suited to the Adam and Eve formation because of their tendency toward sharp, volatile moves followed by slower consolidations. The Adam formation in crypto often appears as a liquidation cascade, where leveraged positions are flushed out in a single candle.
Eve then forms as the market recovers and tests the same zone with less volatility. The 4-hour and daily timeframes on pairs like BTCUSD and ETHUSD tend to produce the cleanest Adam and Eve crypto patterns.
One consideration specific to crypto is that volume data varies by exchange. Use aggregate volume where available, or stick to the exchange with the deepest liquidity for your chosen pair.
Using the Adam and Eve Candlestick Pattern in Forex
In forex, the Adam and Eve pattern frequently appears on the 1-hour, 4-hour, and daily charts. Major pairs like EURUSD, GBPUSD, and USDJPY offer the liquidity and smooth price action needed to form clean patterns.
Forex-specific factors to consider include session timing (patterns that complete during the London or New York session are generally more reliable) and news events (a breakout that coincides with a high-impact release may produce a false signal followed by a reversal).
Choosing the Right Timeframe for Adam and Eve Patterns
Higher timeframes produce more reliable signals. A daily-chart Adam and Eve pattern carries significantly more weight than one on the 15-minute chart because the daily formation reflects broader market participation.
That said, lower timeframes can be used for entries within a higher-timeframe context. For example, if a daily chart shows the Eve consolidation forming near a known support, dropping to the 1-hour chart to time the breakout entry is a valid approach.
Q: Does the Adam and Eve pattern work in crypto?
A: Yes. Crypto markets frequently produce Adam and Eve formations because of their high volatility. The sharp liquidation-driven moves in crypto often create textbook V-shaped Adam bottoms. Use the 4-hour or daily chart for the cleanest signals and confirm with volume data from a liquid exchange.
Common Mistakes When Trading Adam and Eve Patterns
Even a well-structured pattern can fail if the trader misidentifies it or enters poorly. This section covers the most frequent errors and how to avoid them.
Adam and Eve Pattern Validation Checklist
Before trading the pattern, confirm the following:
- Adam is clearly V-shaped
- Eve is clearly rounded and wider
- Both formations reach similar price levels
- The neckline is clearly defined
- Breakout occurs with volume expansion
- No major resistance/support blocks the target
Misidentifying V-Shaped Bottoms and U-Shaped Consolidation
The most common mistake is labelling any double bottom as an Adam and Eve pattern. For the pattern to qualify, the contrast between the two formations must be visually obvious. If both bottoms look rounded, you have a standard double bottom. If both are sharp, you have a different variation entirely.
Take the time to zoom out and assess the shape of each formation independently. Adam should be distinctly narrow, and Eve should be distinctly wide. If you have to squint to see the difference, the pattern is probably not there.
If the structure has three distinct points rather than two, you may be looking at a Quasimodo (QM) reversal pattern instead.
Trading Before Breakout Confirmation
Entering the trade before the neckline is broken is a common error, especially among traders who anticipate the breakout. The risk is that price may reject the neckline and reverse, turning what looked like an Adam and Eve setup into a range-bound structure.
Always wait for the close above (or below) the neckline. A wick through the neckline is not enough. The candle must close beyond it, and ideally, the close should be accompanied by an increase in volume.
Adding a momentum filter such as bullish RSI divergence can further validate the breakout signal.
Ignoring Support and Resistance Levels
The Adam and Eve pattern does not exist in isolation. If the breakout target runs directly into a major resistance level (in a bullish setup) or a major support level (in a bearish setup), the trade may stall before reaching the full projection.
Before entering, mark the nearest significant support and resistance levels on the chart. If a major level sits between your entry and your target, adjust the target or reduce position size to account for the potential obstacle.
Q: What invalidates an Adam and Eve pattern?
A: The pattern is invalidated if price breaks below the low of Adam and Eve (in a bullish setup) or above the high of Adam and Eve (in a bearish setup) before the neckline is broken. It is also considered invalid if the neckline breakout occurs on very low volume and the price immediately reverses back inside the pattern.
Conclusion
The Adam and Eve chart pattern is a specific, high-probability variation of the classic double bottom and double top. Its defining feature is the contrast between the sharp Adam formation and the rounded Eve consolidation, which reflects a genuine shift in market sentiment.
To trade it effectively, focus on three things: confirm the structural contrast between Adam and Eve, wait for a neckline breakout with volume, and set your target using the measured-move technique.
The pattern works across forex, crypto, and indices, and it is most reliable on the 4-hour and daily timeframes. Like any technical pattern, it should be used alongside a broader context, including support and resistance levels, higher-timeframe bias, and sound risk management.