 EN
EN


Technical

-
Identifying the Best Trend Strength Indicator for Reliable Trading Decisions
 24 March 2026
,
Abe Cofnas
24 March 2026
,
Abe Cofnas
Experienced traders know that trend strength is just as important as direction. A strong trend can offer high-probability trading opportunities, while a weak trend often leads to false signals and sudden reversals. Among trend strength indicators, many professionals consider ADX to be the best trend strength indicator, especially in Forex markets. In this guide, we […]
- Read more

-
High-Probability ICT Scalping for Fast Intraday Entries
27 February 2026
,
Abe Cofnas
An ICT scalping strategy is a fast intraday entry model built for 1 clean move, not a full session trend. It works when you trade inside Kill Zones, identify a clear liquidity draw (BSL/SSL), then execute the same sequence: Sweep → Displace → Retrace → Enter. The real question is this: are you scalping a […]
- Read more

-
Optimal Trade Entry Techniques for ICT Traders
27 February 2026
,
Abe Cofnas
Optimal Trade Entry (OTE) is a way ICT traders use Fibonacci to find a high-probability pullback zone inside a clear swing (usually the 61.8% to 79% retracement), but the real question is this: are you using it as a smart location tool (with structure and liquidity), or just drawing fibs on every dip and hoping […]
- Read more

-
Turn Market Gaps into Opportunities with ICT Liquidity Voids
27 February 2026
,
Abe Cofnas
Have you ever noticed how prices in markets sometimes jump quickly, skipping over certain levels like a space? That’s a liquidity void. a spot where few trades occur due to imbalances caused by big players, often in ICT liquidity void setups. It creates price inefficiency zones that pull prices back, offering chances in liquidity void […]
- Read more

-
A Step-by-Step Guide to Trading Bullish Divergence RSI
27 February 2026
,
Abe Cofnas
Price does not move randomly. It often slows down before changing direction, and momentum indicators help traders spot that shift early. One of the most reliable signals is bullish divergence RSI, which appears when the price continues falling but the RSI indicator starts rising. This pattern can signal weakening selling pressure and a possible reversal. […]
- Read more

-
How to Trade Using the MACD and Alligator Strategy
26 February 2026
,
Abe Cofnas
The MACD and alligator strategy is a simple method that helps traders understand when a market may start moving up or down. It combines the MACD indicator, also called Moving Average Convergence Divergence, with the Bill Williams Alligator indicator to spot trends and measure momentum. Even if you are new to trading, this approach can […]
- Read more

-
Buy Side vs Sell Side Liquidity: A Trader’s Guide to Market Flow
25 February 2026
,
Abe Cofnas
Understanding buy side and sell side liquidity reveals why price often sweeps highs or lows before strong moves. Buy-side liquidity often forms above recent highs, where stop-loss orders from short positions tend to cluster, while sell-side liquidity commonly develops below recent lows, driven by stop placements from long positions. However, these areas do not consist […]
- Read more

-
A Trader’s Guide to ICT Liquidity and Market Sweeps
24 February 2026
,
Abe Cofnas
In ICT, liquidity is treated as a market execution feature rather than an assumption about intent. It refers to areas where orders are likely to cluster and where execution is typically easier because more participants are active around the same visible price levels. This shifts the trader’s focus away from reacting to sudden spikes and […]
- Read more
-
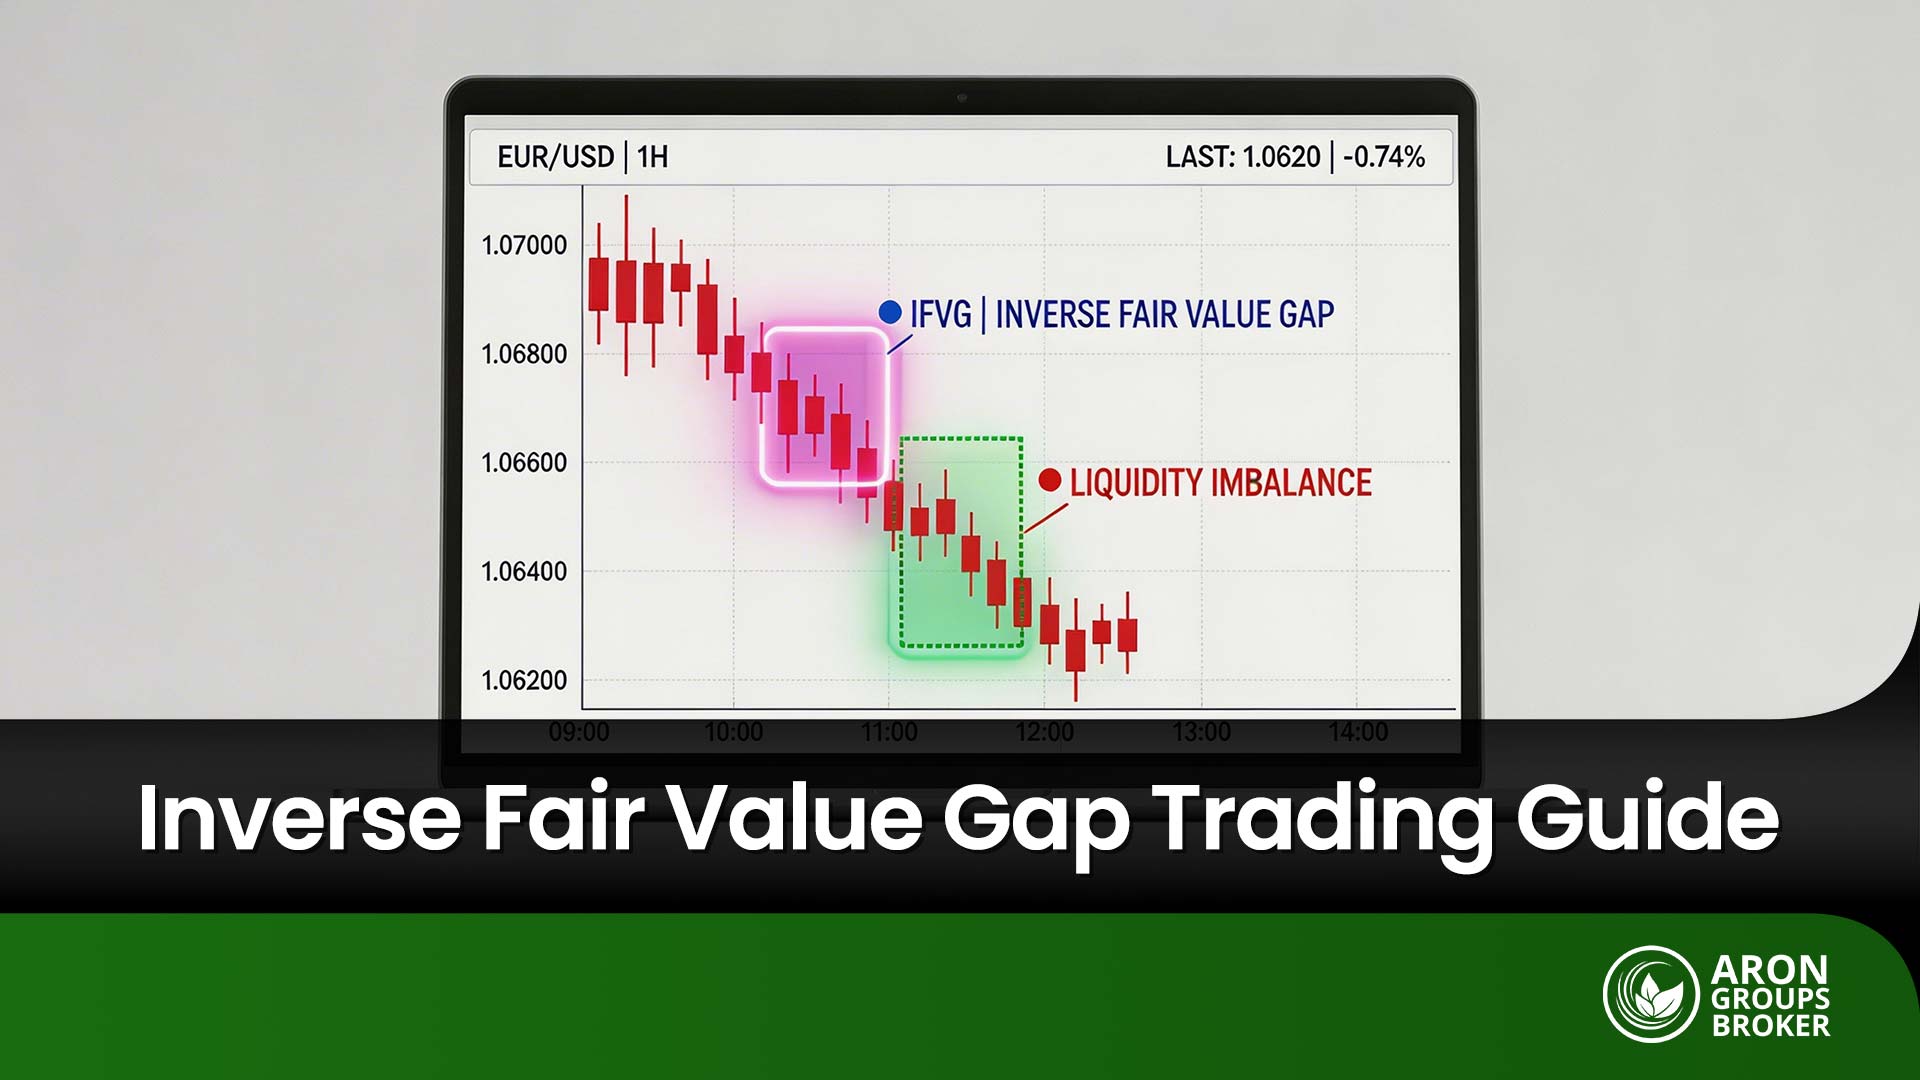
How to Trade the Inverse Fair Value Gap and Its Key Rules
24 February 2026
,
Abe Cofnas
The inverse fair value gap (IFVG) is one of the most useful price concepts in modern technical trading. It describes a failed fair value gap that flips its role from support to resistance, or from resistance to support. This guide explains what an IFVG is, how it forms, and how to build a clear trading […]
- Read more
-
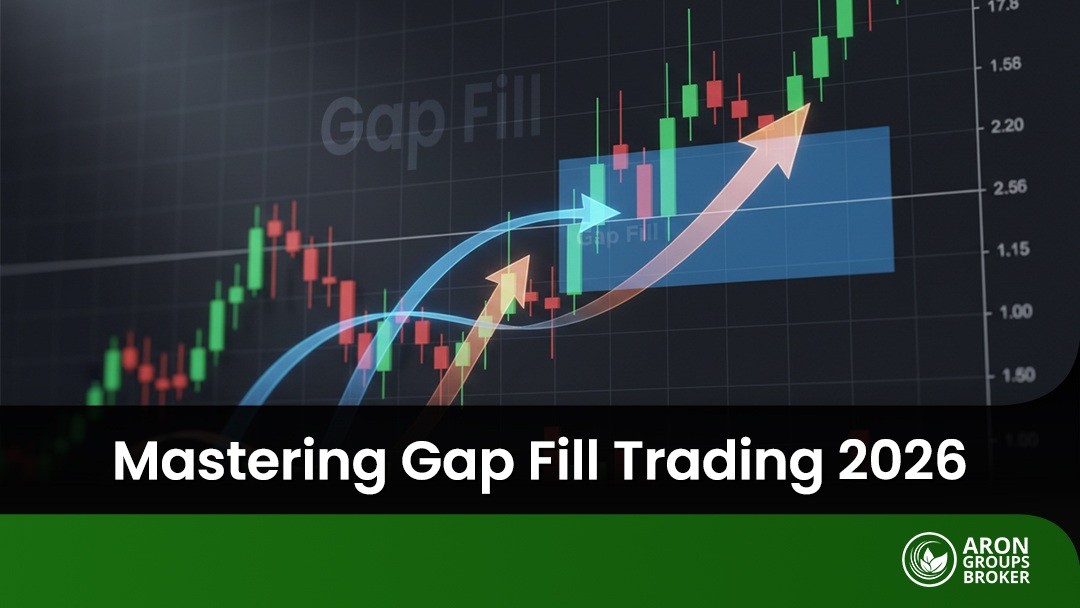
How to Profit from Market Gaps: Gap Fill Trading Explained
24 February 2026
,
Abe Cofnas
When the price jumps from one session to the next without trading through the levels in between, traders call it a market gap. On the chart, it appears as an empty price zone with little or no trading.A gap fill strategy focuses on finding opportunities where the price reverses back into the gap as the […]
- Read more
Load more