 EN
EN


Technical
-
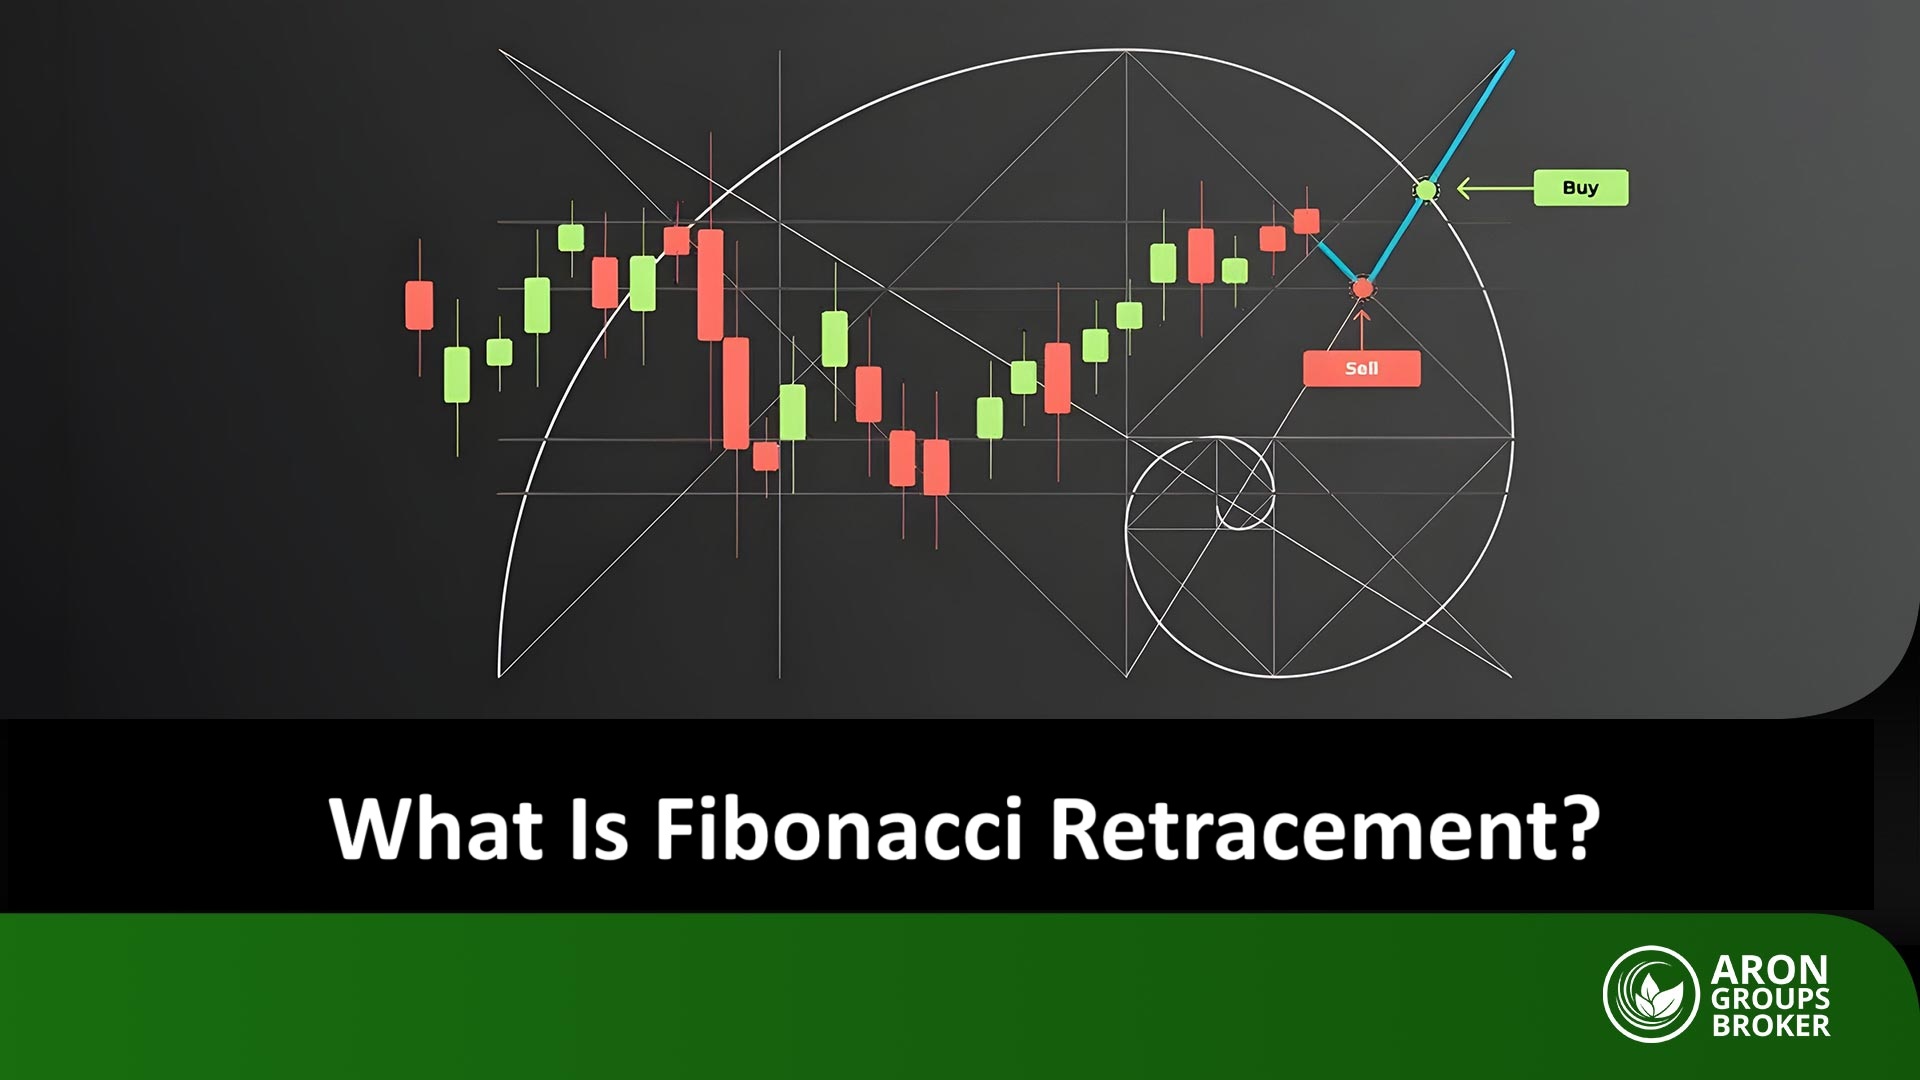
Comprehensive Guide to Fibonacci Retracement
 4 November 2025
,
Abe Cofnas
4 November 2025
,
Abe Cofnas
Fibonacci Retracement, also known as Fibonacci Pullback or Fibonacci Correction, is one of the most important and widely used tools in technical analysis. It helps traders and investors identify potential price reversal levels, allowing them to make more informed buy and sell decisions. In this article, we’ll explore the fundamentals of the Fibonacci sequence, the […]
- Read more
-
From Market Bottom to Top with Hammer and Inverted Hammer Candles
3 November 2025
,
Abe Cofnas
Trading in financial markets isn’t just about following trends. Sometimes, a small signal hidden within a single candlestick can mark the beginning of a significant reversal. The hammer candlestick is one such subtle yet powerful sign. It often appears when the market reaches a turning point, when the forces of supply and demand begin to […]
- Read more
-
How to Use the ASI Indicator to Confirm Trends & Breakouts
29 October 2025
,
Abe Cofnas
Many traders at the beginning of their journey face the question of how to identify the market’s main trend amid short-term price fluctuations. One of the tools that proves highly useful in this context is the Accumulative Swing Index (ASI). This indicator analyzes consecutive price movements to provide a clearer view of the overall market […]
- Read more
-
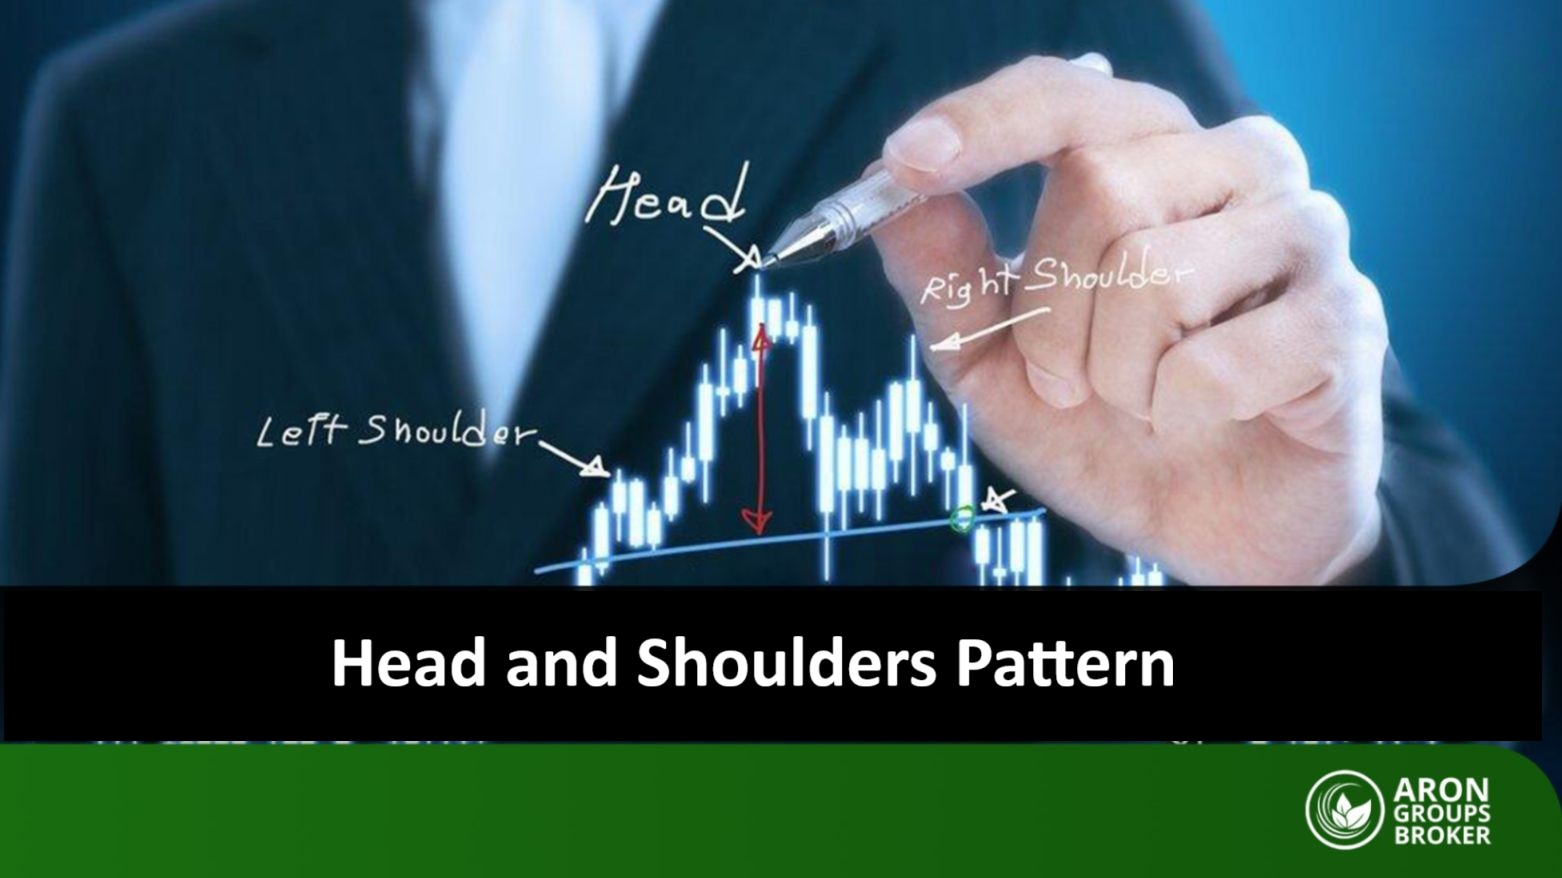
Head and Shoulders Pattern: The Golden Key to Identifying the End of a Trend
28 October 2025
,
Abe Cofnas
The head and shoulders pattern, when correctly identified, can provide traders with highly accurate entry or exit points. This pattern reflects a weakness in the current trend and signals that the market may be ready for a reversal. If you’re looking to gain a deeper understanding of price behavior, learn the precise structure of this […]
- Read more
-
Candlestick Analysis and Trading with Candlestick Patterns: Types of Bullish and Bearish Candlestick Patterns and How to Identify Them
28 October 2025
,
Abe Cofnas
Candlestick patterns are one of the most important tools for analyzing market movements. This article of aron groups explores trading strategies based on candlestick patterns and examines how to use them to optimize trading decisions. Key Points: Candlestick patterns are powerful yet simple tools that help traders identify potential market reversals and trend continuations. Combining […]
- Read more
-
The U.S. Non-Farm Payrolls (NFP) Report – How It’s Calculated, Its Impact on Financial Markets, and Key Trading Strategies
28 October 2025
,
Abe Cofnas
In financial markets that are constantly influenced by economic and political forces, economic reports play a crucial role in shaping investors’ decisions. Among the most important of these reports is the U.S. Non-Farm Payrolls (NFP) report, published monthly by the U.S. Bureau of Labor Statistics (BLS). This report serves as a key indicator for assessing […]
- Read more
-
What Is an Indicator? A Simple Guide to Understanding Indicators
28 October 2025
,
Abe Cofnas
An indicator is one of the most important pillars of technical analysis that helps traders better identify hidden trends and key points in the market. Without using proper indicators, decision-making in trading becomes closer to guesswork, and the risk of loss increases significantly. In this article, you will comprehensively get acquainted with the concept of […]
- Read more
-
How to Identify Market Trend Reversals with Price Action? A Comprehensive Guide for Traders
27 October 2025
,
Abe Cofnas
Trend Reversal in Price Action Trading is one of the key skills for any trader. Financial markets are constantly moving, and at any moment, the trend of an asset can change. If you can identify these changes in time, you can take advantage of opportunities to enter the market. In this article, we will show […]
- Read more
-
A Comprehensive Guide to Using Line Break Charts in Technical Analysis
27 October 2025
,
Abe Cofnas
Have you ever searched for a way to get clear buy and sell signals without the usual complexity of candlestick charts? The Line Break Chart is a lesser-known yet highly effective tool in technical analysis designed for precisely this purpose. By disregarding the time variable and focusing solely on price action, this chart helps traders […]
- Read more
-
Everything about Base Candle in Price Action
26 October 2025
,
Abe Cofnas
In price action analysis, there are times when candlesticks enter a phase of stagnation, indicating a temporary pause in market momentum. During such periods, the Base Candle plays a crucial role, as it reflects a state of balance between buyers and sellers and often signals the potential beginning of a new move. Understanding what a […]
- Read more
Load more