 EN
EN


Technical
-
How to Identify Market Trend Reversals with Price Action? A Comprehensive Guide for Traders
 27 October 2025
,
Abe Cofnas
27 October 2025
,
Abe Cofnas
Trend Reversal in Price Action Trading is one of the key skills for any trader. Financial markets are constantly moving, and at any moment, the trend of an asset can change. If you can identify these changes in time, you can take advantage of opportunities to enter the market. In this article, we will show […]
- Read more
-
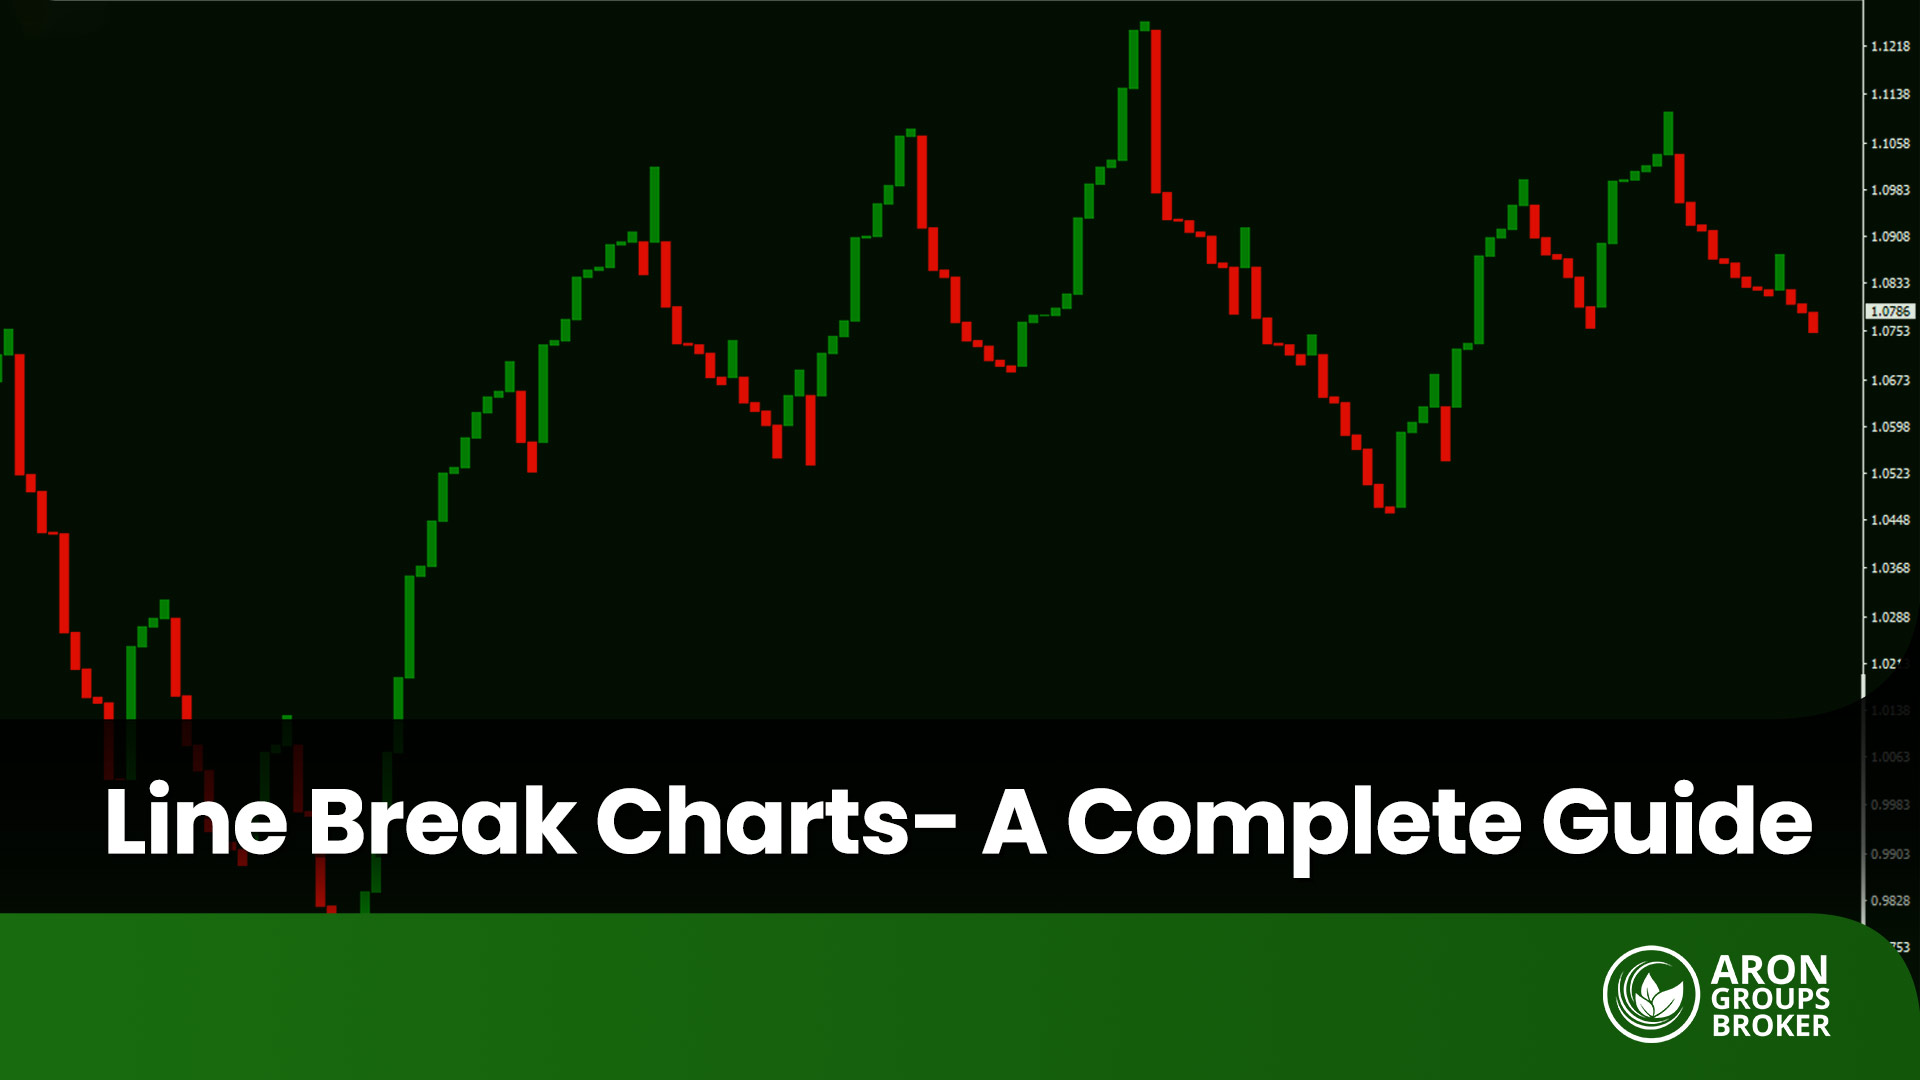
A Comprehensive Guide to Using Line Break Charts in Technical Analysis
27 October 2025
,
Abe Cofnas
Have you ever searched for a way to get clear buy and sell signals without the usual complexity of candlestick charts? The Line Break Chart is a lesser-known yet highly effective tool in technical analysis designed for precisely this purpose. By disregarding the time variable and focusing solely on price action, this chart helps traders […]
- Read more
-
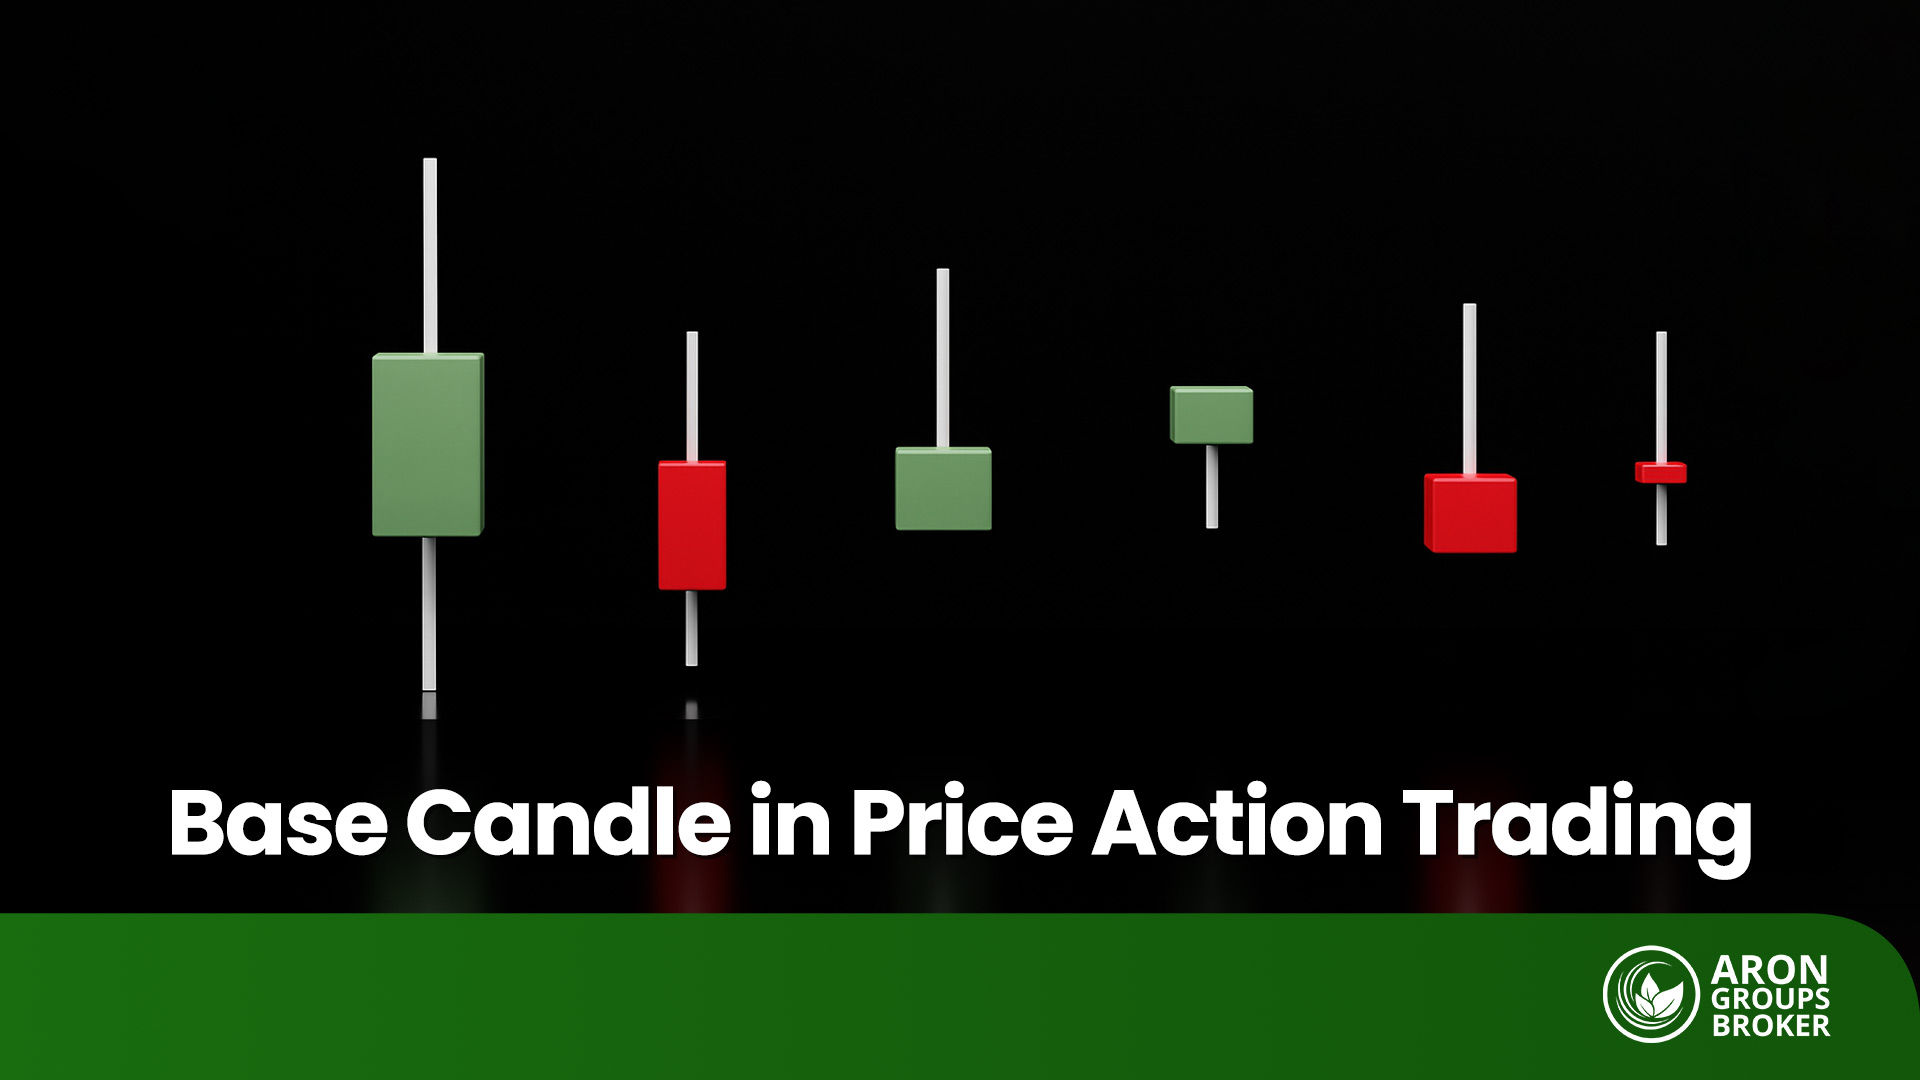
Everything about Base Candle in Price Action
26 October 2025
,
Abe Cofnas
In price action analysis, there are times when candlesticks enter a phase of stagnation, indicating a temporary pause in market momentum. During such periods, the Base Candle plays a crucial role, as it reflects a state of balance between buyers and sellers and often signals the potential beginning of a new move. Understanding what a […]
- Read more
-
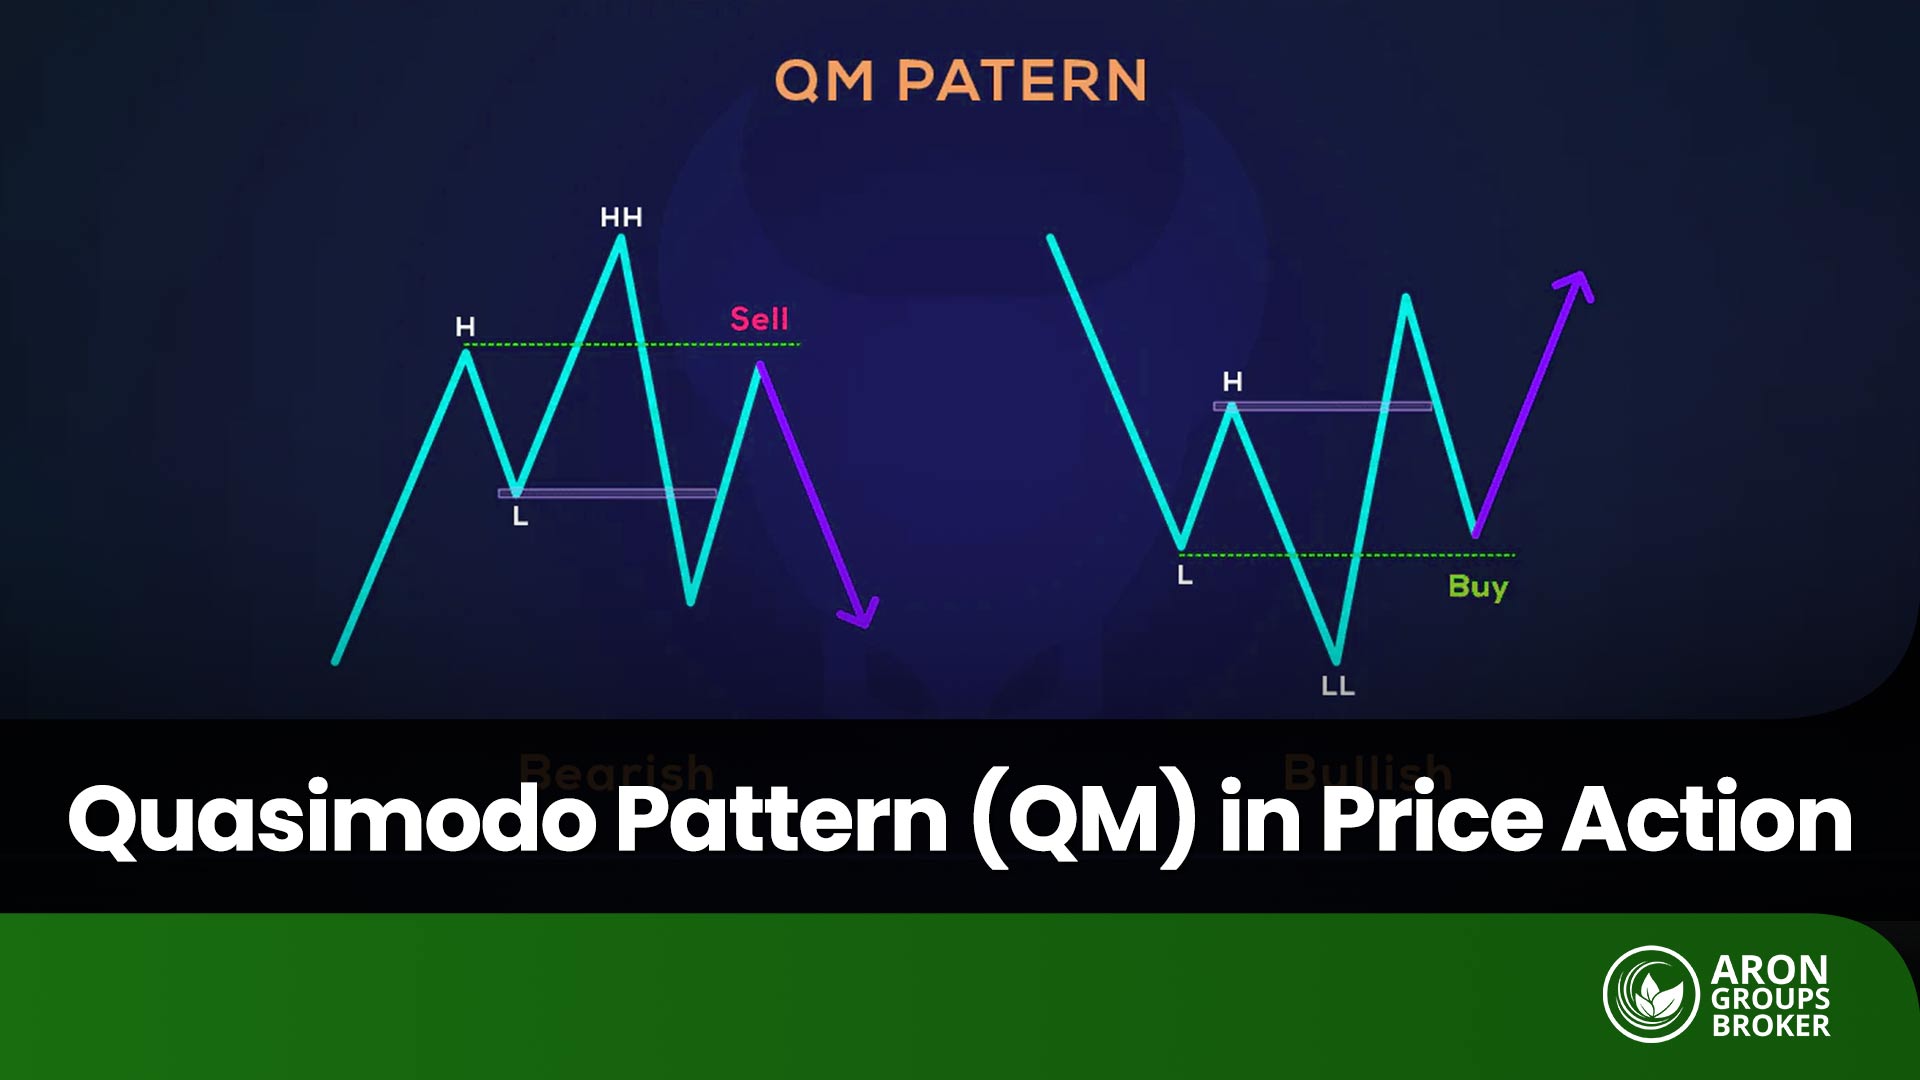
Mastering the Quasimodo (QM) Pattern in Price Action Trading
26 October 2025
,
Abe Cofnas
In technical analysis, traders seek patterns that can accurately predict market reversal points. Among the most powerful of these formations is the Quasimodo (QM) pattern. This pattern, grounded in the logic of price movements and market structure, enables traders to identify the end of an existing trend and the beginning of a new one. Unlike […]
- Read more
-
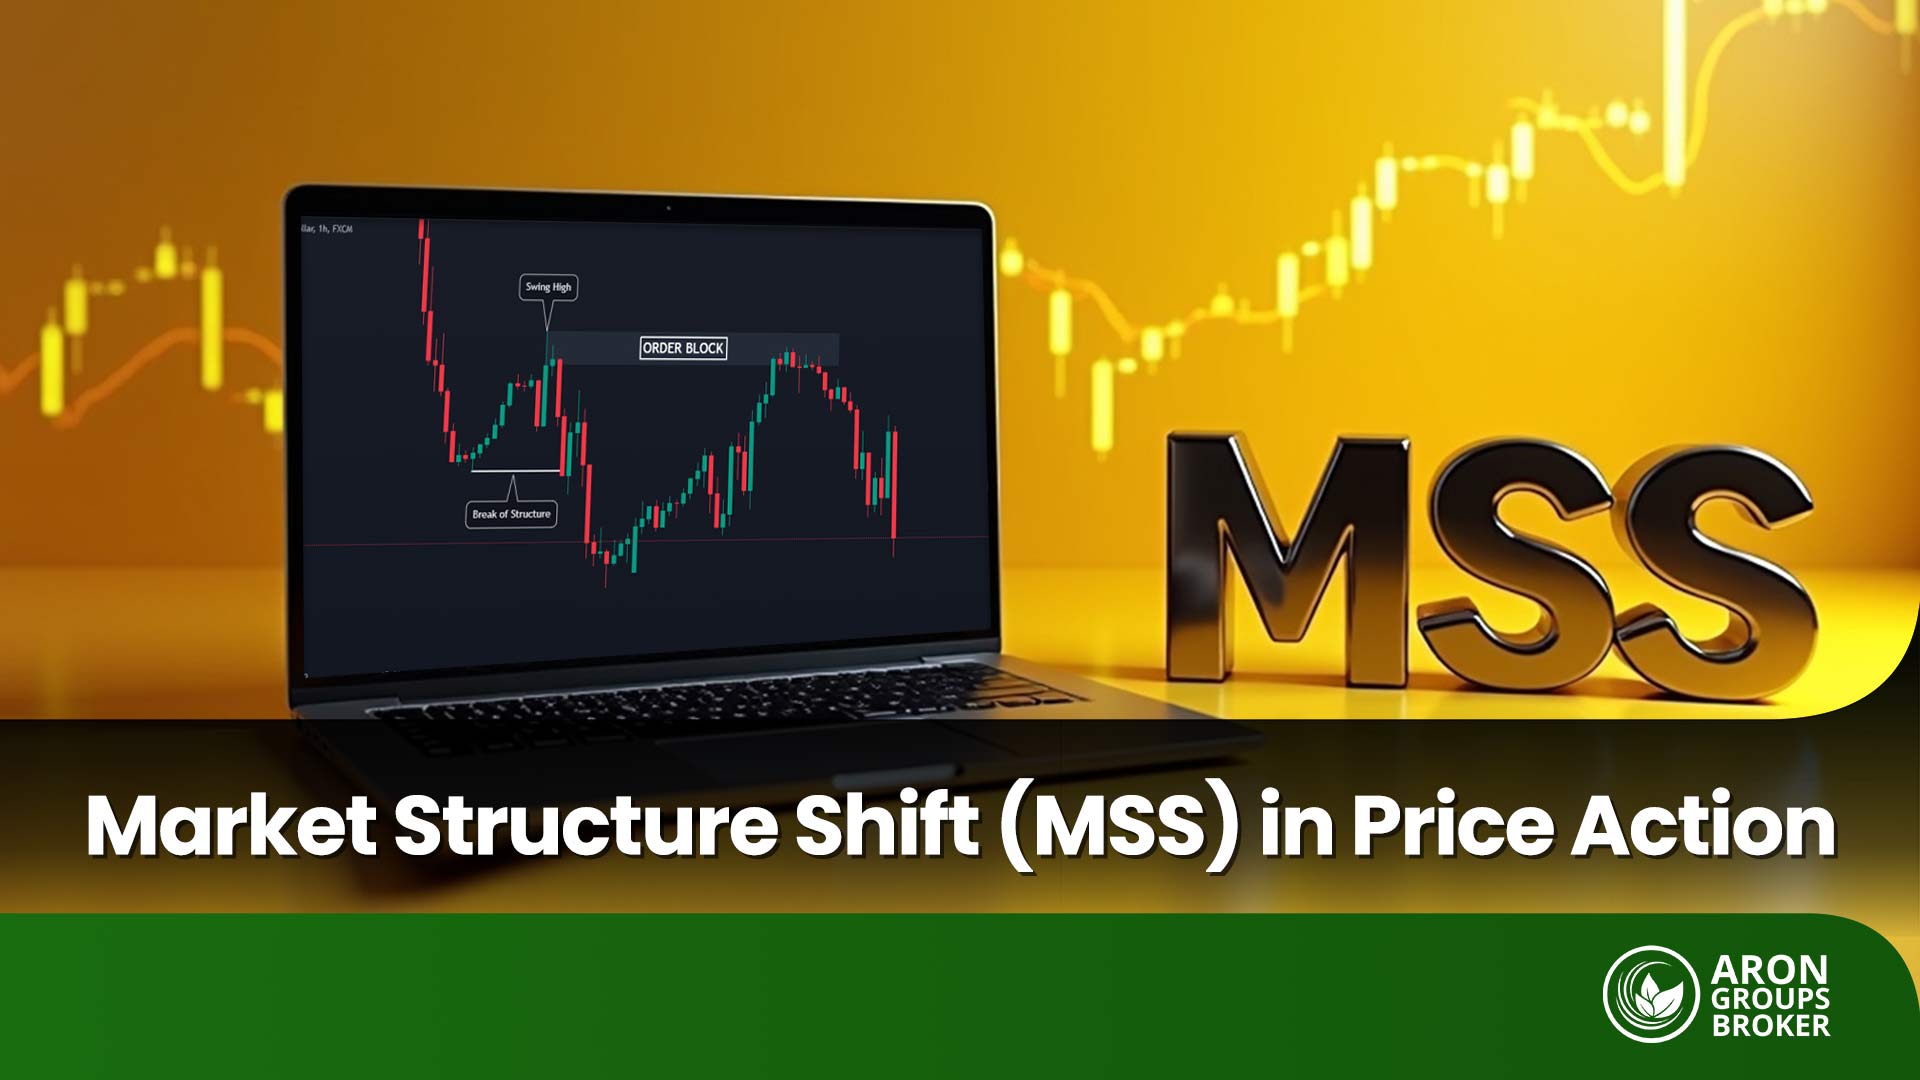
Complete Guide to Market Structure Shift (MSS) and Its Impact on Market Trends
26 October 2025
,
Abe Cofnas
Market Structure Shift (MSS) is one of the key tools in technical analysis, enabling traders to identify structural changes in market trends and make more precise trading decisions.In this article, we provide a comprehensive exploration of MSS, including its types, identification methods, and practical applications for determining optimal entry and exit points. You will discover […]
- Read more

-
Comprehensive Guide to DFSA Regulation: Everything About Dubai’s Financial Regulatory Authority
25 October 2025
,
Abe Cofnas
If you’re searching for a safe broker in the Middle East, you’ll often come across the name DFSA. This independent regulator of the DIFC (Dubai International Financial Centre) enforces strict rules and transparent oversight to safeguard the credibility of Dubai’s financial market. In this guide, you’ll learn what DFSA is, its key responsibilities, and how […]
- Read more
-
How to Manage Risk and Capital in Gold Trading? A Specialized and Practical Guide
25 October 2025
,
Abe Cofnas
The gold market is one of the most exciting and, at the same time, safest financial markets. However, entering it without a clear capital management plan can quickly wipe out your account. Extreme volatility, rapid reactions to news, and high sensitivity to indicators such as interest rates and the U.S. dollar have made it clear […]
- Read more

-
How Confirmation Bias Tricks Your Mind and Sabotages Your Trading Decisions
23 October 2025
,
Abe Cofnas
Many traders, when looking back at their past trades, realize that they mostly paid attention to news and analysis that supported their own personal views. This is where Confirmation Bias in Trading comes into play. In simple terms, it is a mental tendency that makes a person focus only on evidence that strengthens their beliefs […]
- Read more
-
How Do Leveraged Funds Work and Why Have They Become Popular Among Investors?
23 October 2025
,
Abe Cofnas
If you are seeking multiplied returns on your investments and want to benefit from the power of leverage without directly engaging in high-risk trades, leveraged investment funds can be an attractive option. A leveraged fund (also known as a leveraged ETF in many markets) is a financial instrument that magnifies both profits and losses in […]
- Read more
-
Overconfidence: The Silent Enemy of Traders and How to Control It
23 October 2025
,
Abe Cofnas
How many times has it happened that after a few successful trades, you suddenly felt invincible—like nothing could stop you? That’s exactly where overconfidence in trading sneaks in; a hidden enemy that lures many traders, right after a series of sweet profits, into risky decisions and costly mistakes. If you want to learn how to […]
- Read more
Load more