 EN
EN


Technical
-
Resting Liquidity Explained: How Pending Orders Move Price
 18 February 2026
,
Abe Cofnas
18 February 2026
,
Abe Cofnas
Many retail traders struggle to understand why the price often hits their stop-loss before moving in the direction they predicted. This is rarely an accident; it results from Resting Liquidity interacting with institutional order flow. In modern markets, price seeks out areas of high transaction volume to satisfy the needs of large-scale participants. Understanding where […]
- Read more
-
ICT Time and Price Theory: Mastering Market Cycles and Smart Timing
17 February 2026
,
Abe Cofnas
ICT Time and Price Theory is a way to understand why prices often move at certain times, not by chance. Instead of staring at charts all day, you learn to watch key market hours when activity tends to rise, especially during major trading sessions. This approach helps beginners focus on clearer moments, avoid random noise, […]
- Read more

-
ICT Power of 3: Understanding Smart Money Market Phases
16 February 2026
,
Abe Cofnas
Financial markets rarely move at random. Behind every sharp rally or sudden stop hunt, there is usually a structured sequence driven by liquidity and institutional positioning. This is where the ICT Power of 3 concept becomes powerful. The ict power of 3 (or ict po3) is a cornerstone of Smart Money concepts. It explains the […]
- Read more
-
ICT PD Arrays: Concepts Every Trader Should Know
15 February 2026
,
Abe Cofnas
Mastering institutional price delivery requires a deep understanding of ICT PD Arrays, the primary framework for mapping how smart money moves through the market. Rather than using static retail levels, these arrays identify dynamic zones where professional orders are gathered and delivered with high precision. This guide breaks down the classification of ICT PD Arrays […]
- Read more

-
Volatility Prediction in Trading: Models, Indicators, and Machine Learning
12 February 2026
,
Abe Cofnas
Volatility Prediction tells you how “wild” the market may get next. It does not try to guess up or down. It estimates the potential magnitude of the moves. This matters in Forex, gold, and crypto, where prices can jump fast.Volatility prediction helps you make smarter choices, set realistic stop losses, size positions safely, and pick […]
- Read more
-
How to Trade with Keltner Bands in MT5: Signals, Setups, and Risk Tips
8 February 2026
,
Abe Cofnas
Keltner Bands are often misunderstood as simple entry signals, but they are better used as a decision framework. This guide focuses on how to think with the channel, identify conditions, select the right tactic, and manage risk realistically in MT5. The goal is not prediction, but consistency across changing market behaviour. Key Points: Treat Keltner […]
- Read more
-
Can You Swing Trade Futures Safely? A Practical Guide for Traders
5 February 2026
,
Abe Cofnas
Swing trading futures can be a lucrative strategy for many traders, but it’s not without its unique challenges. While some market participants thrive on long-term positions, others may wonder, “Can you swing trade futures?” The answer is yes, but there are specific considerations and risks to understand before diving in. In this post, we’ll break […]
- Read more
-
Inducement in Trading: Meaning, Examples, and Smart Money Concepts Context
4 February 2026
,
Abe Cofnas
Many traders lose not because their analysis is weak, but because their timing becomes predictable to other participants. Markets tend to reward liquidity over opinions, so predictable behaviour can create avoidable costs and poorer entries. If you want cleaner entries and fewer traps, keep reading to learn inducement in trading and how to filter them. […]
- Read more
-
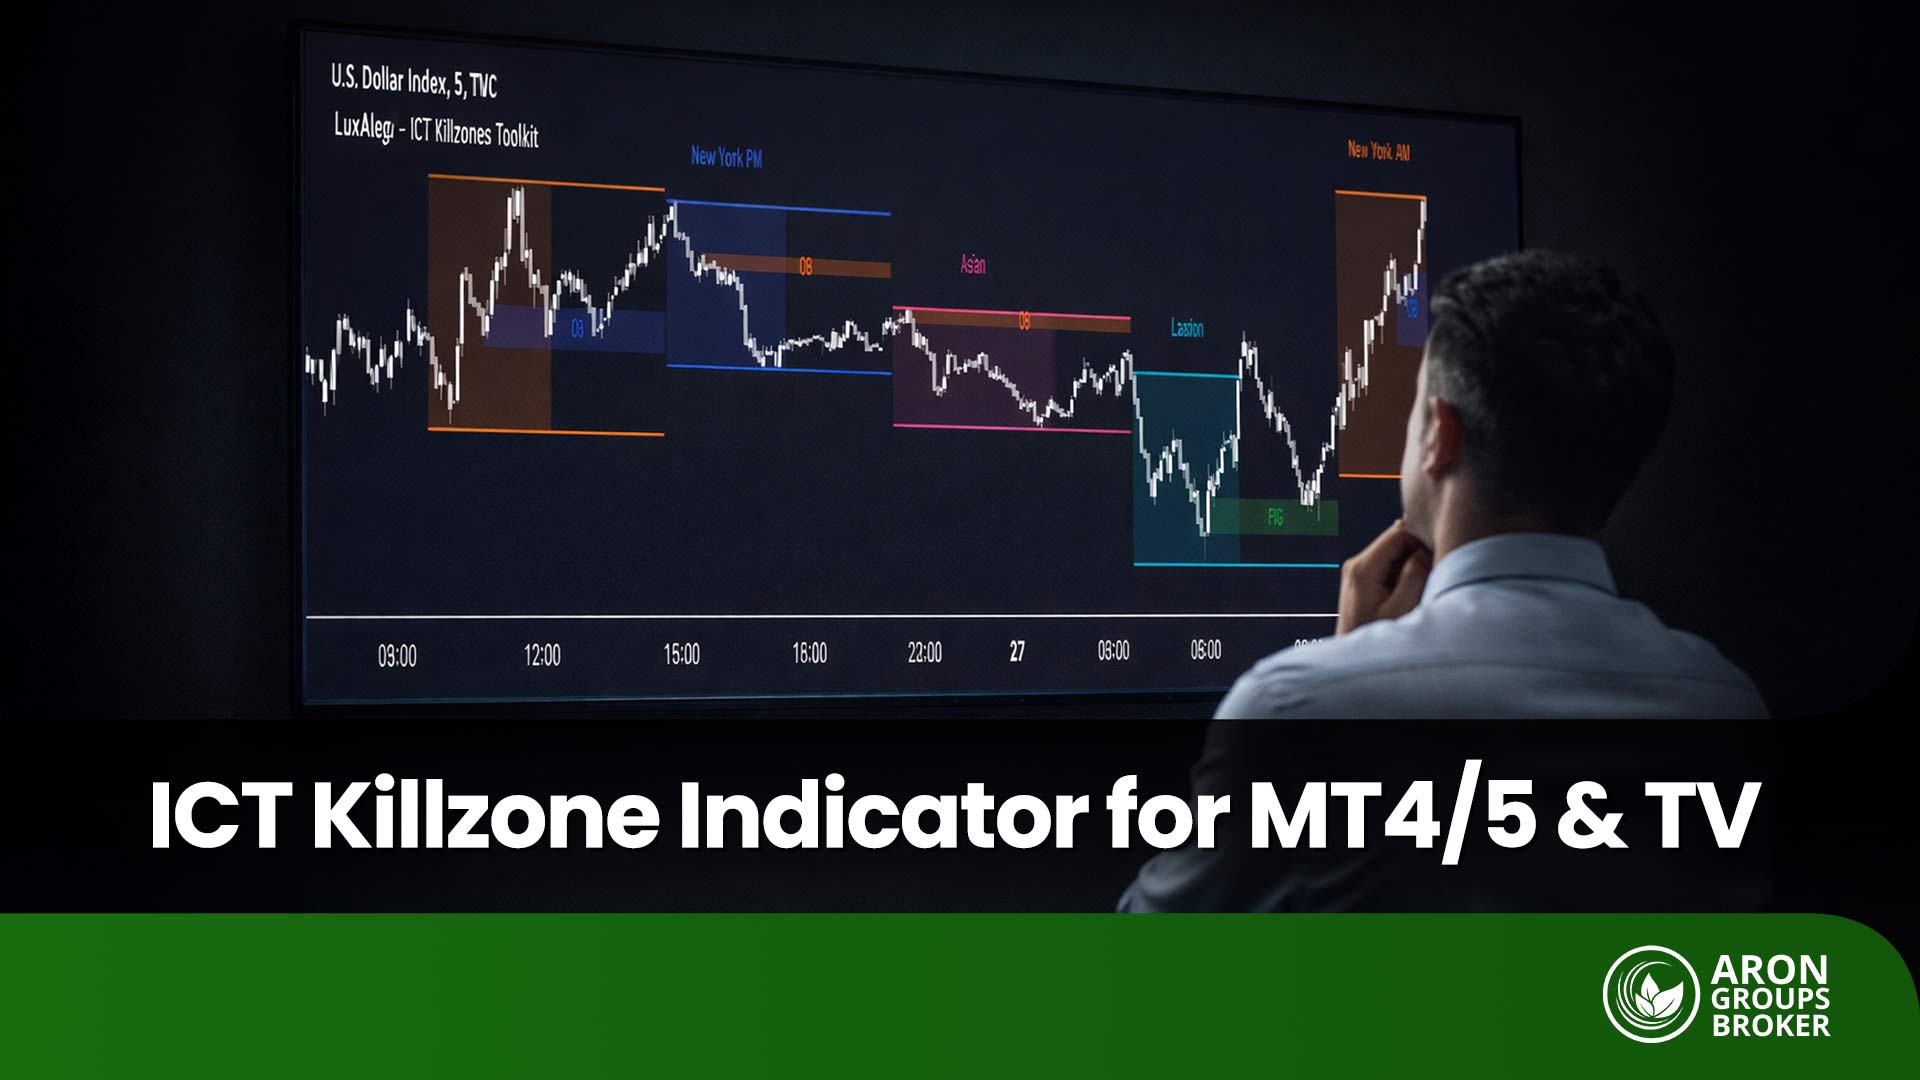
Understanding the ICT Killzone Indicator and Its Role in High-Liquidity Trading Hours
31 January 2026
,
Abe Cofnas
The ICT Killzone Indicator is widely used to highlight periods of elevated market participation, yet many traders misapply it due to inconsistent session timing across platforms and brokers. This guide explains how to align Asian, London, and New York kill zones correctly on MT4, MT5, and TradingView using reliable time references. It also outlines a […]
- Read more
-
How to Trade SPY Options for Consistent Daily Income
29 January 2026
,
Abe Cofnas
The S&P 500 ETF (SPY) is the most liquid trading instrument in the world. Traders often use SPY options to capture daily moves with small capital outlays. However, without a formal process, these fast-moving contracts can quickly deplete a retail account. Effective trading requires more than just a directional bias or a gut feeling. You […]
- Read more
Load more