 EN
EN


Technical
-
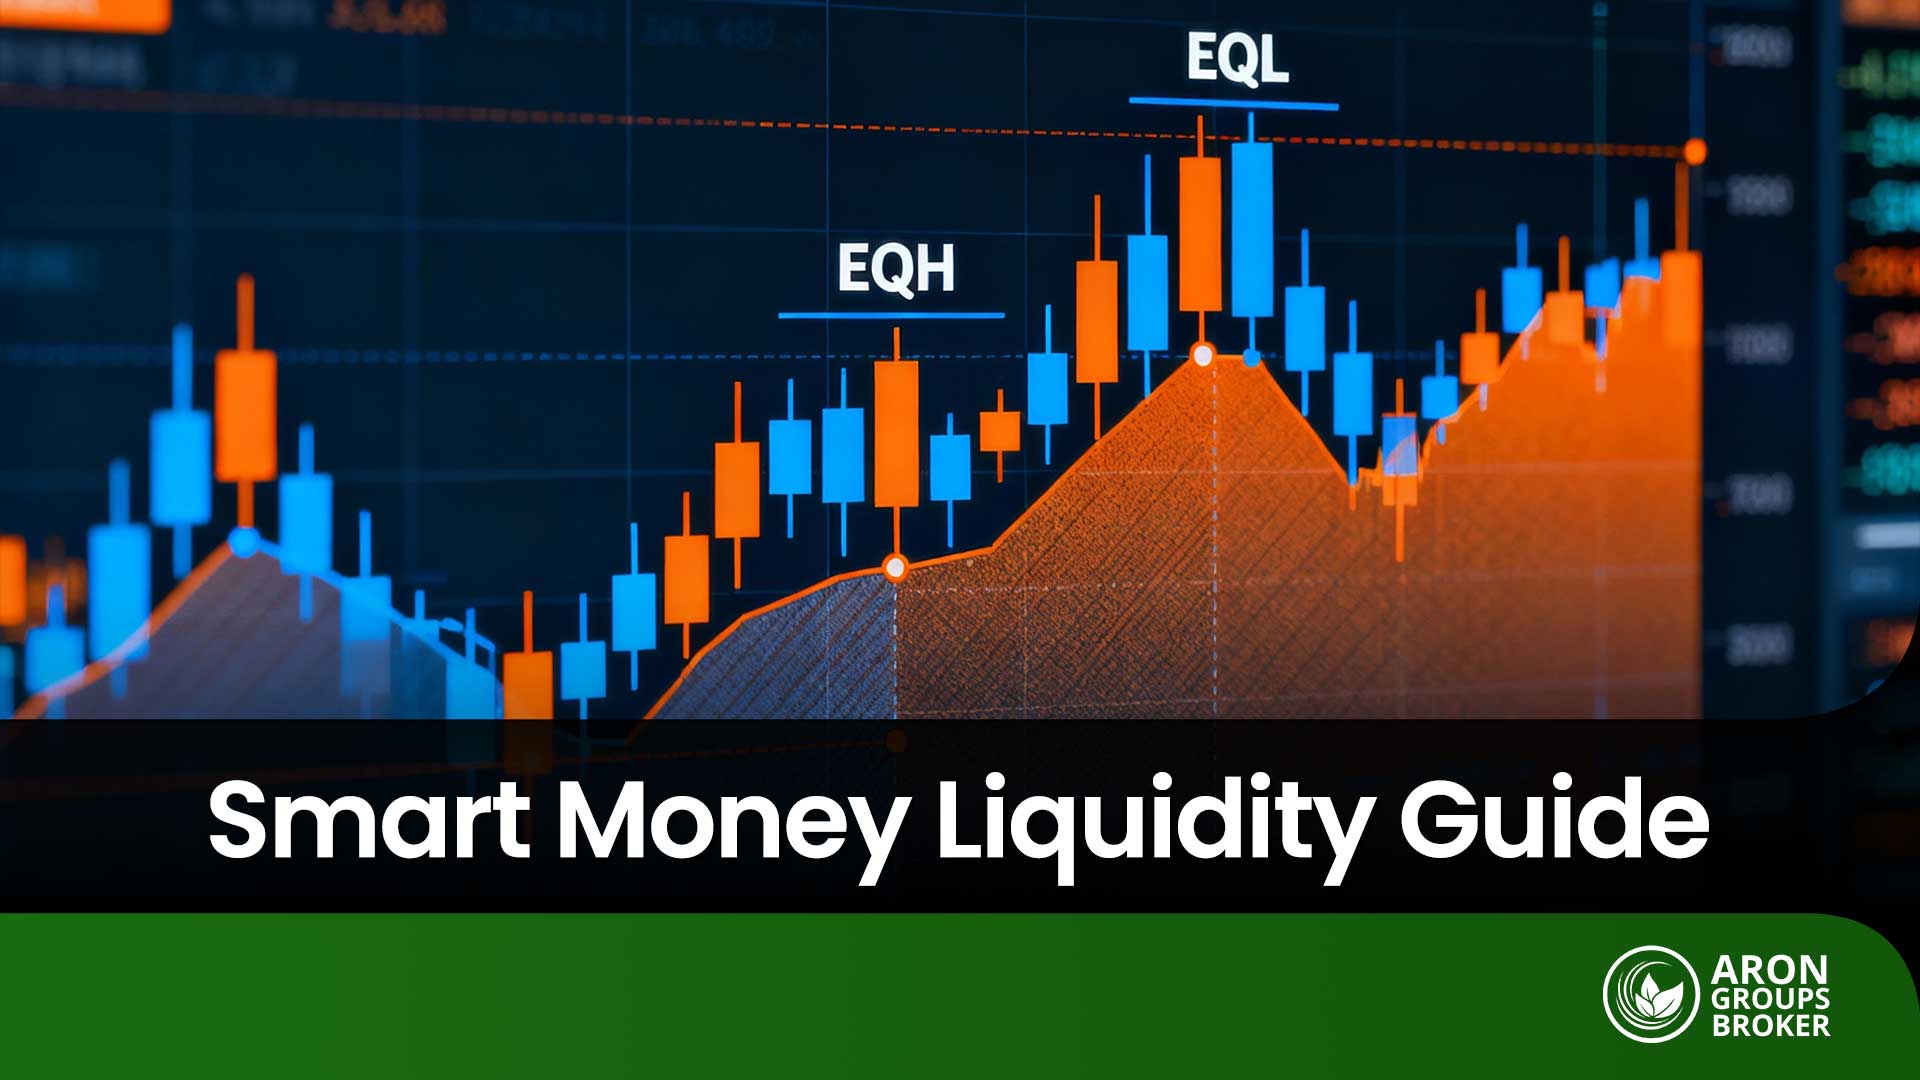
Complete guide to Equal Highs (EQH) and Equal Lows (EQL) in Smart Money
 30 December 2025
,
Abe Cofnas
30 December 2025
,
Abe Cofnas
When you read a price chart, the numbers are only the surface; the real story is where traders’ orders cluster. In Smart Money Concept (SMC), that cluster is liquidity, and it often drives the market’s quick spikes and reversals. Two key patterns here are Equal Highs (EQH) and Equal Lows (EQL), which reveal common stop-loss […]
- Read more
-
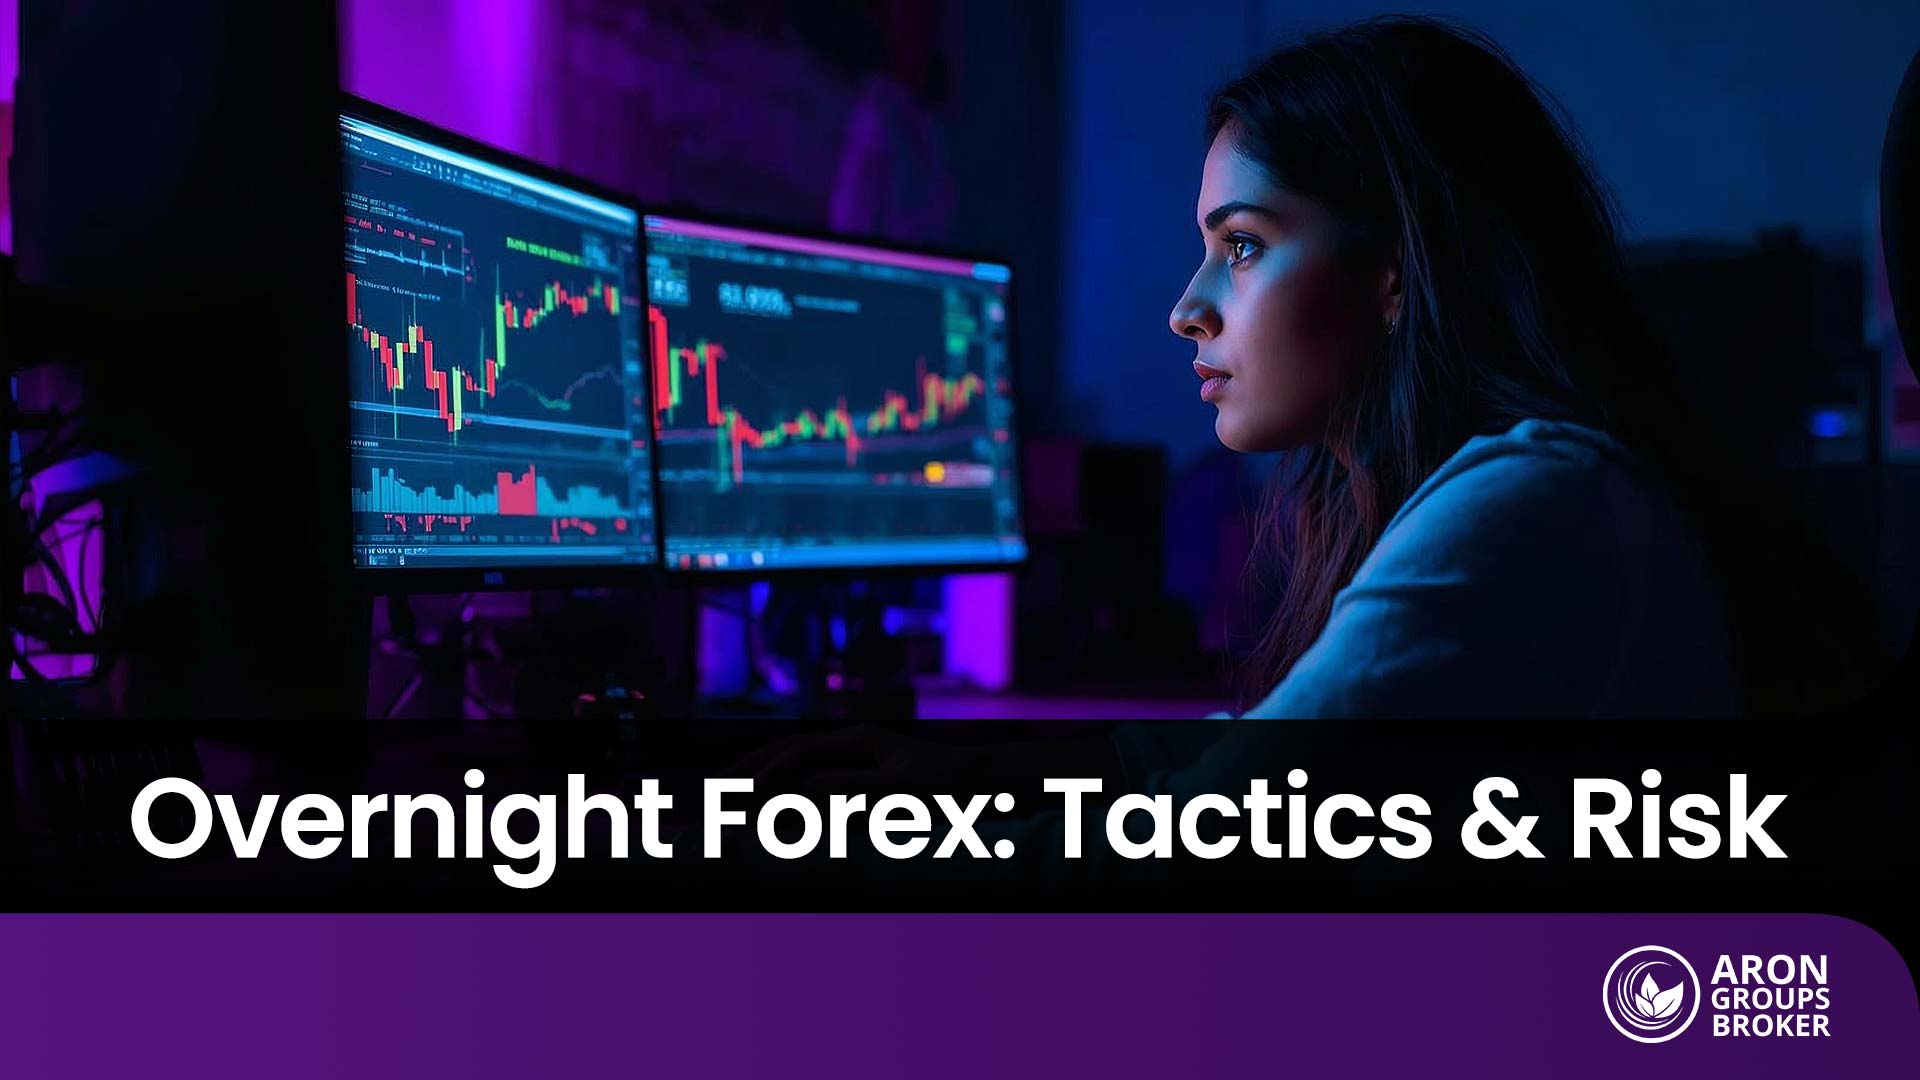
Complete Guide to Overnight Forex Trading
30 December 2025
,
Abe Cofnas
The forex market runs 24 hours a day, which gives traders a unique window for flexible participation. One of the most interesting parts is overnight forex trading, usually near the New York close and early Asia open. Many traders choose these hours because volatility often cools down, or fresh moves appear at the next day’s […]
- Read more
-
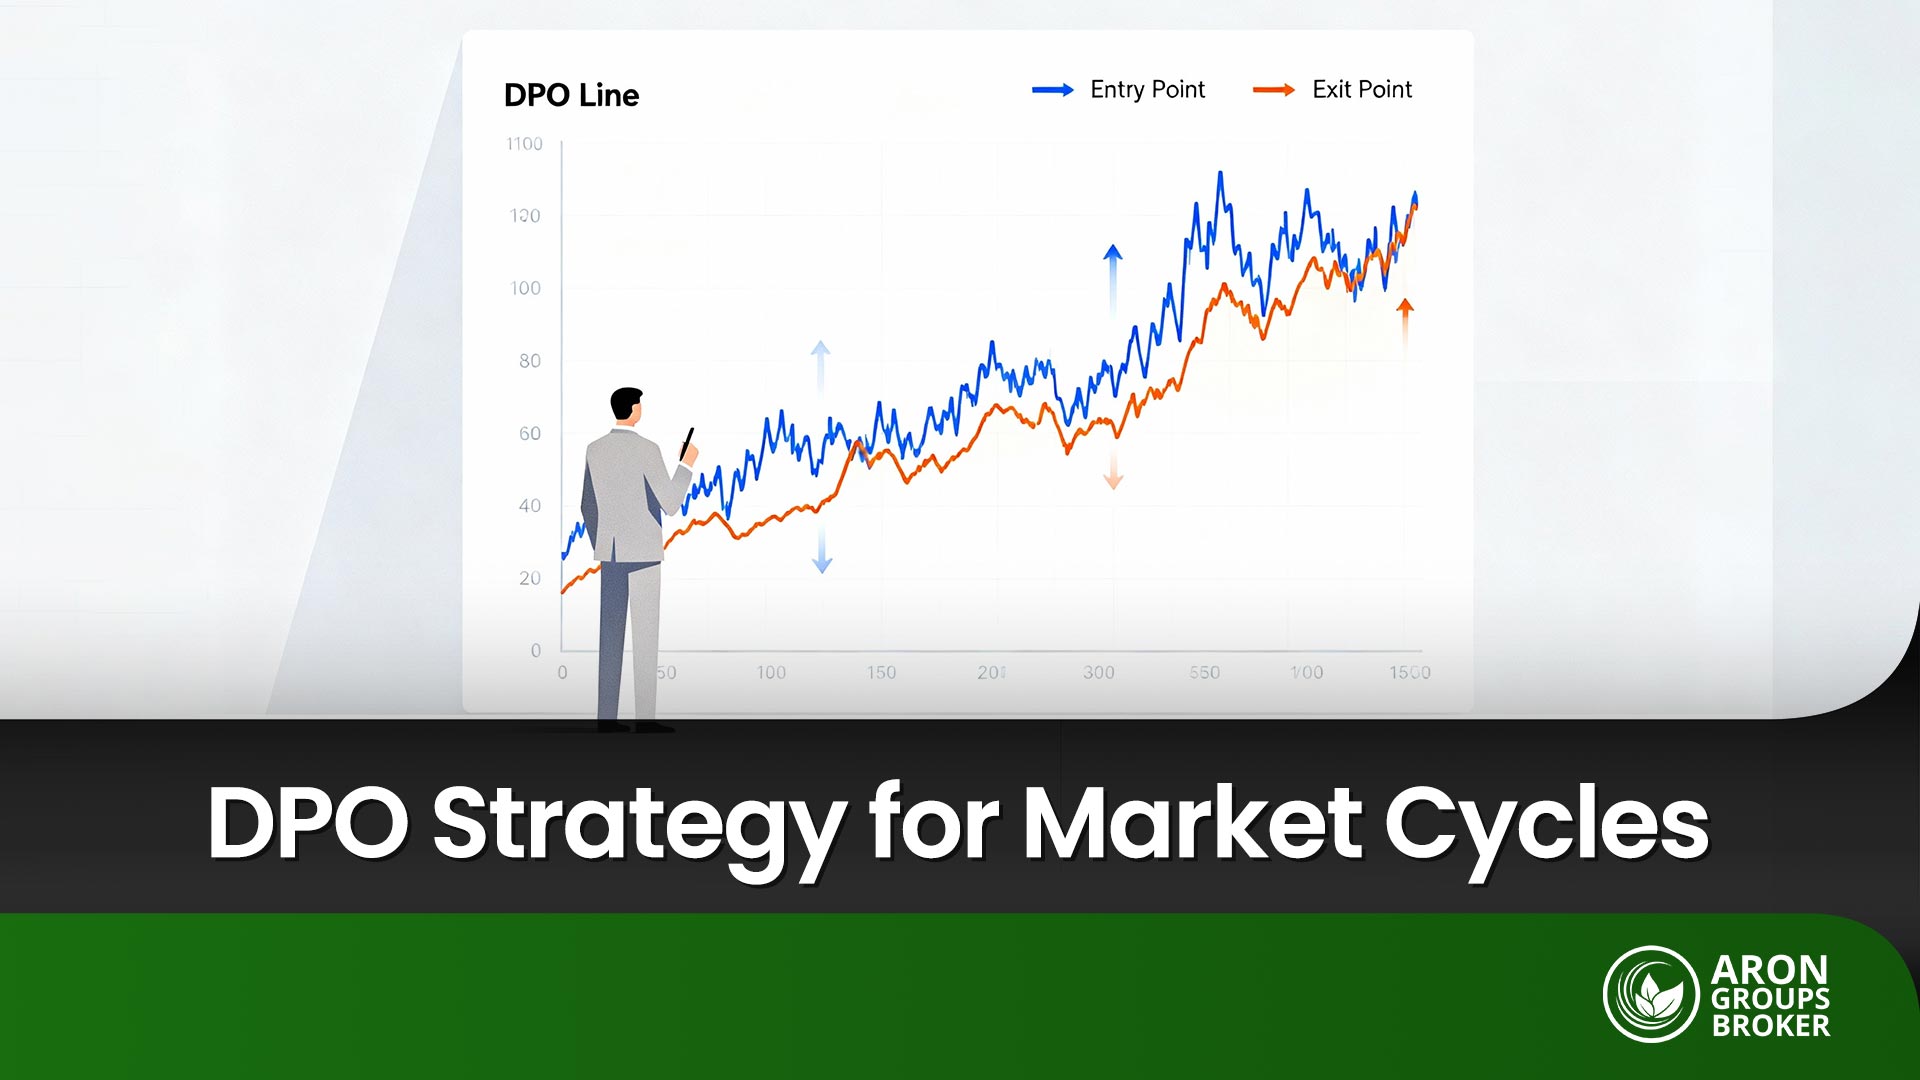
A complete guide to the DPO indicator and how it helps spot short-term swings
30 December 2025
,
Abe Cofnas
For many traders, short-term market swings create opportunities for quick profits, but spotting them requires tools that filter long-term trends. One specialised tool is the DPO, or Detrended Price Oscillator (DPO). It is designed to remove the broader trend effect, helping you identify swing highs and swing lows more accurately. Key Points: The DPO indicator […]
- Read more
-
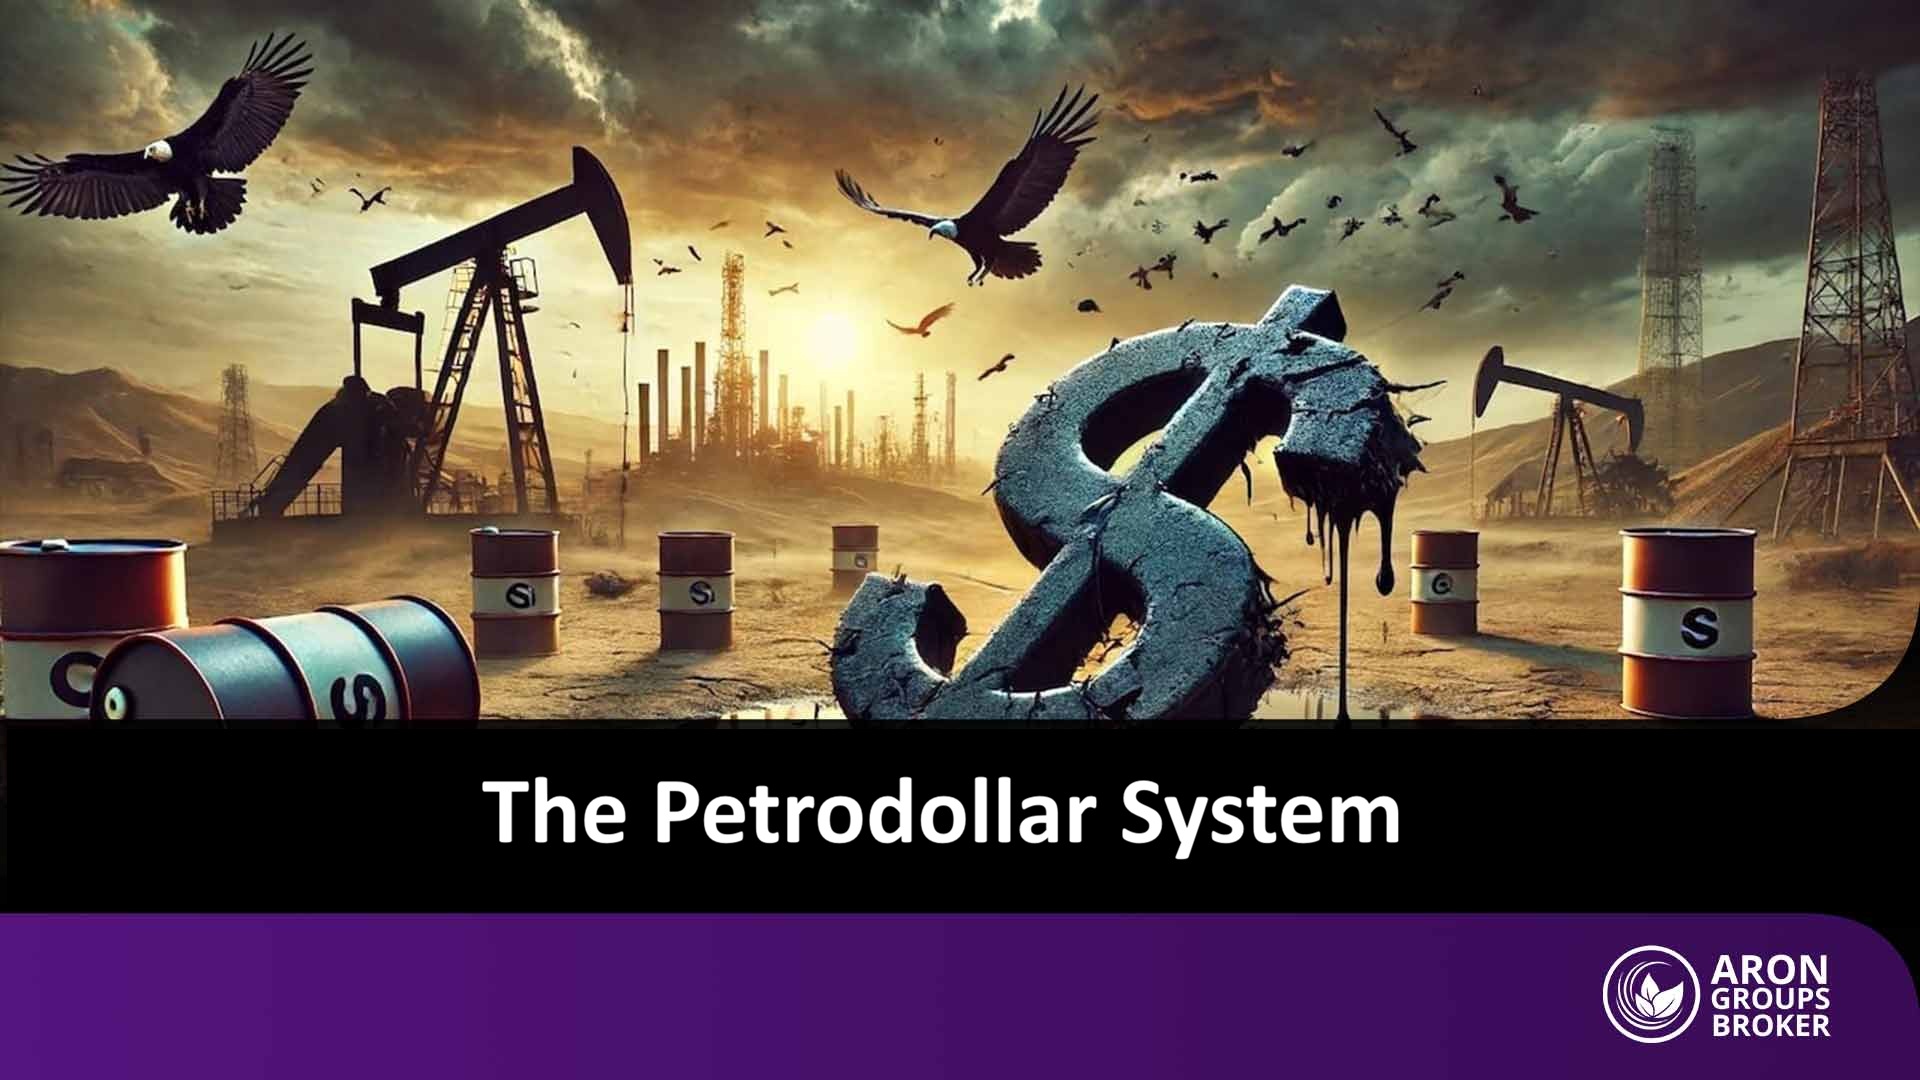
How the U.S. Dollar Became Tied to Oil: Behind the Scenes of the Petrodollar System
26 December 2025
,
Abe Cofnas
When discussing the relationship between the dollar and oil, the petrodollar system is a key concept. This explains how the U.S. dollar became the primary currency in oil transactions, influencing the global economy. Understanding what the petrodollar is and its role in global economic and energy policies helps us grasp the dollar’s dominance. If you […]
- Read more

-
Complete Guide to the KST Indicator: How to Use It in Technical Analysis
26 December 2025
,
Abe Cofnas
Many indicators are either too reactive or give delayed signals, but the KST indicator combines multiple rate of change (ROC) averages. This method aims to provide a balanced and reliable view of the overall trend. The indicator shows both the strength and direction of price movement. Its multi-layered structure also produces accurate entry and exit […]
- Read more
-
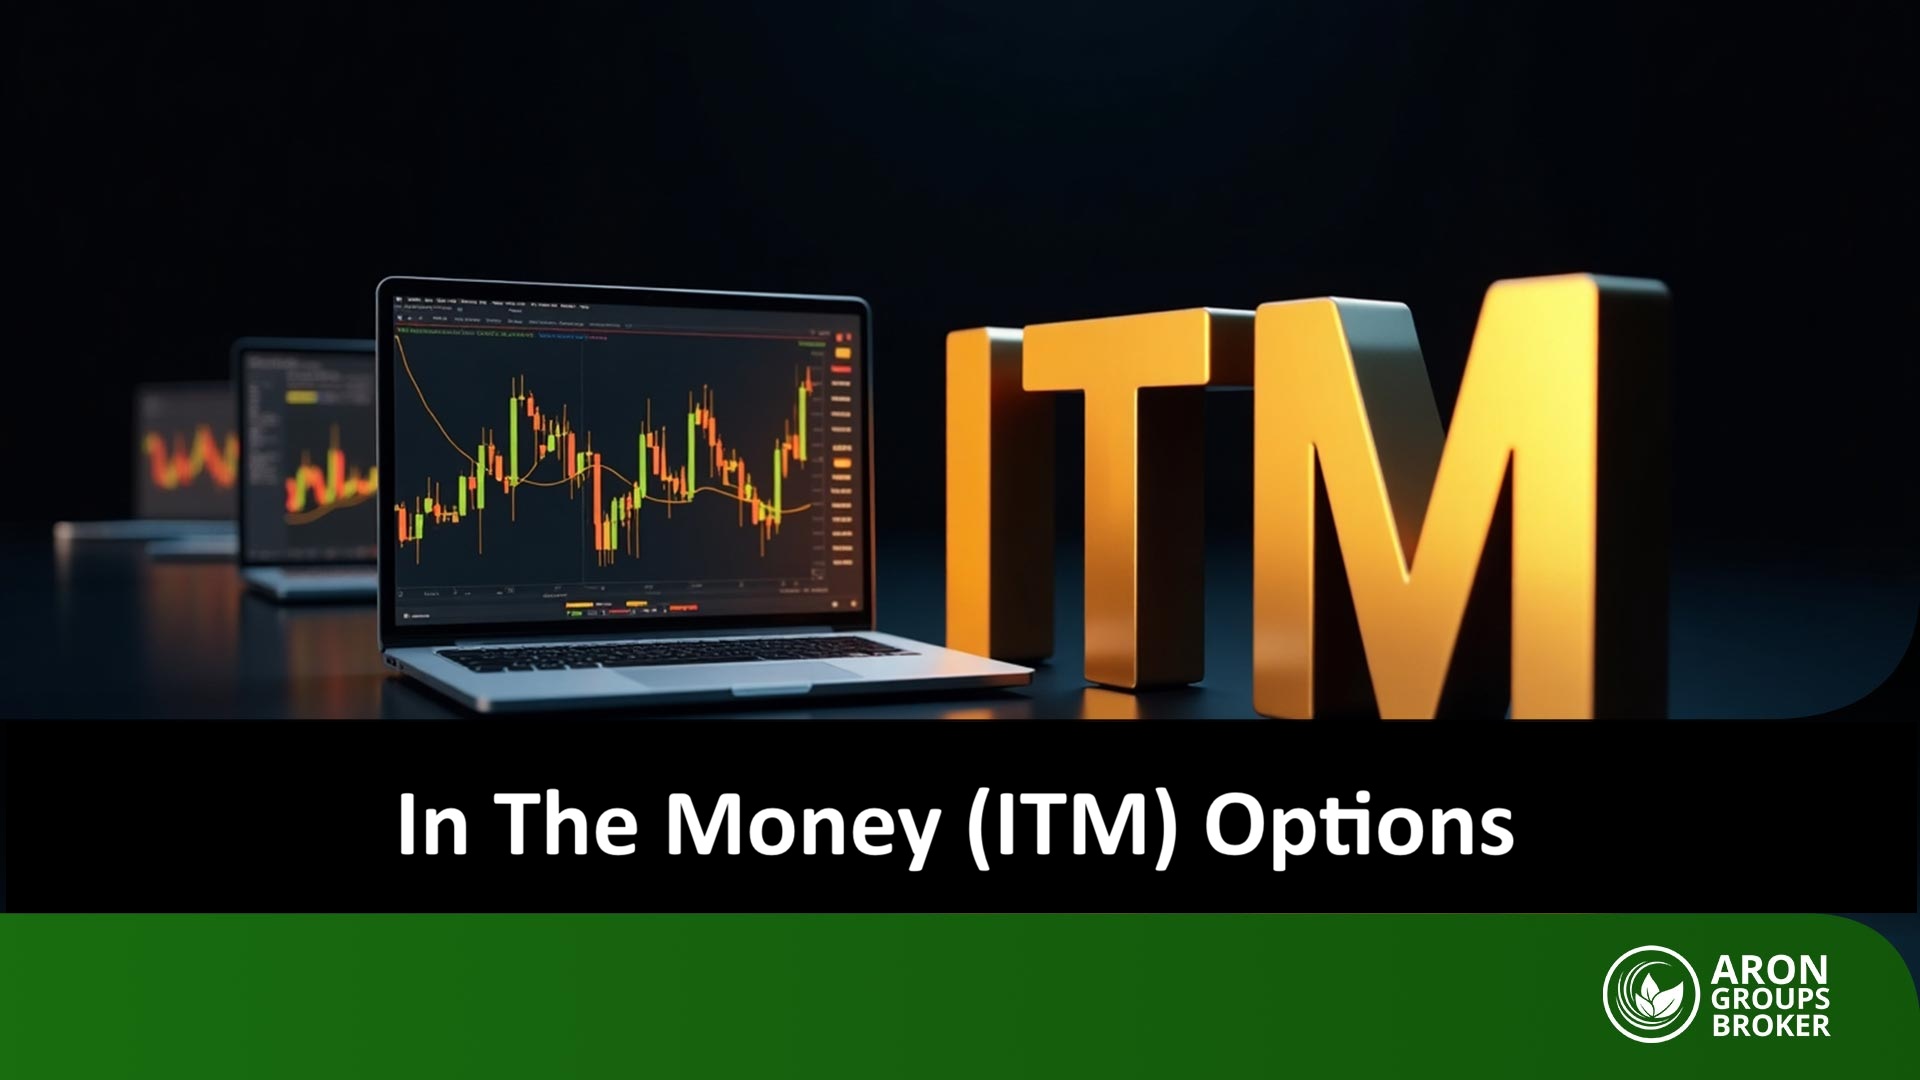
Complete Guide to Trading Options in In-The-Money (ITM) Conditions
25 December 2025
,
Abe Cofnas
In financial trading, understanding the tools that simplify decision-making is crucial. The ITM (In The Money) status in options trading is one such tool. It shows positions with intrinsic value, drawing attention from many technical analysts. Knowing ITM helps traders understand when to enter or exit the market. It also helps in managing trade risks […]
- Read more

-
Everything You Need to Know About the S&P GSCI Index and Its Role in Commodity Market Analysis
25 December 2025
,
Abe Cofnas
Have you ever wondered how oil, gold, or wheat prices affect your investments? In commodity markets, an accurate benchmark is essential. The S&P GSCI Index, which covers commodities such as energy, metals, agricultural products, and livestock, serves as this benchmark. Using real data and weighting based on each commodity’s production share, the index offers a […]
- Read more
-
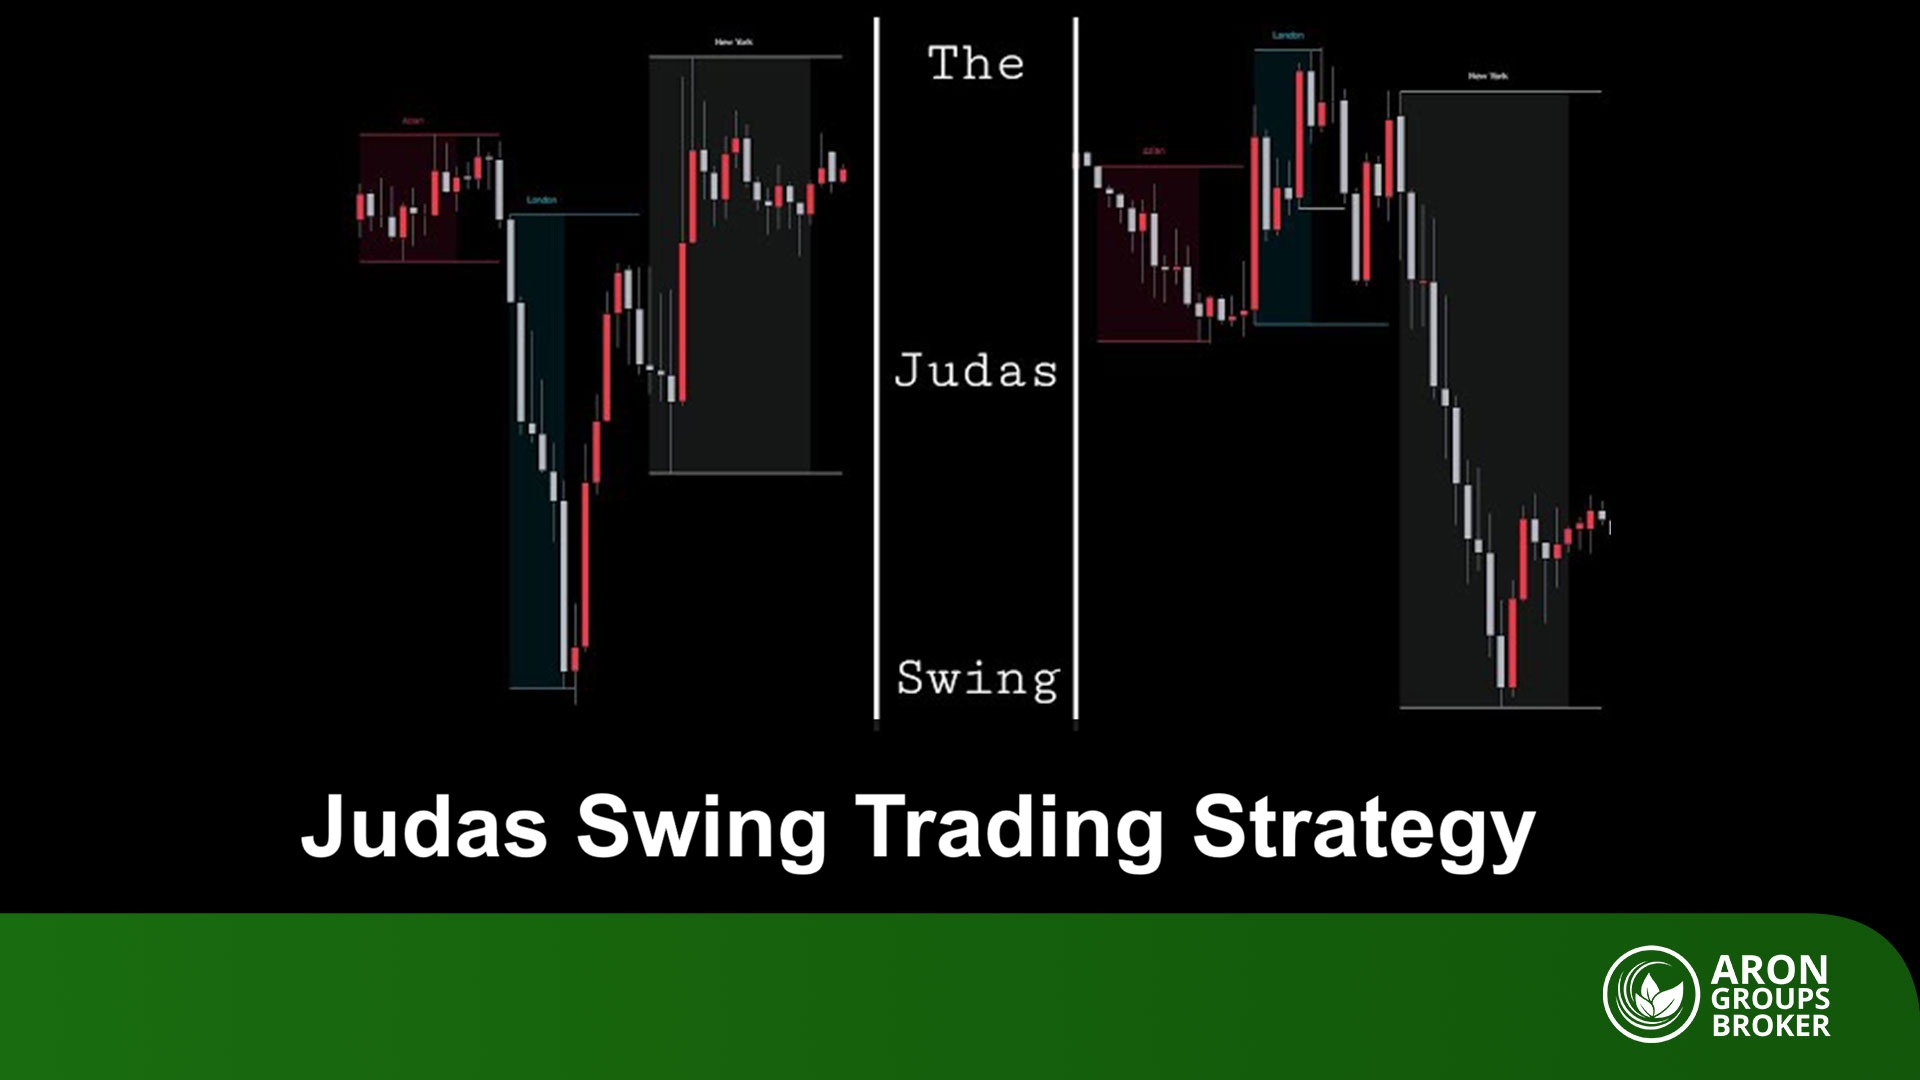
How the Judas Swing Strategy Works and How Traders Make Money from It
24 December 2025
,
Abe Cofnas
In the world of forex trading, professional traders are constantly looking for strategies to profit from complex and deceptive market movements. One of these powerful strategies is the Judas Swing, also known as the “betrayer swing” for its misleading nature. In this article, we will comprehensively explore the Judas Swing strategy, how to identify it, […]
- Read more
-
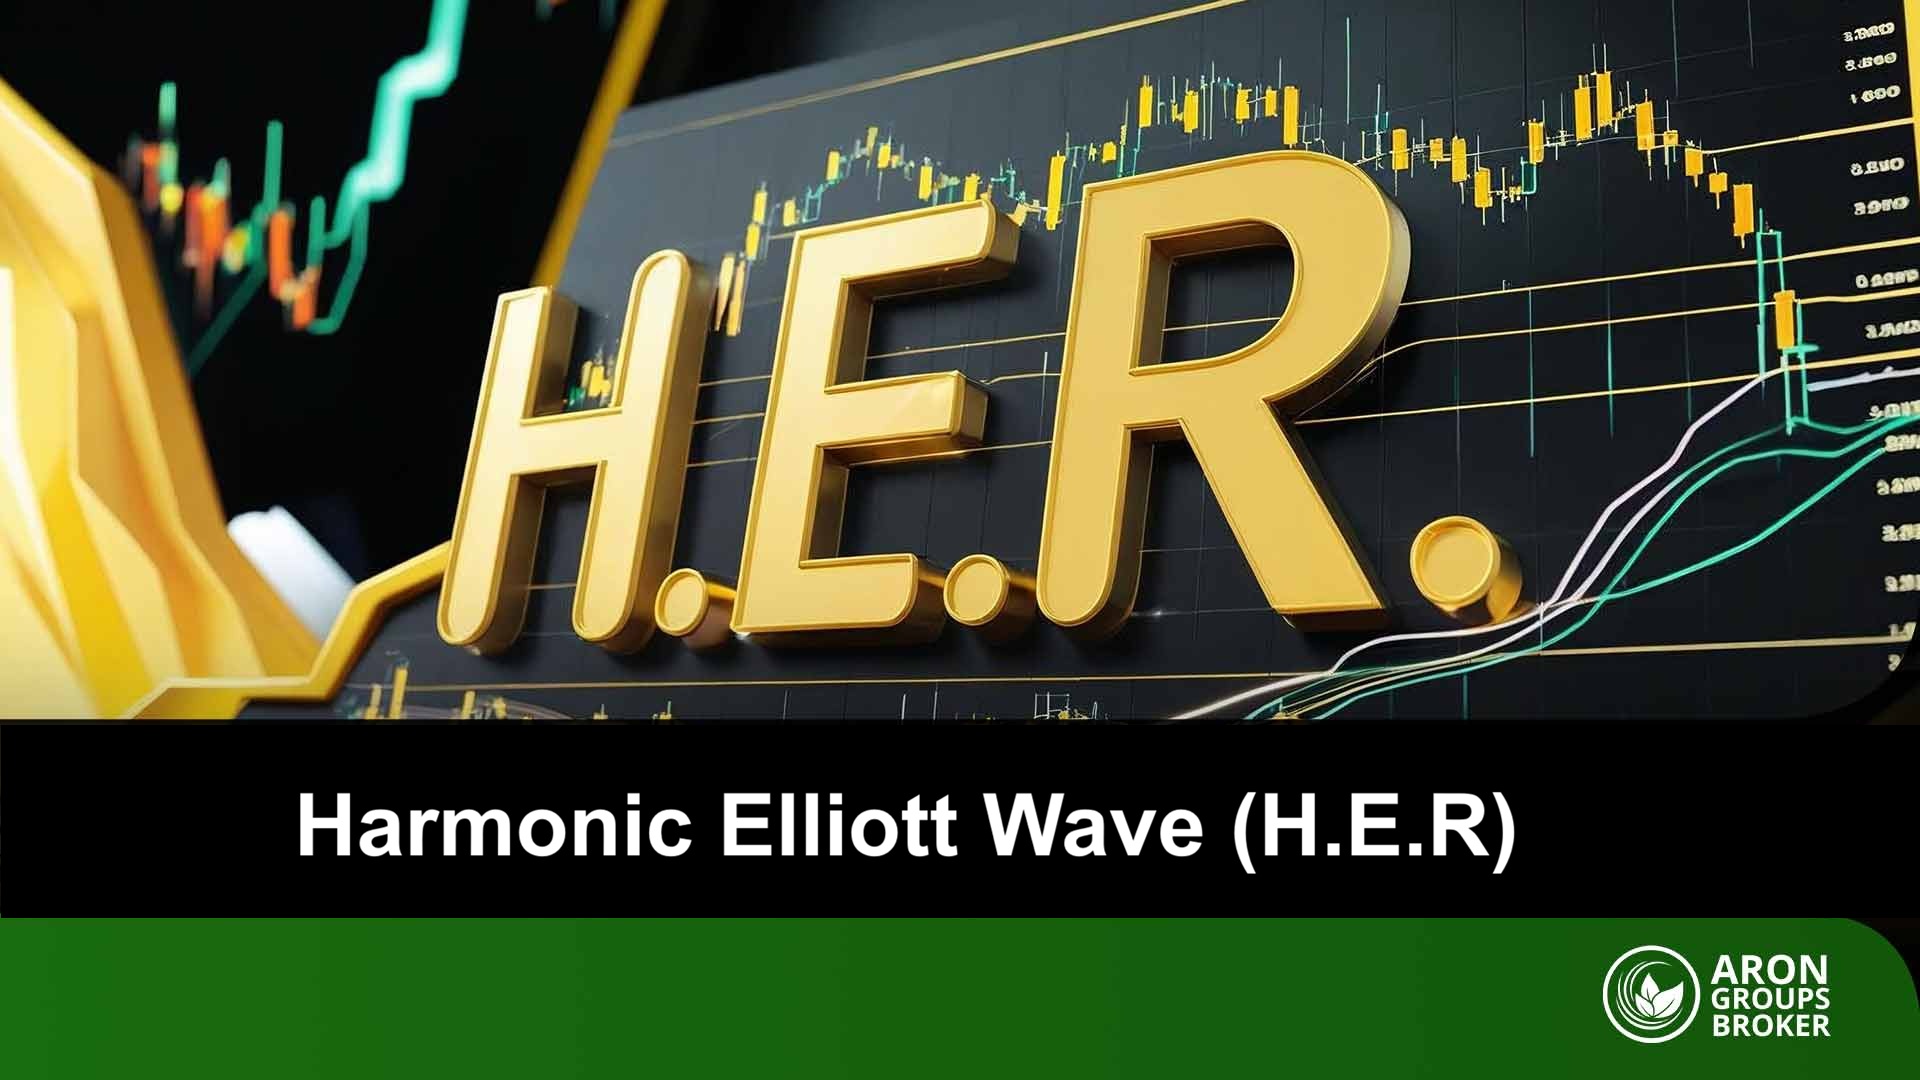
H.E.R: Harmonizing Elliott Waves and Harmonic Patterns in Technical Analysis
24 December 2025
,
Abe Cofnas
Predicting market behaviour has always been a key concern for traders. Some methods combine logic and patterns for better analysis accuracy. One such approach is the Harmonic Elliott Wave, which uses multiple tools simultaneously instead of relying on just one. This approach offers a fresh perspective on the structure of market movements. In this article, […]
- Read more
-
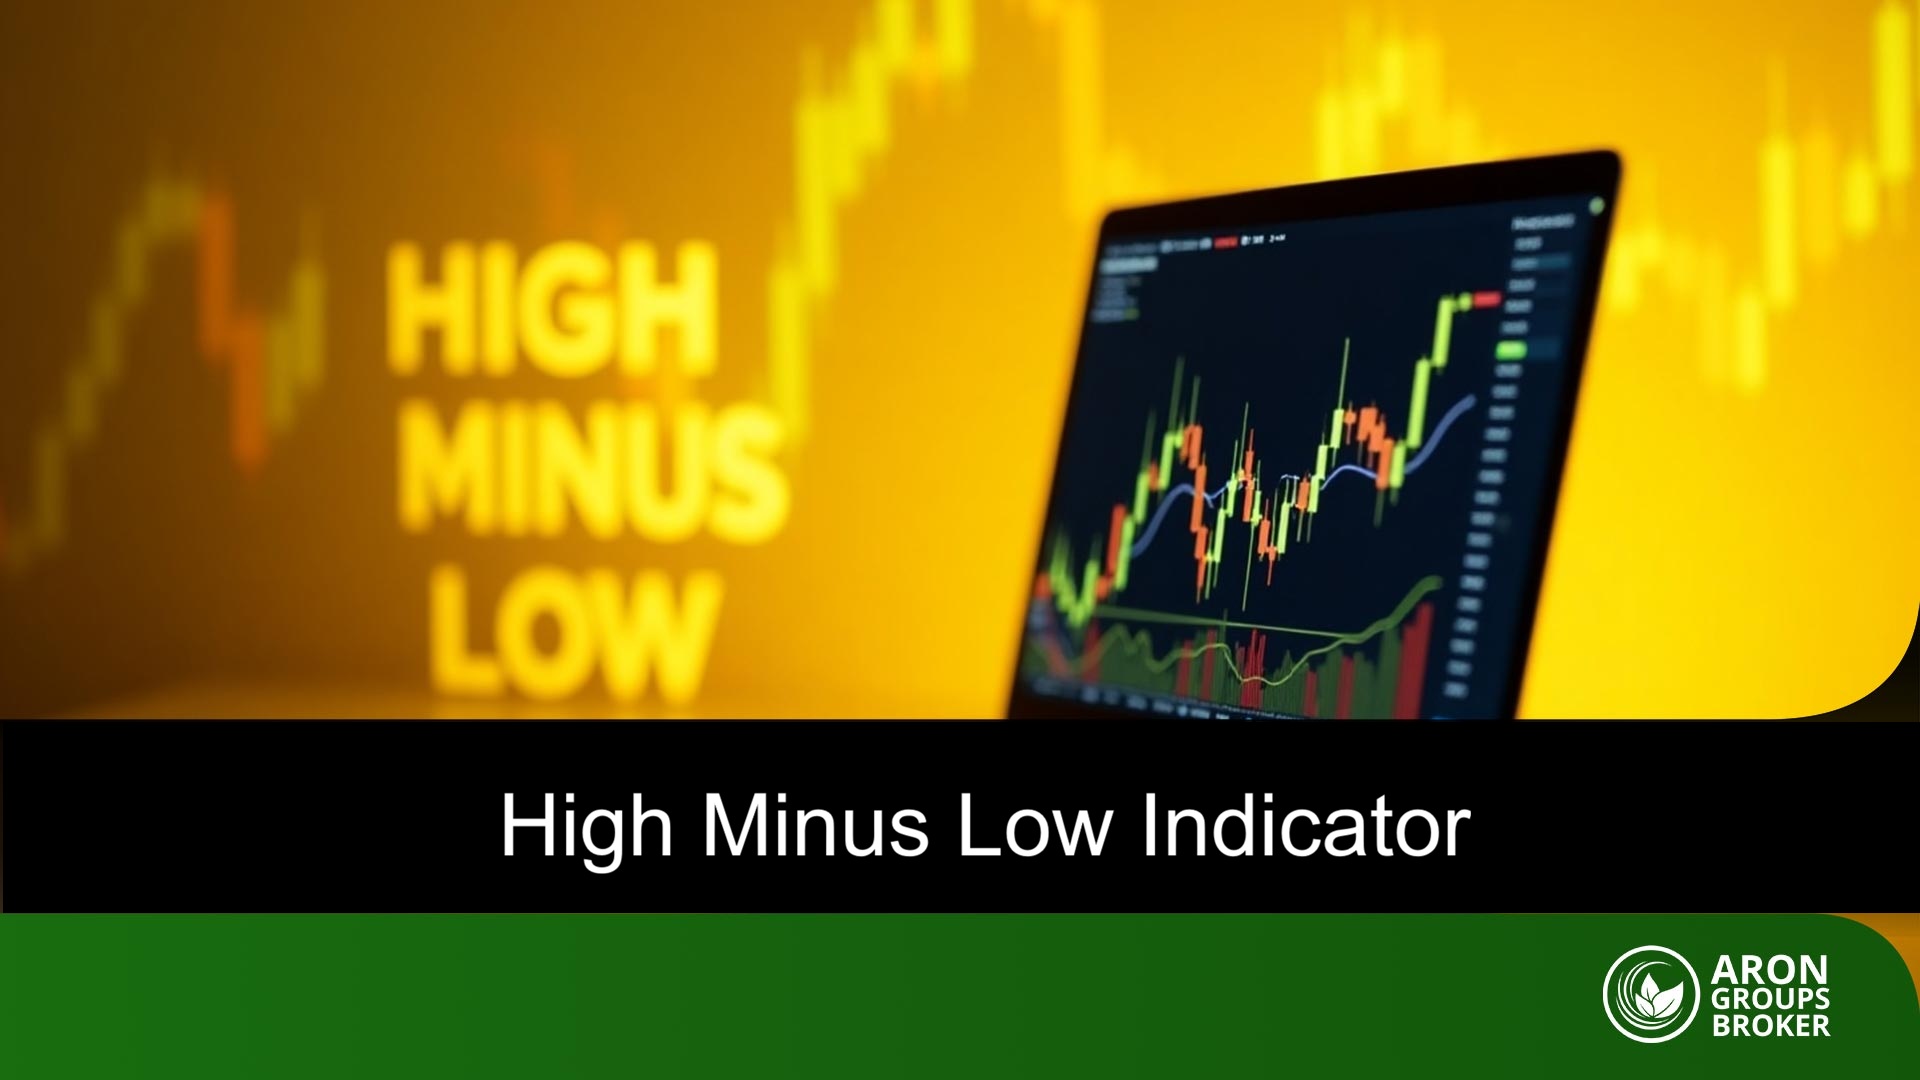
Complete Guide to the High Minus Low (H–L) Indicator and Its Uses in Technical Analysis
24 December 2025
,
Abe Cofnas
The High Minus Low Indicator is a simple, powerful tool for assessing market volatility. According to Investopedia, it measures the difference between the highest and lowest prices of an asset, such as a stock or currency. It acts like a price fluctuation thermometer, helping traders identify market opportunities. This article provides a step-by-step guide to […]
- Read more
Load more