 EN
EN


Technical
-
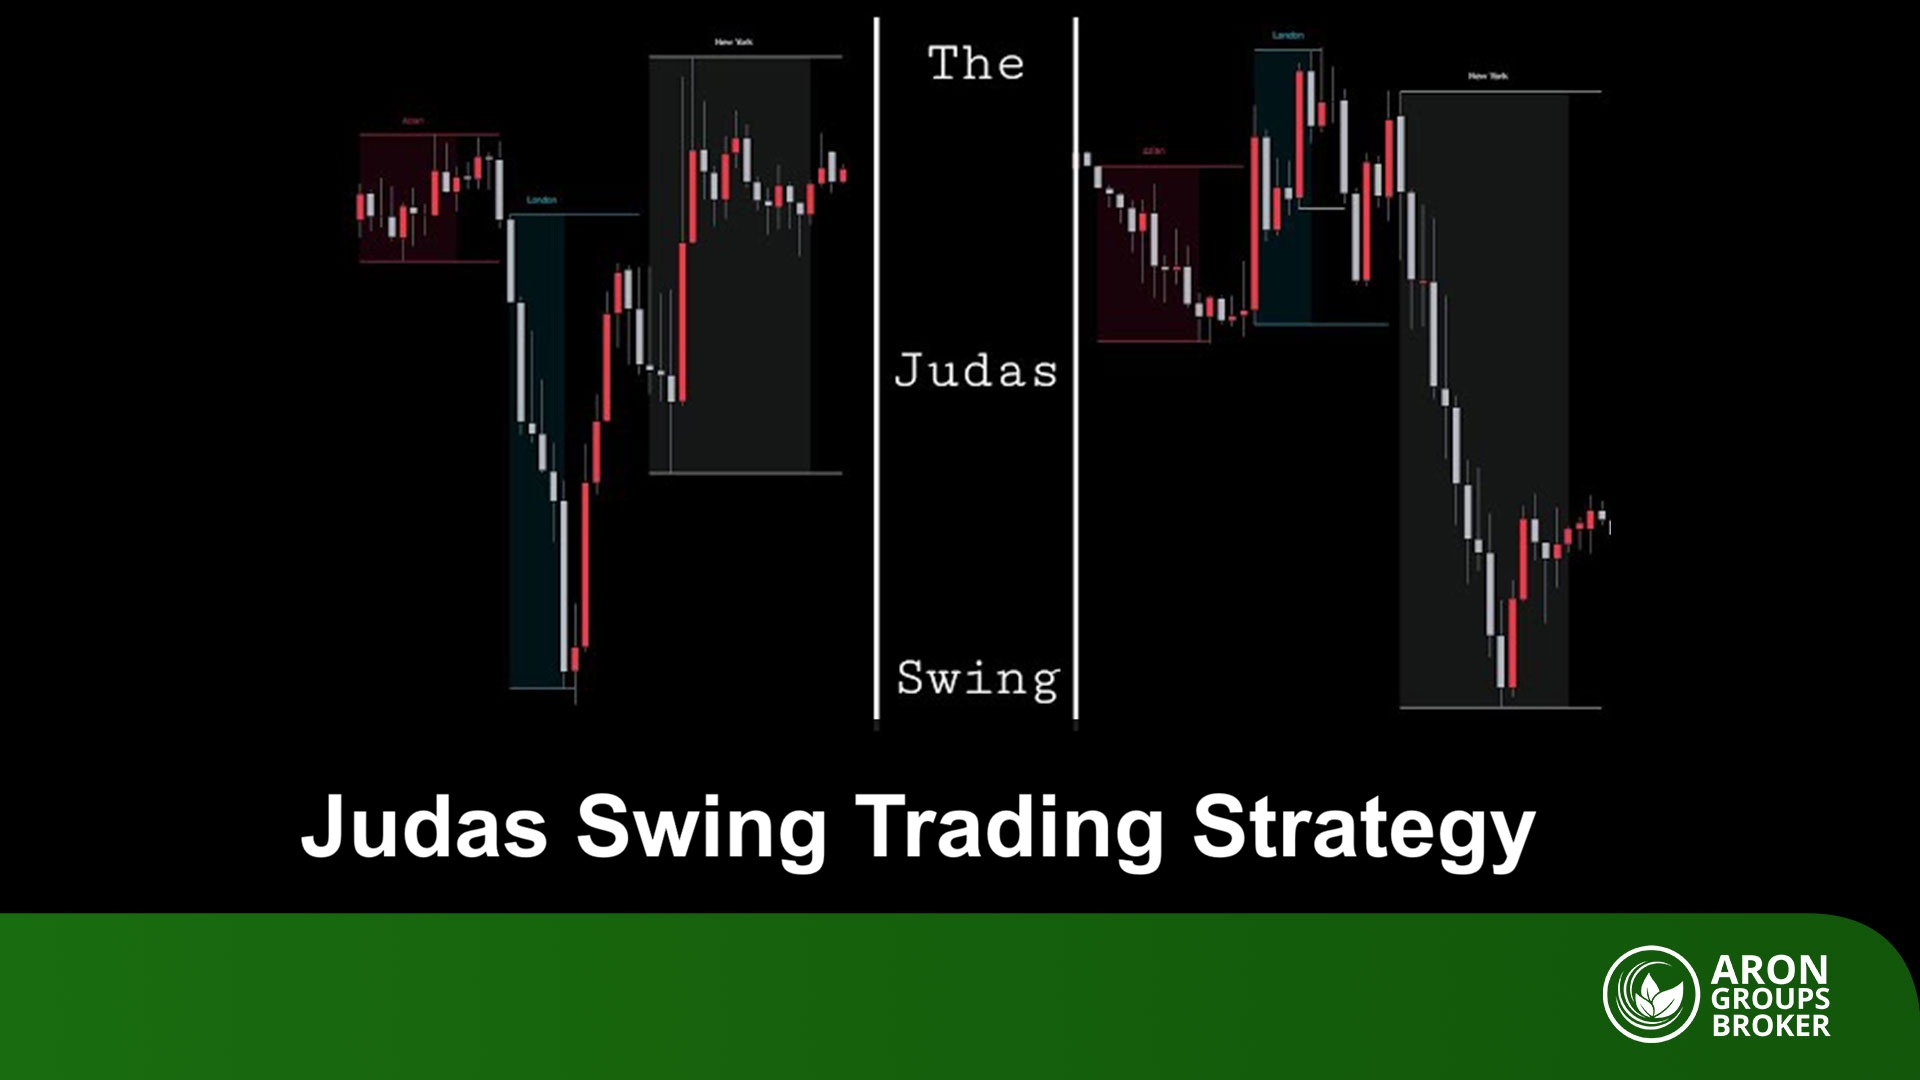
How the Judas Swing Strategy Works and How Traders Make Money from It
 24 December 2025
,
Abe Cofnas
24 December 2025
,
Abe Cofnas
In the world of forex trading, professional traders are constantly looking for strategies to profit from complex and deceptive market movements. One of these powerful strategies is the Judas Swing, also known as the “betrayer swing” for its misleading nature. In this article, we will comprehensively explore the Judas Swing strategy, how to identify it, […]
- Read more
-
H.E.R: Harmonizing Elliott Waves and Harmonic Patterns in Technical Analysis
24 December 2025
,
Abe Cofnas
Predicting market behaviour has always been a key concern for traders. Some methods combine logic and patterns for better analysis accuracy. One such approach is the Harmonic Elliott Wave, which uses multiple tools simultaneously instead of relying on just one. This approach offers a fresh perspective on the structure of market movements. In this article, […]
- Read more
-
Complete Guide to the High Minus Low (H–L) Indicator and Its Uses in Technical Analysis
24 December 2025
,
Abe Cofnas
The High Minus Low Indicator is a simple, powerful tool for assessing market volatility. According to Investopedia, it measures the difference between the highest and lowest prices of an asset, such as a stock or currency. It acts like a price fluctuation thermometer, helping traders identify market opportunities. This article provides a step-by-step guide to […]
- Read more
-
How to Get Accurate Trading Signals Using the MA Cross Indicator
24 December 2025
,
Abe Cofnas
Traders seek ways to easily identify market trend changes and make more confident decisions for buying or selling. One effective method is the MA Cross Indicator. This tool compares moving averages across different timeframes to show when a price reversal is likely. Its simplicity makes it popular with both beginners and professional traders. In this […]
- Read more
-
What Is a Requote in Forex? Reasons, Impact, and How to Avoid It
24 December 2025
,
Abe Cofnas
Sometimes a trader places a buy or sell order, but the price changes just then. The system shows a message prompting the trader to select a new price. In such cases, the question arises: What is a requote in Forex, and why does it happen? Many beginners, when faced with a requote for the first […]
- Read more
-
Boom Hunter Pro Indicator: A Professional Tool for Catching Major Price Moves
23 December 2025
,
Abe Cofnas
In a market environment that feels stable, one spark can still completely reshape conditions. In that setting, an indicator that detects the start of a large wave earlier becomes a real competitive edge. Boom Hunter Pro was built for exactly this purpose: to track hidden momentum and prepare you for timely entries. In this guide, […]
- Read more
-
What Is the BOP Indicator, and What Role Does It Play in Analysing Buyer and Seller Strength?
23 December 2025
,
Abe Cofnas
Traders are always looking for tools that clarify the tug-of-war between buyers and sellers in the market. One practical tool is the BOP indicator, or Balance of Power, which measures who is driving price action. It helps you see, over a specific period, whether buyers or sellers had stronger control of the market. In this […]
- Read more

-
Elder Impulse System Indicator: Settings & Setup
23 December 2025
,
Abe Cofnas
Many traders, when analyzing charts, seek tools that can show both the direction and strength of market movement. This is where the Elder Impulse System comes in. It combines trend analysis with momentum, offering a clearer view of market conditions. By using this method, traders can more easily identify the right moments to enter or […]
- Read more
-
Mastering Donchian Channel Breakouts in Forex
23 December 2025
,
Abe Cofnas
In technical analysis, one of the popular methods for assessing price volatility and identifying optimal entry and exit points in the market is using the Donchian Channel. This tool provides a clear picture of price behavior by showing the highest and lowest prices within a specified time period. It helps traders better understand the market’s […]
- Read more
-
Getting to Know the Best Indicators for Professional Swing Trading on Short Time Frames
23 December 2025
,
Abe Cofnas
Swing trading is one of the most popular trading styles. In this approach, traders aim to profit from short-term price swings across smaller time windows. To make this strategy work consistently, you need indicators that fit short time frames and reduce guesswork. Many traders ask a simple question: which indicators are actually useful for swing […]
- Read more
Load more