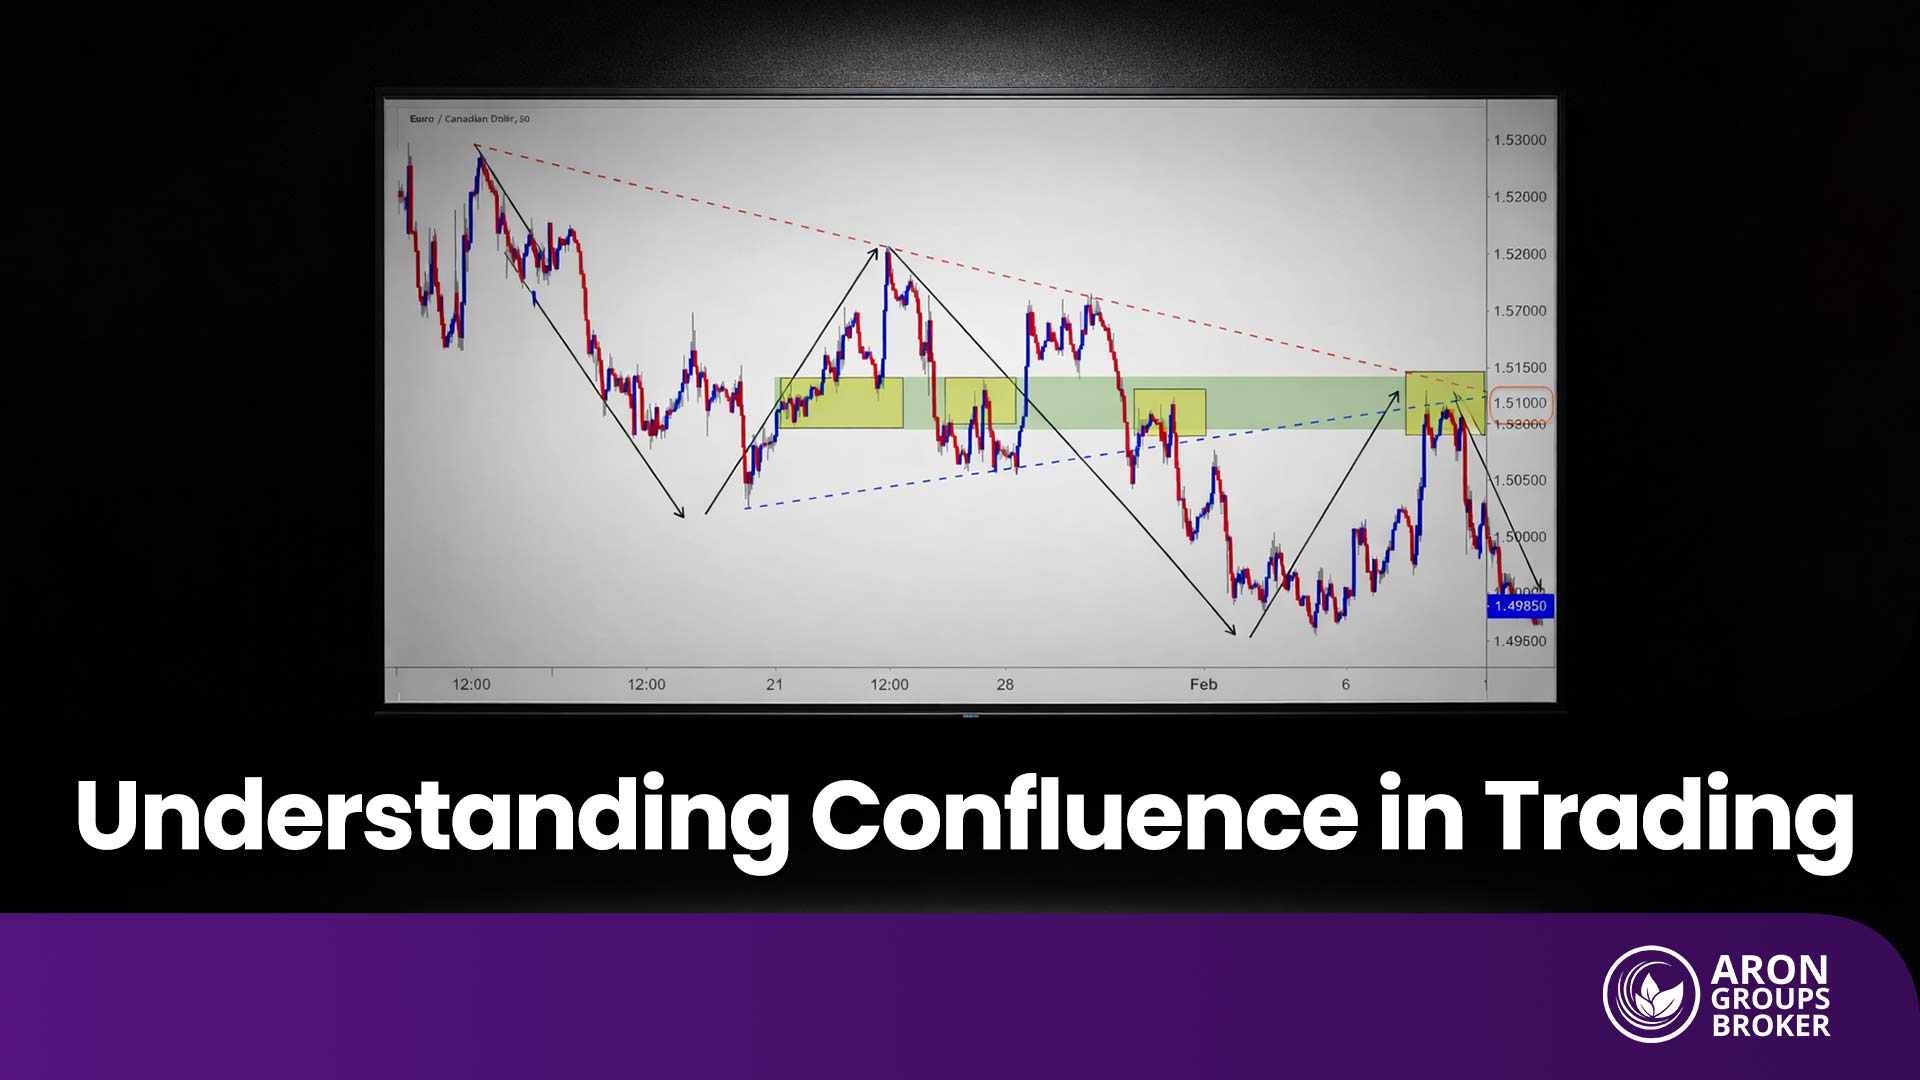


Confluence in trading is the point at which multiple, independent factors (such as technical indicators, market structure, and fundamental bias) align to confirm a specific trade idea. It moves a trader from relying on “hope” or single signals to relying on the “weight of evidence.”
In this guide, we will break down how to apply confluence correctly, avoid analytical traps, and use price action confluence to execute cleaner, more precise trades.

- What does confluence mean in trading? It is the alignment of multiple independent factors supporting the same trade idea at a key level.
- More indicators do not equal better confluence—independence of signals matters more than quantity.
- Macro context strengthens technical confluence, especially in forex markets.
- A sniper entry refines timing, but only after a higher-timeframe confluence is established.
- If your checklist changes from trade to trade, you do not have a confluence strategy—you have inconsistency.
Understanding and Using Confluence in Trading
According to How to Trade, Confluence in trading is the alignment of two or more independent technical or fundamental factors that support the same market direction at a specific price level.
Actually, confluence is not about adding more indicators to your chart; it is about aligning independent evidence so that risk is justified by probability. When used correctly, Confluence transforms trading from reactive guessing into structured decision-making. The goal is simple: stack objective factors that logically support the same market bias.
What Confluence Really Means in Forex and Other Markets
In the context of global markets, confluence is the vertical alignment of different analytical layers. Whether you are trading the EUR/USD or Bitcoin, price action doesn’t move in a vacuum.
What is confluence in forex? The answer lies in filtering volatility. Currency markets react sharply to macroeconomic releases, interest rate expectations, and liquidity flows. When technical structure aligns with macro bias and key price levels, you are no longer trading a random move—you are trading a structured setup.
The same logic applies to equities, indices, and crypto. Confluence is market-agnostic because it is based on probability alignment rather than asset-class preference.
How to Apply Confluence to Make Better Trading Decisions
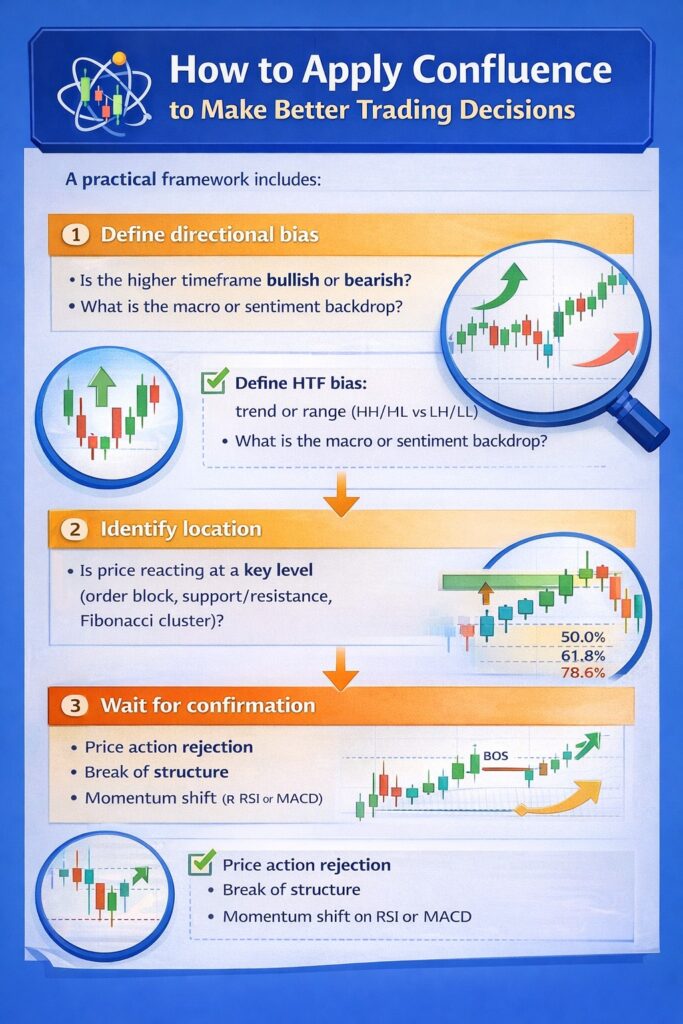
Knowing what confluence means in trading is one thing; applying it consistently is another. A practical framework includes:
- Define directional bias
- Is the higher timeframe bullish or bearish?
- What is the macro or sentiment backdrop?
- Identify location
- Is price reacting at a key level (order block, support/resistance, Fibonacci cluster)?
- Is price reacting at a key level (order block, support/resistance, Fibonacci cluster)?
- Wait for confirmation
- Price action rejection
- Break of structure
Momentum shift on RSI or MACD
Example:
If EUR/USD is in a higher timeframe uptrend, retraces into a daily demand zone that aligns with a 61.8% Fibonacci level, and prints a bullish engulfing candle with RSI divergence, that is structured confluence—not coincidence.
Q: Do more indicators mean better confluence?
A: No. Too many indicators lead to “Analysis Paralysis.” The goal is to find 2-4 independent factors that converge at a single price point.
Avoiding Confirmation Bias When Combining Multiple Signals
Confirmation bias occurs when you selectively interpret indicators to justify a trade you already want to take.
Warning signs include:
- Adding new indicators only after price moves against you
- Ignoring higher timeframe structure
- Cherry-picking signals that support your bias
A disciplined confluence trading strategy requires predefined rules. Decide in advance:
- Which tools do you use
- What qualifies as valid confirmation
- How many aligned factors are required before entry
If three independent elements align, take the trade. If they do not, stand aside. Confluence increases probability—but only when applied objectively, not emotionally.
Core Principles of a Confluence Trading Strategy
A professional confluence trading strategy is about stacking independent variables that each add measurable weight to your trade idea.
The objective is simple: increase statistical edge while reducing emotional decision-making.
By following core principles, you ensure that every entry is backed by a logical framework rather than an emotional impulse.
How to Build a Framework: Structure, Trigger, and Confirmation
A professional trading framework acts as a filter, allowing only the highest quality setups to pass through. To achieve this, we divide our analysis into three distinct layers:
- Market Structure: This is your foundation. You must identify the current environment. Is the market in a clear uptrend (Higher Highs and Higher Lows), or is it trapped in a range? Establishing structure prevents you from trading against the dominant institutional flow.
- The Trigger: The specific event that alerts you to a potential trade. It could be price reaching a “Point of Interest” (POI), such as a Daily Order Block or a specific Fibonacci level.
- The Confirmation: This is the final “green light.” Before clicking buy or sell, you look for a shift in momentum or a specific candlestick pattern that indicates the level is holding.
Using Stacked Probabilities to Identify High-Confidence Trades
According to ForexGDP, every aligned factor in confluence trading adds incremental weight. This is the core of stacking probabilities.
For example:
- Higher timeframe uptrend → bullish bias
- Price retraces into daily demand → strong location
- 61.8% Fibonacci retracement aligns → technical cluster
- RSI shows bullish divergence → momentum confirmation
Individually, each signal is moderate. Together, they form a high-confidence environment.

Warning: |
Integrating Price Action Confluence for Cleaner, Precise Entries
According to thestockdork, Price action becomes confluence only when it confirms a trade idea that is already supported by other independent factors.
In other words, you do not take a setup because a candle pattern looks attractive—you take it because structure and location are already qualified, and price action is the final timing layer.
Effective execution confirmations include:
- Rejection wicks at the confluence level
- Engulfing patterns after a liquidity sweep
- Break of structure and retest inside the zone
- Compression followed by expansion from the level
For example, if price retraces into a higher-timeframe demand zone that aligns with a 50–61.8% Fibonacci retracement and sits beneath equal lows (a liquidity pool), a sweep of those lows followed by a micro break of structure provides execution confluence. The entry is not justified by the break alone—it is justified by the stacked evidence that the area is meaningful and the reaction is confirmed.
Pro Tip:
Never enter a trade just because the price is cheap. Wait for the confluence of structure and action to prove the buyers or sellers have actually stepped in.
Practical Tools and Techniques for Confluence
Confluence becomes powerful only when it is applied through structured techniques that improve timing, location, and risk control.
The objective is not to add complexity. It is to refine entries, reduce false signals, and increase risk to reward efficiency.
How to Use Order Blocks to Identify Key Market Levels
Order blocks represent institutional footprints—zones where significant buying or selling originated before a strong displacement move. Order blocks are not random rectangles; they are areas where liquidity was accumulated before expansion.
To integrate order blocks into a confluence trading strategy:
- Identify a strong, impulsive move that broke market structure.
- Mark the last opposing candle before that impulse.
- Wait for the price to return to that zone.
Confluence strengthens when an order block aligns with:
- Higher timeframe trend
- Fibonacci retracement (e.g., 50%–61.8%)
- Equal highs/lows (EQL & EQH as liquidity pools)
- RSI divergence or momentum shift
Sniper Entry Techniques for Pinpoint Accuracy
A sniper entry in a confluence trading strategy means using High-Time Frame bias to define the level, then using Low-Time Frame confirmation to time the trade with tight risk.
The typical sequence is:
- The Tap: Price reaches a pre-qualified confluence zone (e.g., an order block overlapping key support/resistance and a 50–61.8% Fibonacci retracement).
- The Hunt (Liquidity Sweep): Price briefly trades through the level to take stops above/below obvious highs/lows, creating the liquidity that often precedes the real move.
- The Shift (CHOCH/BOS): A change of character (CHOCH) or break of structure (BOS) on the LTF signals a shift in short-term control and confirms displacement away from the zone.
- The Return (Retest Entry): Entry is taken on the first retracement into the origin of displacement—often a fair value gap (FVG) or a clean retest of the broken micro-structure.
Q: Why not just buy as soon as the price hits a support level?
A: Because a support level is just a “where.” A sniper entry confirms the “when.” Without waiting for an LTF shift, you are catching a falling knife; with it, you are riding the momentum.
Evaluating Signals with Weight of Evidence for Smarter Trades
The weight-of-evidence approach means you assign logical importance to each factor rather than treating all signals equally.
Not all confluence elements carry the same strength, for example:
- Higher timeframe structure > lower timeframe pattern
- Liquidity sweep > basic candlestick pattern
- Macro catalyst alignment > isolated oscillator reading
A high-probability setup typically requires a high aggregate score based on the following hierarchy:
| Evidence Tier | Examples | Weight/Impact |
|---|---|---|
| Primary (The Foundation) | HTF Market Structure, Major Supply/Demand Zones | Highest |
| Secondary (The Catalyst) | Fibonacci Clusters, Order Blocks, VWAP | Medium |
| Tertiary (The Confirmation) | RSI Divergence, Candlestick Patterns, MACD Cross | Supporting |
How to Score Your Trade:
A trade based solely on tertiary signals (such as an RSI being oversold) is a low-probability gamble. However, a trade where:
- Price hits a Daily Order Block (Primary),
- Aligns with a 78.6% Fib (Secondary),
- And prints a Morning Star pattern (Tertiary)
represents a high-conviction setup.
Reducing False Signals and Improving Your Win Rate
Confluence is supposed to filter noise—yet most traders still get chopped up because they treat “more signals” as “better signals.” That’s backwards. Your win rate improves when you reduce low-quality trades, not when you trade more often with extra indicators.
The purpose of this section is to tighten your process so you stop taking setups that look aligned but have weak underlying logic.
The core idea is simple: only trade when evidence is independent, location is meaningful, and execution is confirmed.
How to Spot High-Probability Setups Before You Enter
High-probability setups are predictable in one way: they tend to appear where the market has a reason to react. That reason is usually structure + location + liquidity—then your trigger comes last.
Use this pre-entry filter:
- Structure: Is HTF trend/structure aligned with your direction?
- Location: Are you at a level that matters (High-Time Frame supply/demand, order block, Support/Ressistance level, Fib cluster)?
- Liquidity: Is there a nearby pool of stops (equal highs/lows, session high/low) that price can sweep?
- Confirmation: Did you get displacement + Low-Time Frame CHOCH/BOS, not just a pattern?
A simple rule that saves accounts: no confirmation, no trade.
Avoiding Common Pitfalls in Confluence Trading
Most “confluence” mistakes come from trying to force a trade.
According to Trading View, common traps you must eliminate:
- Indicator stacking: Adding more oscillators to feel safer. That’s correlation, not confluence.
- Ignoring market context and higher timeframe: Taking LTF signals against HTF structure because the entry looks clean.
- Level spam and overtrading: Marking too many zones so every price looks like “a confluence area.”
- Late confirmation: Entering after the move already happened, then blaming “fakeouts.”
- Moving the goalposts: Redefining confluence rules mid-trade to avoid admitting you’re wrong.
- Poor risk management despite strong confluence: Skipping predefined invalidation, using arbitrary stop-loss placement, or oversizing the position.
Key Insight:
A confluence area is a price zone where multiple independent technical or fundamental factors align, increasing the probability of a meaningful market reaction.
Backtesting and Refining Your Trades for Better Results
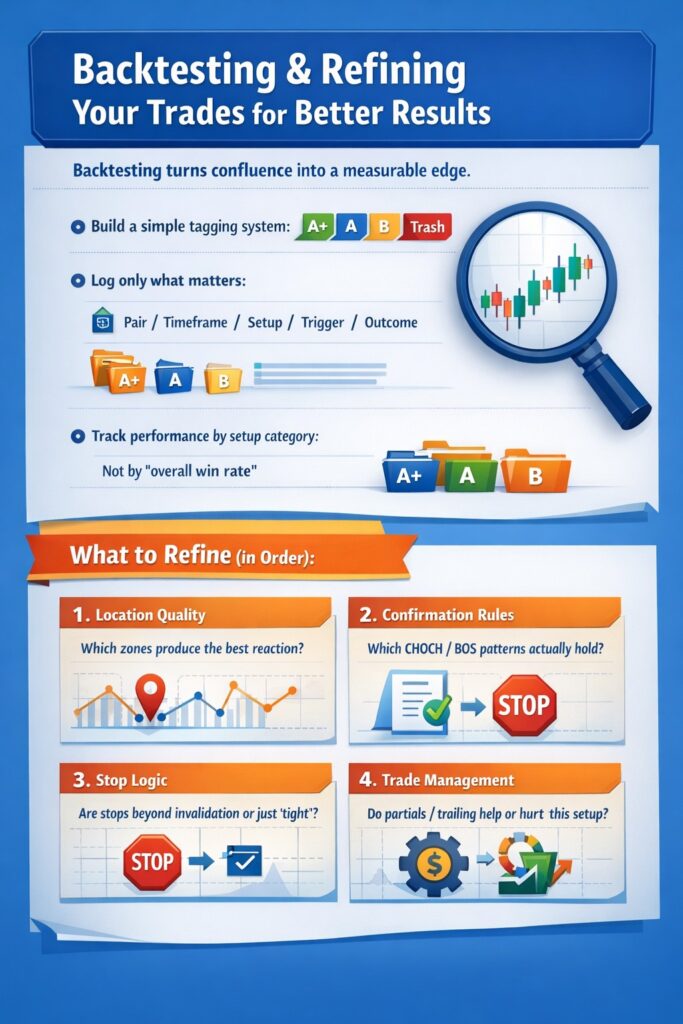
Backtesting turns confluence in trading from a concept into a measurable edge.
Keep it clean:
- Build a simple tagging system: A+ / A / B / Trash
- Log only what matters: pair/asset, timeframe, setup type, confluence factors, entry trigger, stop placement, outcome, notes
- Track performance by setup category, not by “overall win rate”
What to refine (in order):
- Location quality: Which zones produce the best reaction?
- Confirmation rules: Which CHOCH/BOS patterns actually hold?
- Stop logic: Are you placing stops beyond true invalidation or just “tight”?
- Trade management: Do partials/trailing help or hurt this setup?
Hard truth:
If your confluence checklist changes depending on the setup, you don’t have a strategy—you have a story.
Applying Confluence Across Different Markets
Confluence is not asset-specific—it is probability alignment applied to different market structures. However, each market has unique drivers, liquidity conditions, and volatility behavior. A professional approach adapts the confluence trading strategy to the environment rather than applying the same template everywhere.
Confluence Strategies Specifically for Forex Traders
When traders ask, What is confluence in forex?, the answer must include macro sensitivity. Forex is heavily driven by Interest rate expectations, central bank policy, economic news, and risk sentiment flows.
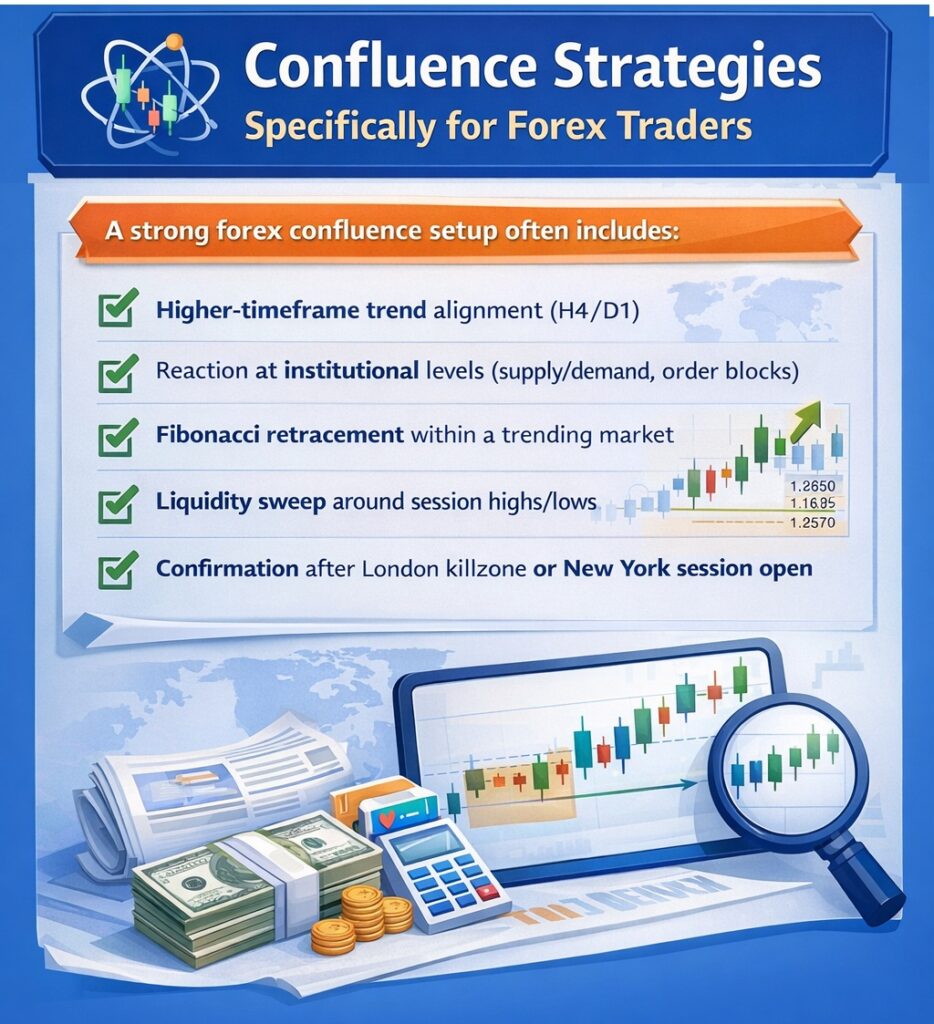
A strong forex confluence setup often includes:
- Higher-timeframe trend alignment (H4/D1)
- Reaction at institutional levels (supply/demand, order blocks)
- Fibonacci retracement within a trending market
- Liquidity sweep around session highs/lows
- Confirmation after London killzone or New York session open
In forex, timing around sessions and news events is part of the edge. Ignoring that reduces confluence quality.
Adapting Confluence Techniques for Stocks and Crypto
Stocks and crypto require contextual adjustments.
For Stocks:
- Earnings reports and guidance are major catalysts.
- Index correlation (e.g., S&P 500 trend) matters.
- Volume and market breadth provide additional confirmation.
A stock trade may combine weekly support, volume spike at key level, bullish market structure, and positive earnings surprise
For Crypto:
- Volatility is higher and liquidity can be thinner.
- Weekend trading affects structure differently than forex.
- Funding rates and open interest can provide flow insight.
Crypto confluence might include daily demand zone, RSI divergence, liquidity sweep below equal lows, and break of structure with strong volume expansion.
For both stock and crypto market, the principle is the same, but execution must respect the asset’s behavior.
Table: Confluence Strategies for different markets
| Market | Main Drivers (Context) | High-Quality Confluence Checklist |
|---|---|---|
| Forex | Interest rate expectations, central bank policy, inflation & employment data, risk sentiment flows | HTF trend alignment (H4/D1) + institutional levels (supply/demand, order blocks) + Fib retracement in-trend + liquidity sweep at session highs/lows + confirmation after London/NY open |
| Stocks | Earnings/guidance, index correlation (e.g., S&P 500), volume & market breadth | Weekly support + volume spike at key level + bullish structure + positive earnings catalyst |
| Crypto | Higher volatility, thinner liquidity, weekend structure shifts, funding rates & open interest | Daily demand zone + RSI divergence + liquidity sweep below equal lows + BOS with strong volume expansion |
Real-Life Examples of Successful Confluence Trades You Can Learn From
As a real-life example, take a look at the situation below:
GBP/USD is bullish on the daily timeframe after a hotter-than-expected UK inflation release strengthens GBP while broad USD weakness keeps the pair supported.
After an impulsive rally, the price pulls back into a daily demand zone that also overlaps the 50–61.8% Fibonacci retracement, creating clean location confluence.
During the London session, the price briefly dips below nearby equal lows (a liquidity sweep), then snaps back into the zone and prints a sharp bullish displacement.
Dropping to the Low-Time Frame, a BOS/CHOCH confirms the shift, and the entry is taken on the first retrace into the displacement origin with invalidation below the sweep low; structured confluence from macro + HTF level + Fib + liquidity + LTF confirmation.
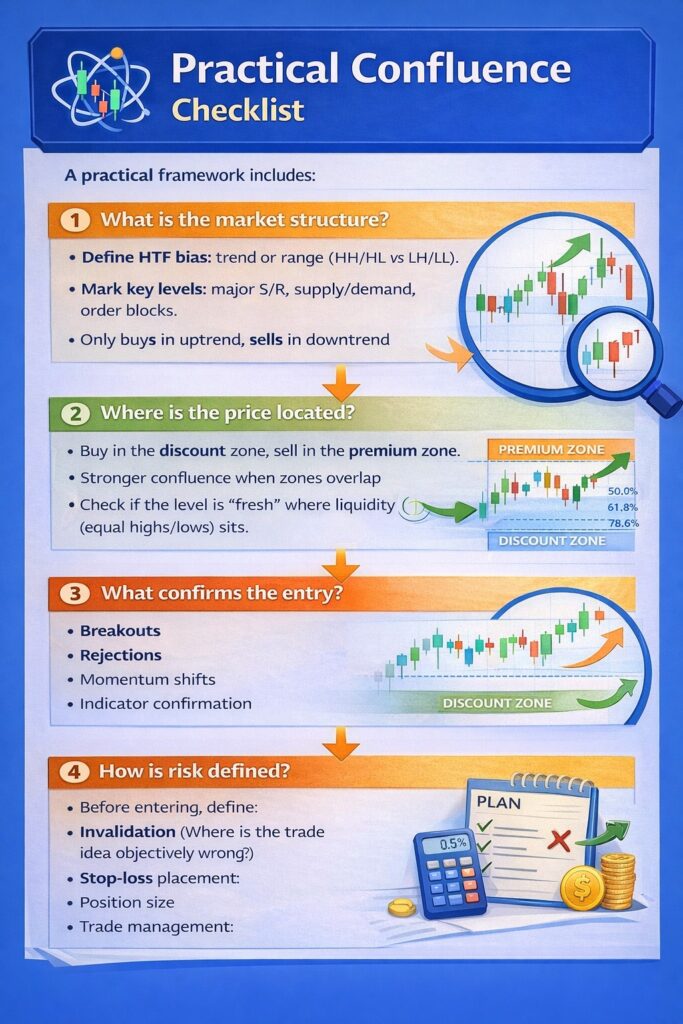
Your Practical Confluence Checklist
A practical confluence checklist prevents emotional decisions and forces you to qualify every setup before risking capital.
Confluence should answer four questions, in order:
- What is the market structure?
- Where is the price located?
- What confirms the entry?
- How is risk defined?
If you cannot answer all four clearly, the trade is incomplete.
Aligning Market Structure with Key Levels Step by Step
Every confluence setup begins with structure and alignment with key levels:
- Define HTF bias: trend or range.
- Mark key levels: major S/R, supply/demand, order blocks.
- Only trade levels that agree with the structure (buys in uptrend, sells in downtrend).
If structure and level disagree, you do nothing. Confluence requires alignment, not compromise.
Checking Price Location Across Supply, Demand, and PD Zones
Location determines whether the trade offers value.
Use this quick filter:
- Buys should be in the discount zone, sells in the premium zone.
- Stronger confluence when zones overlap (e.g., demand + Fib + structure flip).
- Check if the level is “fresh” and where liquidity (equal highs/lows) sits.
Confluence improves when structure, PD positioning, and liquidity align in one area.
Identifying Entry Triggers from Breakouts, Rejections, or Momentum Shifts
Location alone is not an entry. Execution requires confirmation.
Common trigger categories:
- Breakouts: Break and retest of structure after compression
- Rejections: Strong wick rejection at a confluence level
- Momentum shifts: LTF BOS/CHOCH after liquidity sweep
- Indicator confirmation: RSI divergence or MACD crossover aligned with structure
Setting Risk, Position Size, and Trade Management Rules
Even a strong confluence fails. Risk control keeps you in the game long enough for probability to play out.
Before entering, define:
- Invalidation: Where is the trade idea objectively wrong?
- Stop-loss placement: Beyond structural swing, not an arbitrary distance
- Position size: Based on fixed percentage risk (e.g., 0.5–2%)
- Trade management:
- Partial profit at 1R?
- Move stop to breakeven after structure confirms?
- Trail behind new swing highs and swing lows?
A professional confluence checklist does not increase complexity. It increases discipline.
Trading rule:
If structure aligns, location offers value, execution confirms intent, and risk is controlled—you have a tradable setup. If any pillar is missing, you wait.
Conclusion
Confluence in trading is not about complexity—it is about alignment. When market structure, key levels, liquidity, macro context, and confirmation signals point in the same direction, you are no longer trading opinions—you are trading probability.
Mastering Confluence does not mean predicting every move. It means waiting for high-quality conditions, executing with precision, and managing risk so that the statistical edge compounds over time.