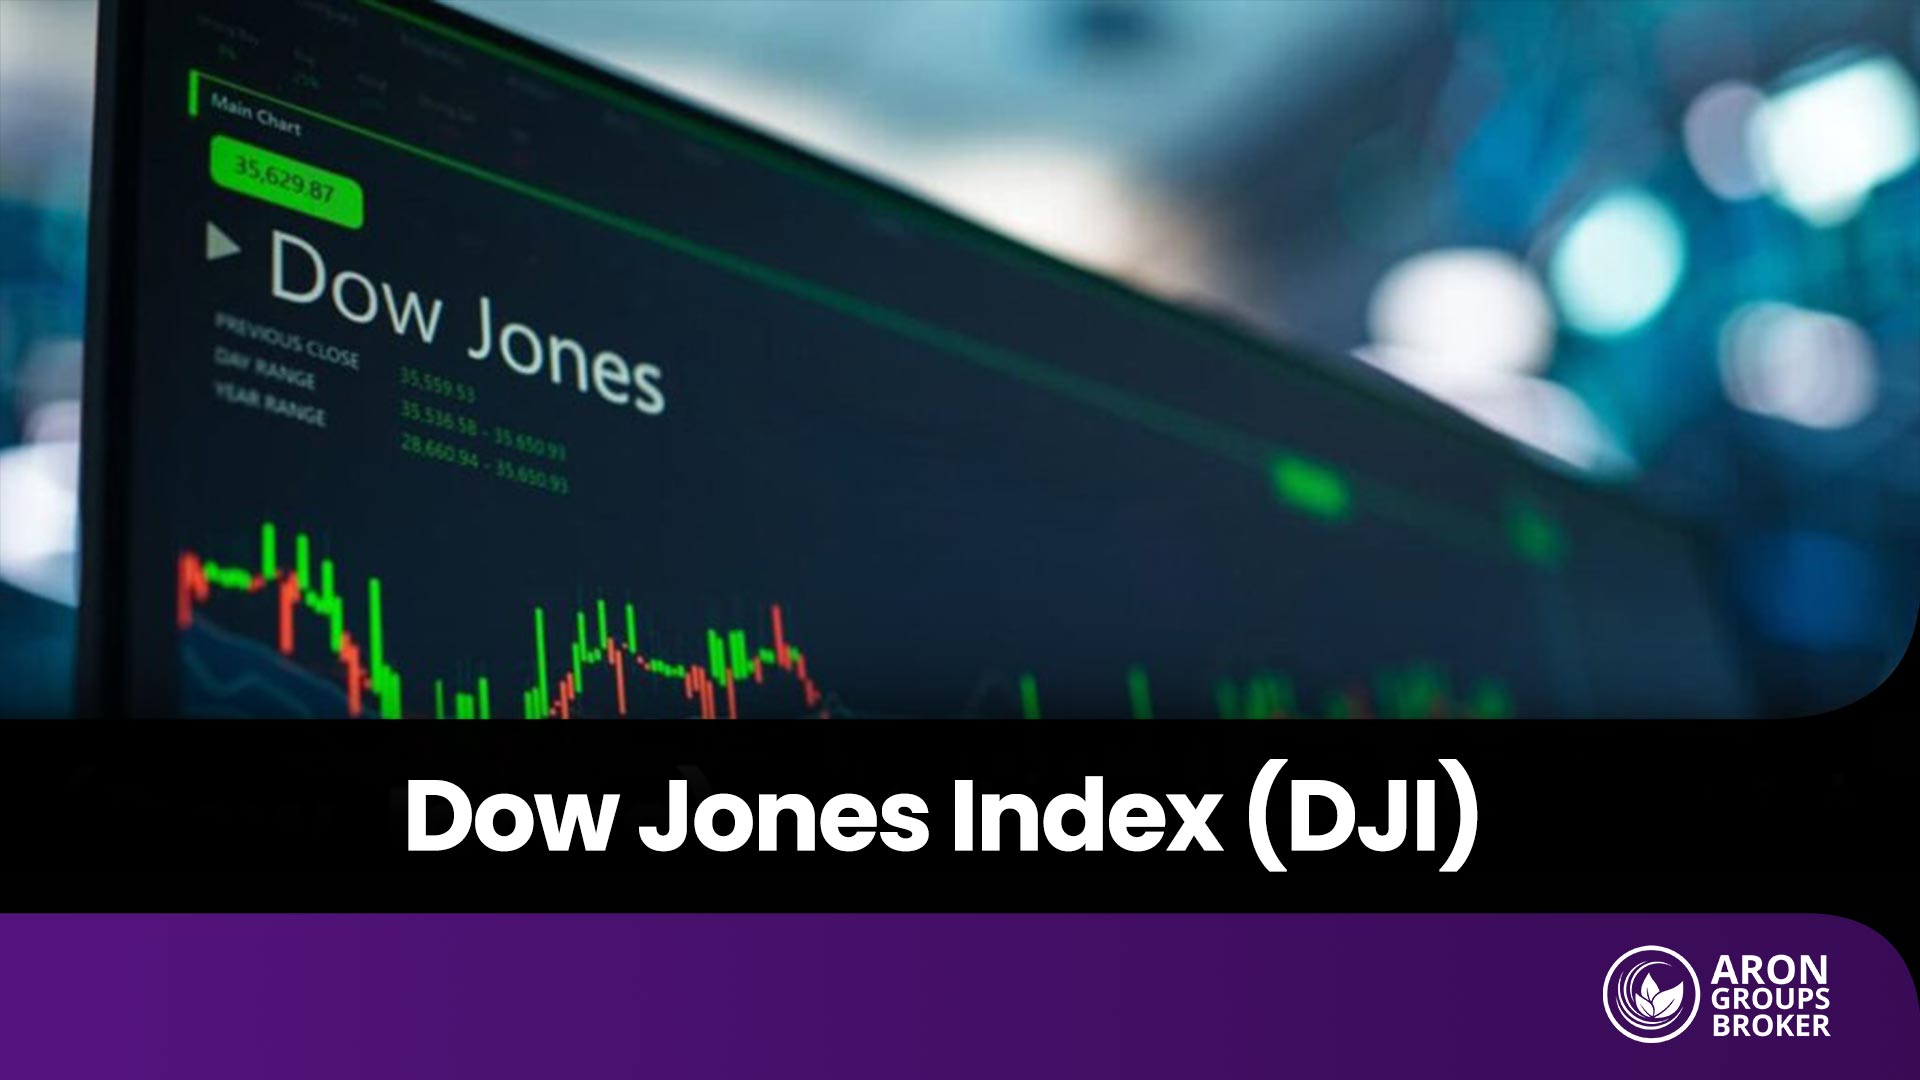


If Wall Street is the heart of the U.S. economy, the Dow Jones Industrial Average (DJIA) is its pulse, beating faster or slower to signal market sentiment to traders. This long-standing and influential index not only reflects the performance of 30 of America’s largest industrial companies but has also become one of the most popular and volatile trading instruments in the forex world. Many professional traders closely follow the Dow Jones Industrial Average as a barometer of market risk appetite, a tool for analyzing reactions to economic data, and a signal for forecasting movements in other assets.
In this article, you’ll go beyond the usual history lesson. We’ll take a practical approach to examine how the Dow Jones functions in forex trading, how to understand better its trends, and what key insights can help you trade this symbol more effectively.

- The Dow Jones Industrial Average is one of the oldest and most reputable U.S. stock market indices, tracking the performance of 30 major companies.
- Its calculation method is price-weighted rather than market-cap-weighted, setting it apart from indices like the Nasdaq and the S&P 500.
- A rise in the Dow Jones Industrial Average often correlates with a stronger U.S. dollar and lower gold prices, reflecting increased risk appetite and investor preference for riskier assets.
- Trading the Dow Jones through CFDs (Contracts for Difference) or ETFs (Exchange-Traded Funds) allows traders to profit from short-term fluctuations in the U.S. stock market.
What Is the Dow Jones Index and What Role Does It Play in Financial Markets?
The Dow Jones Industrial Average (DJIA) is one of the oldest and most reputable stock market indices in the United States, tracking the performance of 30 major, well-known companies listed on the New York Stock Exchange (NYSE) and NASDAQ. Officially known as the Dow Jones Industrial Average, it continues to serve as a key benchmark for assessing the overall condition of the U.S. economy and its stock market.
According to an Investopedia article, the Dow Jones provides a snapshot of the performance of large American industrial and service companies. These firms, active in sectors such as technology, energy, financial services, and consumer goods, collectively reflect the overall health of the U.S. equity market. For this reason, analyzing the Dow Jones can offer valuable insights into the overall state of the U.S. economy.
History of the Dow Jones Index
Charles Henry Dow, a renowned American journalist and financial analyst, co-founded Dow Jones & Company in 1882 alongside Edward Jones and Charles Bergstresser. Initially, the company focused on publishing financial news and launched The Wall Street Journal in 1889. Dow’s goal was to create a metric to gauge stock market performance, a vision that led to the development of the Dow Jones Index, which later became one of the world’s most important economic indicators.
The Dow Jones Index was first published on May 26, 1896, and originally included 12 industrial companies across various sectors of the U.S. economy, including railroads, cotton, gas, sugar, tobacco, and oil.
Significant Changes in the Dow Jones Over Time
- Increase in the number of companies: In 1916, the index listed 20 companies; by 1928, it reached 30, a figure that has remained constant ever since.
- Impact of economic events: Throughout history, the Dow Jones has been significantly affected by significant events such as the 1929 stock market crash, the Great Depression, World War II, and the 2008 financial crisis — each leaving a noticeable imprint on the index’s performance and demonstrating its sensitivity to economic and political developments.
- Industrial diversification: In recent decades, the growth of technology and service industries has reshaped the index’s composition. Today, the Dow Jones no longer exclusively represents traditional industrial sectors; it now reflects a broader view of the U.S. economy.
(Source: Wikipedia – Dow Jones Industrial Average)
How Is the Dow Jones Index Calculated?
The Dow Jones Industrial Average (DJIA) is a price-weighted index, meaning that stocks with higher share prices have a greater influence on the index’s overall value. In contrast, indices such as the S&P 500 are market-cap weighted, meaning companies with larger market capitalizations exert a greater impact on the index’s movement.
The formula for calculating the Dow Jones Index is as follows:
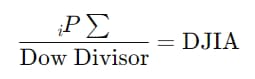
- ∑Pₙ → The sum of the current stock prices of the 30 companies included in the index
- Dow Divisor → A constant adjustment factor used to prevent artificial fluctuations in the index (it changes occasionally to account for corporate actions)
Example:
Suppose the share prices of three Dow Jones companies are $100, $150, and $250.
- Sum of prices: 100 + 150 + 250 = $500
- If the Dow Divisor = 10 → 500 ÷ 10 = 50 (DJIA)

The Dow Divisor ensures that events such as stock splits, mergers, or changes in index components do not cause misleading movements in the index value.
Which Companies Make Up the Dow Jones Index?
The Dow Jones Industrial Average (DJIA) is composed of the following companies:
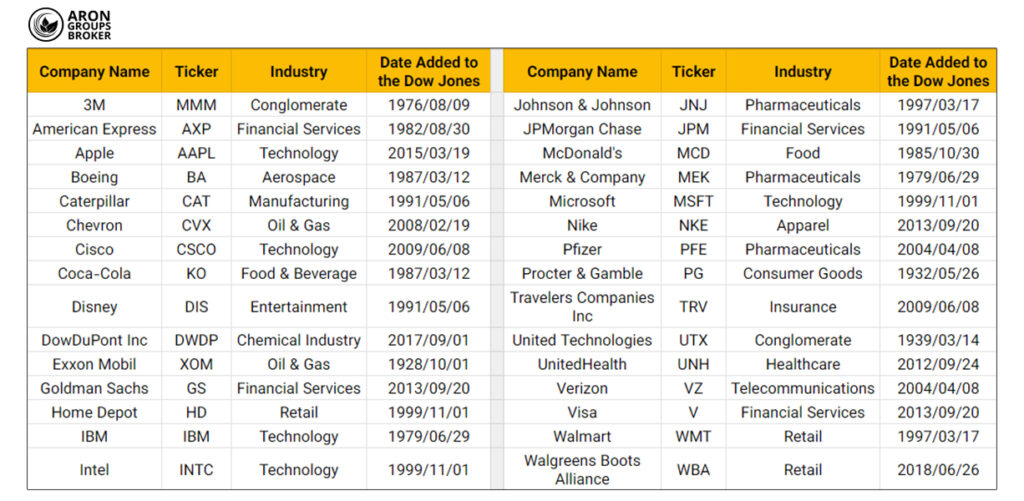
According to the Corporate Finance Institute, the composition of the Dow Jones index is not fixed and may change over time. For instance, companies such as General Electric (GE) and Hewlett-Packard (HP) were once part of the index. Still, they were later removed due to changes in market conditions and industrial structure.
Who Decides Which Companies Are Included in the Dow Jones Index?
As explained in an article on Breaking Into Wall Street, the composition of the Dow Jones index is determined by a committee consisting of representatives from S&P Dow Jones Indices and The Wall Street Journal. This committee decides which companies should be added to or removed from the 30 Dow components list.
Unlike some other indices, such as the S&P 500, the Dow Jones does not use a strict numerical or formula-based methodology for selecting companies. Instead, the committee uses a set of qualitative criteria, including:
- The company’s reputation and credibility;
- Consistent and sustainable financial growth;
- Appropriate share price (since the Dow is price-weighted);
- Industry representation to reflect diverse sectors of the U.S. economy;
- The company’s U.S. incorporation and primary operations;
- A majority of revenue is generated from the U.S. market;
- Sufficient trading volume and public float.
The committee makes these decisions confidentially to prevent artificial volatility and speculative trading. As a result, analysts and investors typically learn about changes in the Dow Jones components only after they are officially implemented.
Why Is the Dow Jones Important for Forex Traders?
The Dow Jones Industrial Average (DJIA) is one of the most significant financial market indices and is particularly important to forex traders. Its influence stems from several key factors:
- High volatility and trading opportunities;
- Sensitivity to U.S. economic news;
- Correlation with the U.S. dollar and gold;
- Global market leadership;
- Easy accessibility on trading platforms.
Let’s examine each of these factors in detail.
High Volatility and Trading Opportunities
Because the Dow Jones includes large and influential corporations, its price movements tend to be highly volatile. This volatility creates numerous short-term trading opportunities for forex and CFD traders to capitalize on rapid market fluctuations.
Sensitivity to U.S. Economic News
As a reflection of the overall health of the U.S. economy, the Dow Jones Industrial Average is directly influenced by major economic releases, including employment reports, interest rate decisions, and GDP data. Forex traders closely follow these indicators to make more informed trading decisions and anticipate market reactions.
Correlation with the U.S. Dollar and Gold
The Dow Jones often exhibits an inverse relationship with gold prices and, in many cases, a direct relationship with the U.S. Dollar Index (DXY). These correlations arise from the strong interconnection between investor sentiment, Federal Reserve policy, and global liquidity flows.
For example:
- During bullish periods in the Dow Jones Industrial Average, investors generally show greater risk appetite. This often strengthens the U.S. dollar while putting downward pressure on gold, as gold is traditionally seen as a safe-haven asset during times of uncertainty.
- Conversely, in periods of high volatility or equity market declines, capital tends to flow into gold, driving its price higher, while the Dow Jones and, sometimes, the dollar come under pressure.
Although the U.S. dollar is technically considered a risk asset, in recent years, especially during global crises, it has behaved similarly to a safe haven. Because of the dollar’s unrivaled role in the global financial system, many investors turn to it in times of instability. This phenomenon often leads to increased demand for the dollar even as the Dow Jones Industrial Average falls.
A clear understanding of these inter-market relationships enables traders to interpret cross-market signals and build more precise strategies, particularly when trading USD pairs or CFDs based on gold and equity indices.
Global Market Leadership
As one of the world’s oldest and most respected stock indices, the Dow Jones serves as a leading indicator for global financial markets. Movements in the Dow often set the tone for global market sentiment, influencing other major indices and asset classes.
Easy Accessibility on Trading Platforms
The Dow Jones symbol is available on most forex brokers and popular trading platforms such as MetaTrader and TradingView. Its wide availability and support for CFD trading have made it one of the most widely traded and preferred instruments among both retail and professional traders.
How to Trade the Dow Jones in Forex
To trade the Dow Jones Industrial Average (DJIA) in the forex market, traders can use brokers that offer CFD (Contract for Difference) or ETF (Exchange-Traded Fund) trading.
Search for the Dow Jones symbol on trading platforms such as MetaTrader or TradingView, and open a position depending on your account type (Standard or ECN). In this method, you don’t actually own the underlying asset; you are merely trading based on the price fluctuations of the index.
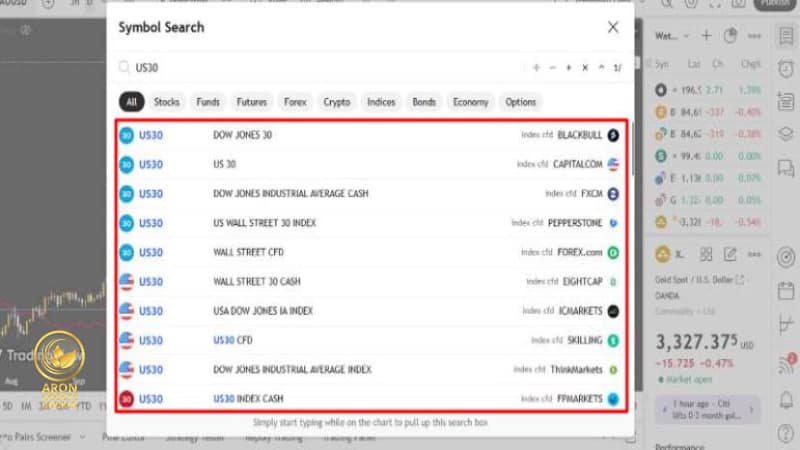
Dow Jones Symbol Across Brokers
In most reputable forex brokers, the Dow Jones is offered as a CFD instrument and is typically represented by symbols such as US30, DJ30, or DOW30. These symbols may vary slightly depending on each broker’s naming convention, but they all refer to the same underlying asset: the Dow Jones Industrial Average.
At present, the Aron Groups Broker displays the Dow Jones index on MetaTrader 5 (MT5) under the symbol DJIUSD.
Dow Jones Symbol on TradingView and MetaTrader
On TradingView, the Dow Jones can be viewed in two forms:
- The official stock market index, shown under symbols such as DJI or DJIA, reflects data from U.S. exchanges.
- As CFDs are offered by individual brokers, usually (but not always) under the symbol US30.
To view the Dow Jones chart for a specific broker on TradingView, click on that broker’s name, and the platform will open the corresponding CFD chart. These broker-linked CFDs may differ slightly from the actual index price due to differences in data sources and trading conditions.
On MetaTrader (MT4 or MT5), the Dow Jones is also available under similar symbols such as US30, DJ30, or DOW30, depending on the broker. For instance, in the Aron Groups Broker, the Dow Jones index symbol on MetaTrader 5 is DJIUSD.
Key Difference Between TradingView and MetaTrader
The primary difference between the two platforms lies in how price data is displayed:
- TradingView aggregates analytical or market data from multiple sources and presents it transparently for analysis.
- MetaTrader, on the other hand, shows real-time tradable prices provided directly by the broker.
This means TradingView is generally better suited for market analysis, while MetaTrader remains the leading platform for executing live trades.
Difference Between CFD and ETF Trading on the Dow Jones
Trading the Dow Jones Industrial Average (DJIA) can be done through CFDs (Contracts for Difference) or ETFs (Exchange-Traded Funds), two distinct approaches with their own characteristics.
In CFD trading, the trader does not own the underlying asset; instead, they speculate on the price movements of the index and can profit from both rising and falling markets. CFDs are typically offered with high leverage, making them suitable for short-term or day trading strategies.
In contrast, Dow Jones ETFs, such as the SPDR Dow Jones Industrial Average ETF (ticker: DIA), represent actual ownership of shares in a fund that tracks the index. ETFs usually have lower fees but offer less flexibility with leverage or short selling. As a result, they are more appropriate for medium to long-term investment horizons.
The choice between CFDs and ETFs ultimately depends on the trader’s goals, trading style, and risk tolerance.
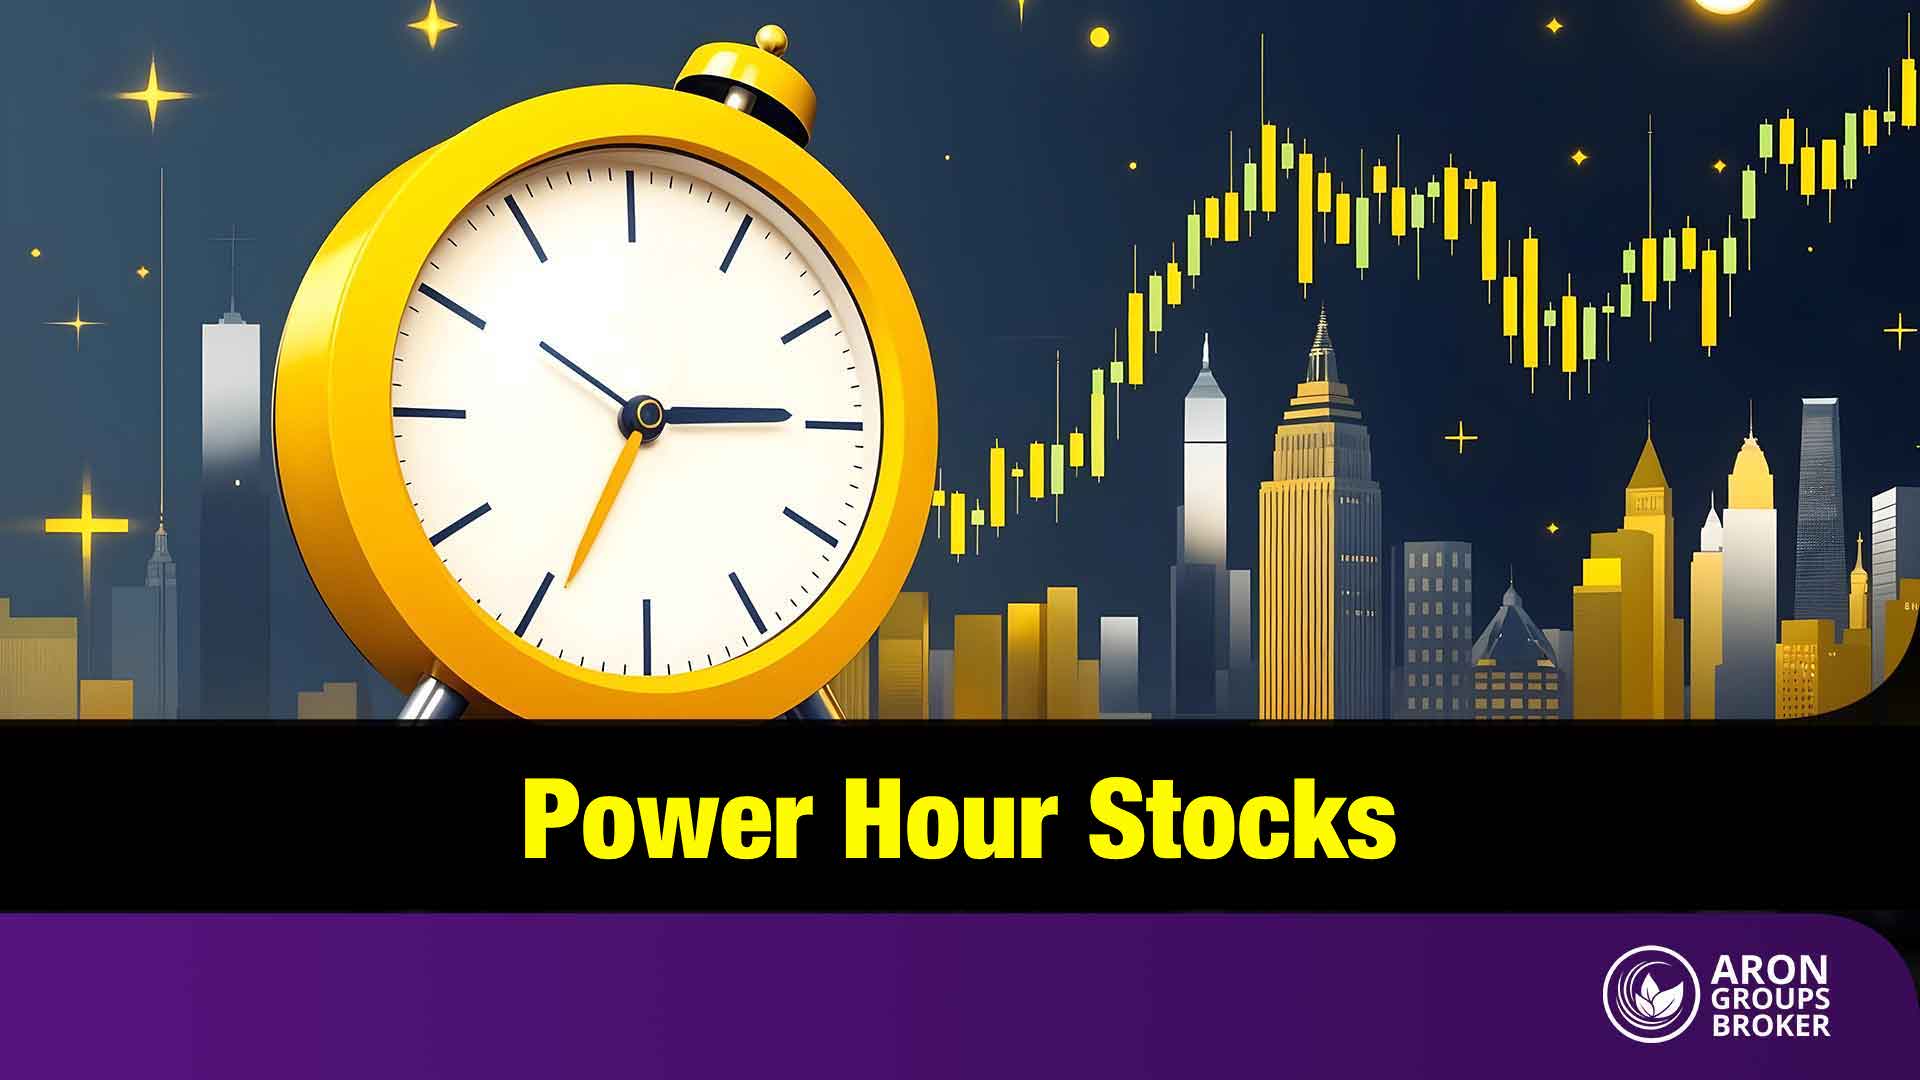
Best Time to Trade the Dow Jones for Iranian Traders
The ideal time for Iranian traders to trade the Dow Jones begins with the opening of the New York Stock Exchange (NYSE). This trading window typically runs from 3:30 PM to 12:30 AM (Iran time) during summer and from 4:30 PM to 1:30 AM in winter.
During these hours, particularly at the opening and closing sessions, the market experiences the highest volatility and liquidity, offering intense, directional price movements.
In this period, spreads are narrower, and the release of key U.S. economic data significantly impacts the Dow Jones’s price dynamics. The overlap between U.S. trading hours and daytime in Iran provides a strategic advantage, enabling traders to capitalize on high-volatility periods and implement more profitable strategies.
Comparison: Dow Jones vs. S&P 500 vs. Nasdaq Composite
The Dow Jones Industrial Average, S&P 500, and Nasdaq Composite are the three major benchmarks of the U.S. stock market, each representing a different aspect of the American economy. Understanding their distinctions helps traders and investors perform more precise analyses and make informed trading decisions.
The following table summarizes the key differences among these major indices:
| Feature | Dow Jones (DJIA) | S&P 500 | Nasdaq Composite |
|---|---|---|---|
| Number of Companies | 30 | ~500 | 3,000+ |
| Weighting Method | Price-weighted | Market-cap weighted | Market-cap weighted |
| Type of Companies | Large, established blue-chip firms | Broad mix of large-cap companies across industries | Primarily tech-focused and growth-oriented firms |
| Sample Companies | Apple, Coca-Cola, Boeing, McDonald’s | Microsoft, Amazon, JPMorgan, Johnson & Johnson | Apple, Microsoft, Amazon, Alphabet, Nvidia |
| Industry Focus | Industrial (now diversified into tech, healthcare, and finance) | Broad diversification (healthcare, tech, financials, industrials, consumer goods, etc.) | Technology, biotech, fintech, startups |
| Selection Criteria | Brand reputation, financial stability, market leadership | Market cap, liquidity, profitability | Listed on the Nasdaq, mainly startup and tech firms |
| Volatility Level | Lower (more conservative) | Moderate (represents overall market balance) | Higher (riskier due to tech exposure) |
| Main Purpose | Traditional benchmark for evaluating stable companies | Measure of overall U.S. market health | Gauge of innovation and tech-sector growth |
| Key Advantage | Stability, long history, public recognition | Broad diversification covering 80% of U.S. market cap | Reflects risk appetite and innovation trends |
(Sources: Bankrate, Investopedia)
Among the three, the Dow Jones Industrial Average suits traders seeking stability, the S&P 500 appeals to those preferring broad market coverage, and the Nasdaq Composite is ideal for investors interested in high-growth, technology-driven sectors. Choosing the right index ultimately depends on your trading strategy and risk profile.
Advantages and Disadvantages of Trading the Dow Jones
Like any other financial instrument, trading the Dow Jones Industrial Average (DJIA) comes with its own benefits and drawbacks. The table below provides a comparative overview:
| Advantages | Disadvantages |
|---|---|
| High volatility: Offers multiple opportunities for short-term and swing trading. | Strong reaction to news: Highly sensitive to economic and political developments, especially those related to the U.S. economy. |
| High analyzability: Both technical and fundamental analysis can be effectively applied to forecast price movements. | Risk management required: Due to high volatility, precise risk management and the use of protective strategies are essential. |
| High liquidity: Large trading volumes and tight spreads across many brokers. | Higher capital requirement: Effective use of volatility may require larger initial capital. |
| Easy accessibility: Tradable as a CFD in most reputable forex brokers. | Complex market analysis: Requires deep understanding of economic data and market dynamics. |
In summary, the Dow Jones Industrial Average can be a suitable instrument for experienced traders who can manage risk and analyze market behavior. However, beginner traders are advised to start with lower-risk assets before moving on to Dow Jones trading.
Key News Events That Affect the Dow Jones
The Dow Jones Index is highly sensitive to economic and political news. Major events that can cause sharp market movements include key U.S. economic indicators such as the unemployment rate, inflation data, Non-Farm Payrolls (NFP), and Gross Domestic Product (GDP) reports.
Additionally, Federal Reserve decisions and speeches by Fed officials, especially the Chair’s comments on interest rates and monetary policy, directly affect investor sentiment and, consequently, the Dow Jones Industrial Average.
Beyond macroeconomic data, corporate earnings reports from Dow Jones-listed companies can also move the index significantly. Earnings that beat or miss expectations often lead to individual stock rallies or declines, which in turn influence the overall index level.
Other global factors, such as geopolitical tensions, trade disputes (particularly with major economies like China), and unexpected global events such as wars, sanctions, or financial crises, also play a significant role in driving Dow Jones volatility.
For professional traders, continuously monitoring these developments and understanding their impact is a crucial part of the technical and fundamental analysis of the Dow Jones.
Best Trading Strategies for the Dow Jones
Trading the Dow Jones requires a firm grasp of market dynamics, technical indicators, and risk management techniques. One of the most effective methods is the Range Breakout Strategy, especially during high-volatility periods such as the New York session open, when trading volumes and price momentum increase sharply.
Another proven method is the Trend-Following Strategy using Exponential Moving Averages (EMA), typically the 20-period and 50-period EMAs, which helps traders identify precise entry and exit points in trending markets.
Additionally, reversal candlestick patterns such as Inside Bars and Pin Bars, when identified in supply and demand zones on 15-minute to 1-hour timeframes, can signal potential trend reversals and high-probability trade setups.
Incorporating intermarket analysis, such as studying correlations between the Dow Jones, the U.S. Dollar Index (DXY), the Nasdaq Composite, and U.S. Treasury yields, can further enhance analytical accuracy and strategic timing.
Conclusion
The Dow Jones is far more than just a statistical index; it is a barometer of U.S. economic health and a leading global market indicator. Understanding its trends and volatility enables both investors and traders to anticipate market direction and identify profitable opportunities.
For Wall Street investors as well as forex traders, mastering the Dow Jones is not merely an advantage; it is a strategic necessity for success in today’s volatile financial markets.
FAQ
What is the Dow Jones symbol in MetaTrader, and how can I find it?
On the MetaTrader 4 and MetaTrader 5 platforms, the Dow Jones Index symbol varies by broker. The most common symbols include:
- US30
- DJI
- DJ30
- DOW
- WALLST30
- YM
- DOWUSD
Note that some brokers may only make this symbol available on specific account types (such as ECN or Pro accounts). If you can’t locate the symbol, contact your broker’s support team or check your account settings.
Which is better to trade, Dow Jones or Nasdaq? Which is more suitable for scalping?
The Nasdaq Composite (NASDAQ Composite) tends to be more volatile than the Dow Jones Industrial Average because it focuses heavily on high-growth technology companies. This higher volatility makes Nasdaq more attractive for short-term and day traders seeking quick price movements.
In contrast, the Dow Jones Industrial Average is more stable and represents large, well-established corporations, making it a better choice for the long term. These conservative investors prioritize consistency over rapid gains.
What is the difference between the Dow Jones and other major indices?
The primary difference between the Dow Jones, S&P 500, and Nasdaq Composite lies in their weighting methodology and number of constituent companies.
- The Dow Jones Industrial Average (DJIA) includes only 30 companies and is price-weighted, meaning stocks with higher prices have more influence on the index’s movement.
- The S&P 500, on the other hand, tracks around 500 companies and is market-cap weighted, so larger companies by market value carry more weight.
Therefore, the Dow Jones provides a more concentrated view of the performance of large, established blue-chip companies, while indices like the S&P 500 and Nasdaq Composite offer a broader representation of the U.S. stock market.