


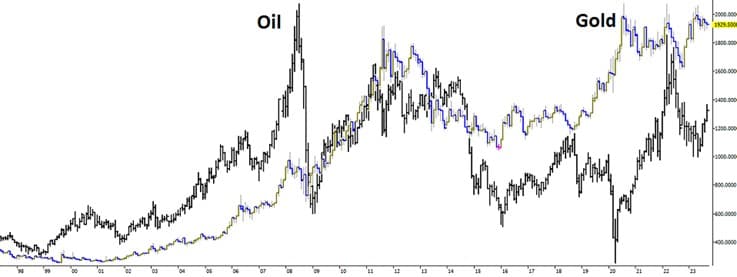
Gold and oil have historically shown periods of strong correlation, especially during major inflationary cycles like the 1970s, 2000s, and post-2009. Yet they do not always move together, and at times their trends diverge sharply. This raises a key question for traders: what truly drives the gold–oil relationship?
Some believe oil leads gold, while others argue the opposite. Charts show that leadership shifts over time, making relative performance, not individual price moves, the more reliable lens for analysis.
Although inflation can push both markets higher, it is not the primary driver of their long-term behaviour. The deeper driver is the strength or weakness of the US dollar, which ultimately shapes the broader gold–oil dynamic in the forex market.

- Gold and oil often move in the same direction, but not always at the same speed or magnitude.
- Inflation and the value of the US dollar are the main macro forces linking both commodities.
- Oil can appear to “lead” gold during inflationary periods, but the dollar is usually the true driver.
- Gold behaves more like a monetary asset, while oil is a highly reactive commodity tied to supply and demand.
Introduction to the Gold–Oil Relationship
When inflation rises and purchasing power declines, more dollars are required to buy the same amount of oil and gold. Inflation rather than oil itself is what ultimately pushes gold higher. This means US monetary policy has an outsized influence on both commodities.
Supporters of the “oil leads gold” argument often arrive at a similar endpoint. Both markets sit at the centre of global economic activity, so broad shifts in supply and demand tend to move them in the same direction.
Gold can be analysed within broader commodity indices such as the CRB. However, it behaves more like a monetary asset than an industrial one. Its global role as a store of value makes it far more stable than oil, which is naturally more volatile.
At this point, it helps to separate their roles:
- Gold functions as a monetary asset, similar to safe-haven currencies such as the US dollar, Japanese yen, and Swiss franc.
- Oil functions as an industrial commodity, reacting quickly to supply–demand changes in the energy sector.
- Gold responds to long-term inflation expectations, while oil reacts to short-term production, geopolitical, and inventory shocks.
Gold is primarily used to preserve value during inflation and uncertainty. Oil, while essential to economic production, does not benefit from the same long-term store-of-value demand. This is why gold has historically shown greater stability than oil.
Is There a Relationship Between Gold and Oil?
Research published in Energy Research Letters shows that in more than 80% of analysed periods, gold and oil exhibit a strong positive correlation. Over time, both respond similarly to economic cycles, geopolitical tensions, fluctuations in the US dollar, inflation, and interest rate expectations.
During financial crises, however, the pattern shifts. Although they may move in the same direction, their magnitudes differ. Oil tends to swing more sharply because commodity markets adjust immediately to supply disruptions or rapid changes in demand. Gold moves more gradually, reflecting its role as a long-term store of value.
The drivers of divergence include:
- Oil is highly sensitive to short-term shocks, such as supply cuts, inventory shifts, weather disruptions, and geopolitical risks.
- Gold’s reliance on long-term capital flows is supported by its deep reserves, broad liquidity, and steady buying from countries such as China, India, and Russia.
- Oil’s industrial demand vs. gold’s safe-haven demand, which reacts differently to economic stress.
These structural differences explain why oil consistently represents the more volatile side of the relationship, while gold acts as the stabilising asset.
Key Mechanisms Behind the Gold-Oil Relationship: Why Are These Two Commodities Connected?
Gold and oil, two of the most influential assets in the global economy, often move in similar or interconnected ways. But what drives this correlation? This section explores two fundamental mechanisms that explain why these commodities frequently rise or fall together.
The Role of Inflation in Linking Oil and Gold
Higher oil prices directly increase global production, transportation, and energy costs. This creates inflationary pressure: purchasing power declines and the overall price level rises.
In inflationary periods, investors look for assets that preserve value. Gold is widely regarded as a safe, inflation-resistant asset. As oil prices climb and inflation rises, demand for gold increases, lifting its price.
In simple terms:
Oil price increases → Higher inflation → Stronger demand for gold
Learn More: What factors affect gold prices?
The Role of the US Dollar as the Base Currency
Both gold and oil are priced in US dollars on global markets. As a result, fluctuations in the dollar’s value can influence both assets simultaneously.
- When the dollar weakens:
- International buyers with stronger local currencies can purchase gold and oil more cheaply. Demand rises, and prices for both commodities tend to increase.
- When the dollar strengthens:
- Gold and oil become more expensive for non-US buyers. Demand falls, and prices often move lower.
The strength or weakness of the US dollar is therefore one of the key drivers behind the convergence or divergence of gold and oil prices in global markets.
How to Use the Gold-Oil Relationship in Forex Trading
Understanding the correlation between gold and oil gives Forex traders a valuable intermarket perspective. This relationship is especially useful when movements in one market provide early signals about potential trends in the other.
1. Using Oil Prices as a Leading Indicator
Rising oil prices typically increase global production and transportation costs, creating inflationary pressure. Higher inflation often boosts demand for safe-haven assets such as gold. For this reason, a sharp rise in oil can serve as an early warning that gold may enter an uptrend in the coming weeks or months.
Example:
Suppose Brent crude oil has climbed from USD 75 to USD 85 per barrel over the past two weeks. During the same period, economic data shows rising inflation in the US and Europe. A trader may interpret this as a leading signal and look for buying opportunities (long positions) in XAU/USD, anticipating that gold will strengthen in response to inflation concerns.

To validate this signal, traders should also monitor the US Dollar Index (DXY) and US Treasury yields, as a stronger dollar or higher interest rates can offset the expected upward move in gold.
2. Pairs Trading Strategy Between Gold and Oil
Another practical way to apply the gold–oil relationship in Forex is through pairs trading. This strategy uses the historical correlation between the two assets and is applied when that correlation temporarily breaks down. In such moments, traders expect prices to return to their historical equilibrium and seek to profit from this realignment.
Example:
Assume that oil has rallied sharply over a given period, while gold has remained almost unchanged. Since the two assets show a positive correlation in roughly 85% of observed periods, traders may consider the divergence temporary. In this scenario:
- The trader takes a long position on gold, expecting it to rise to catch up.
- At the same time, the trader shorts oil, anticipating that the recent surge may correct toward its historical average.
When gold and oil eventually return to their typical correlation, whether gold rises, oil pulls back, or both adjust, the trader can potentially profit from both positions.
This strategy is especially useful for traders who rely on intermarket analysis and relative asset behaviour. It provides an effective tool for both risk management and opportunity generation.
The Impact of Economic Cycles (Recession and Expansion) on the Gold–Oil Relationship
Economic cycles play a significant role in shaping the relationship between gold and oil. During periods of recession, demand for industrial commodities such as oil declines as manufacturing activity, transportation volumes, and consumer spending weaken. In contrast, gold attracts increased attention as a safe-haven asset, since it is viewed as a reliable store of value during times of economic instability.
As a result, the usual positive correlation between gold and oil may weaken or even turn negative during recessions: gold tends to rise while oil falls. Conversely, during economic expansions, when energy demand grows and inflation expectations increase, both commodities may experience simultaneous price gains.
These shifts in the correlation between gold and oil are typically temporary and arise from a mix of behavioural and fundamental investor responses within each phase of the economic cycle.
The Gold–Oil–Dollar Triangle: A Three-Way Relationship
The interaction between gold, oil, and the US dollar carries exceptional importance because each of these variables plays a central role in the global economy. A shift in any one of them can trigger chain reactions in the other two.
Mechanisms of Mutual Influence
Gold, oil, and the dollar are interconnected through economic, political, and financial dependencies. Their relationship is shaped through several key channels:
- The US dollar as the base currency:
Both gold and oil are priced in US dollars. Any change in the dollar’s value directly affects the price of these assets. - Inflation and inflation expectations:
Rising oil prices tend to generate inflation, which increases demand for gold as an inflation hedge. - Global supply and demand:
Shifts in the supply or demand for oil or gold influence their prices and can indirectly affect the dollar’s value.
To illustrate this three-way interaction, the following scenarios show how a change in one variable can influence the other two.
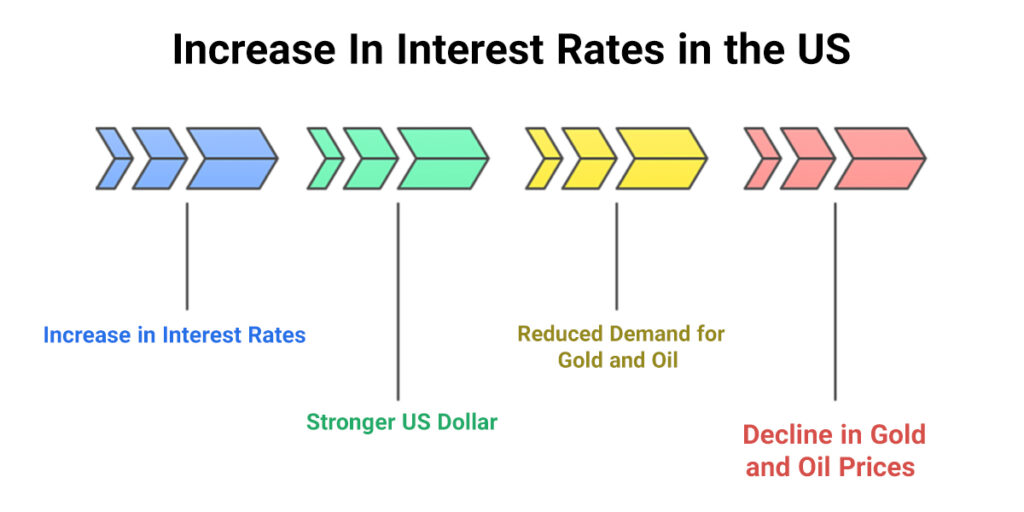
Scenario 1: Higher Interest Rates in the United States
Impact: Stronger dollar → Lower gold and oil prices
When the Federal Reserve raises interest rates, the dollar typically strengthens because investors seek higher returns on dollar-denominated assets. As the dollar appreciates, demand for gold and oil, which are priced in USD, declines, putting downward pressure on both prices.
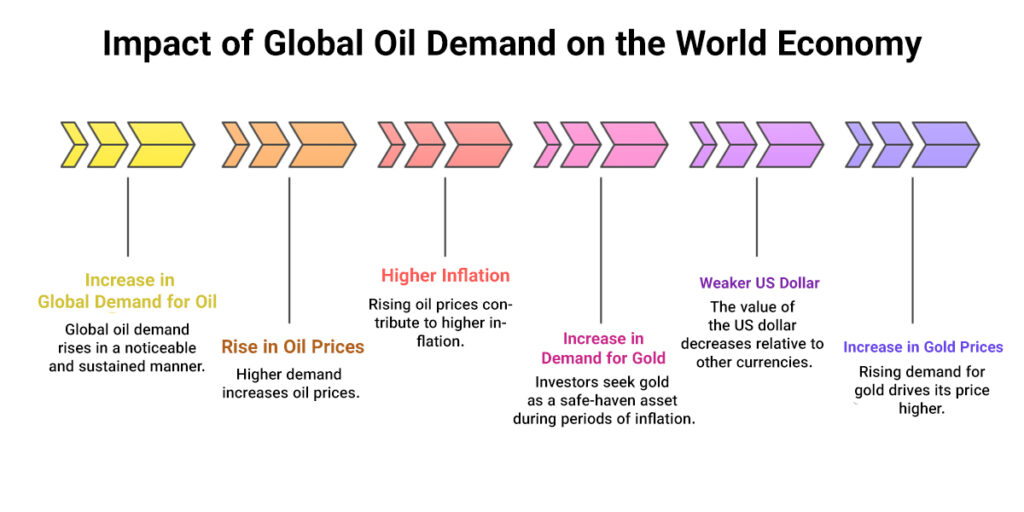
Scenario 2: Rising Global Demand for Oil
Impact: Higher oil prices → Higher inflation → Higher gold prices
An increase in global oil demand, whether due to economic expansion or geopolitical tensions, drives oil prices higher. This raises production and transportation costs and fuels inflation. As inflation rises, demand for gold as an inflation-resistant asset increases, lifting its price.
In this scenario, the US dollar may weaken because higher inflation erodes its real value.
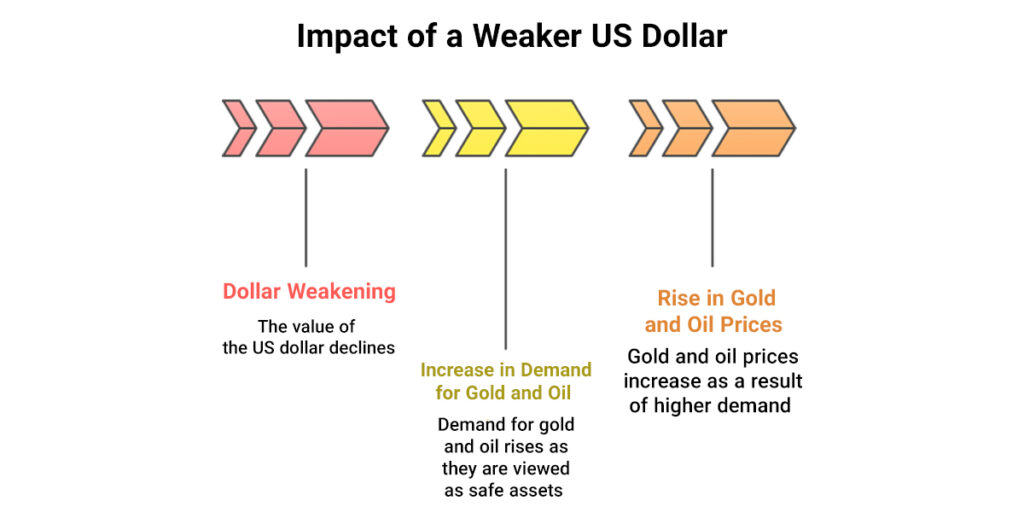
Scenario 3: A Weaker US Dollar
Impact: Higher gold and oil prices
When the dollar loses value due to expansionary monetary policy or lower interest rates, gold and oil become cheaper for holders of stronger foreign currencies. This encourages additional buying and pushes the prices of both commodities higher.
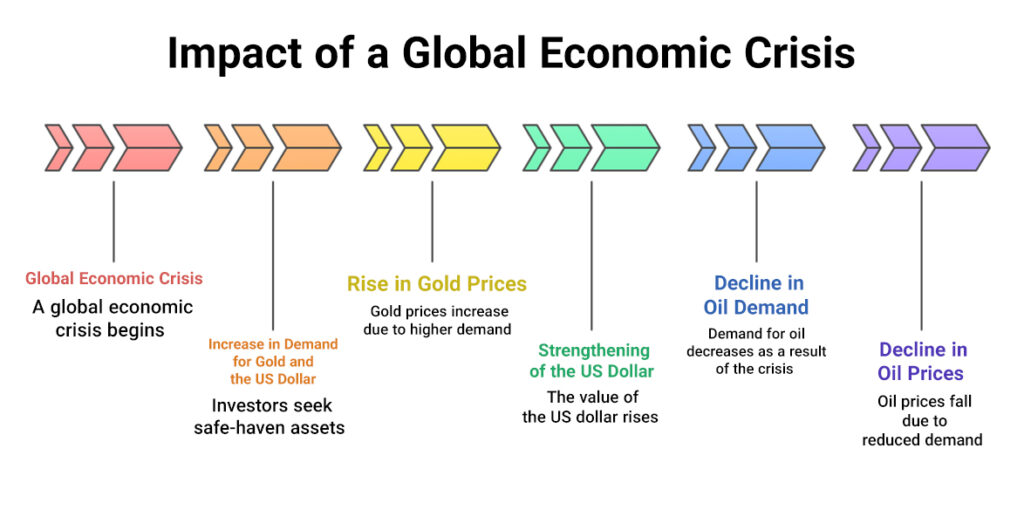
Scenario 4: A Global Economic Crisis
Impact: Higher gold + Lower oil + Stronger dollar
During global crises, investors move toward safe-haven assets such as gold and the US dollar. This drives both higher. Meanwhile, demand for oil declines as industrial activity, transportation, and energy consumption fall, driving down oil prices.
Multiple factors, including monetary policy, inflation, global supply and demand, and overall economic conditions, shape the three-way relationship between gold, oil, and the US dollar. The schematic diagrams above illustrate how changes in any one of these variables can create chain reactions across the other two. By understanding these interactions and using tools such as the gold-to-oil ratio, traders and analysts can make more informed decisions in financial markets.
Impact of the Weekly US Crude Oil Inventory Report (EIA)
The Weekly Crude Oil Inventory Report published by the US Energy Information Administration (EIA) is one of the most influential economic data releases affecting the oil market. The report indicates whether US crude oil inventories are rising or falling.
- When inventories decline:
This signals stronger demand or reduced supply and can push oil prices higher. - When inventories rise:
This usually reflects weaker demand or excess supply and places downward pressure on oil prices.
Because oil is a key input in inflation calculations, fluctuations in its price can indirectly influence gold as well. For example, rising oil prices may strengthen inflation expectations and push investors toward assets such as gold.
This report offers analytical value not only for energy-market specialists but also for gold traders.
Gold/Oil Ratio: How to Use This Tool in Market Analysis
One powerful tool in intermarket analysis is the Gold/Oil Ratio, which helps determine whether gold or oil is relatively expensive or undervalued compared with its historical norms.
How to Calculate the Gold/Oil Ratio
To compute the ratio, simply divide the price of one ounce of gold by the price of one barrel of crude oil:
Formula:
Gold/Oil Ratio = Price of Gold per Ounce ÷ Price of Crude Oil per Barrel
Example:
If gold is trading at USD 2,100 and oil is USD 70 per barrel:
2100 ÷ 70 = 30
This means you would need the equivalent value of 30 barrels of oil to buy one ounce of gold.
Interpreting Different Gold/Oil Ratio Levels
| Ratio Level | Practical Interpretation |
|---|---|
| Below 15 | Oil is relatively expensive, or gold is cheap; the opposite is typical in periods of economic expansion or strong energy demand. |
| 15–20 | The historical equilibrium zone indicates a relative alignment between gold and oil prices. |
| Above 20 | Gold is relatively expensive, or oil is very cheap; this often occurs during recessions, crises, or periods of weak energy demand. |
Historical Note:
During the COVID-19 crisis, the Gold/Oil Ratio surged above 40, as oil fell below USD 20 and gold traded above USD 1,600. Such extreme levels reflected severe economic dislocation.
Why the Gold/Oil Ratio Matters
The ratio is useful for both macro analysts and Forex/CFD traders because it:
- Helps identify potential price bubbles in either asset.
- Reveals market expectations regarding inflation or recession.
- Provides an intermarket perspective for blending technical and fundamental analysis.
Technical Use of the Gold/Oil Ratio
You can chart this ratio directly on some platforms (such as TradingView) using:
GOLD/USD ÷ OIL/USD
On platforms like Dynamic Trader or MetaTrader, you can build the chart using scripts or custom indicators.
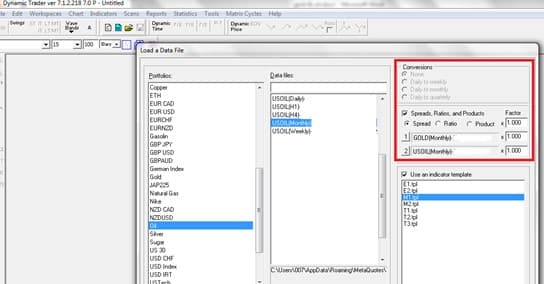
How to Calculate and View the Gold/Oil Ratio in Dynamic Trader
To analyse the Gold/Oil Ratio in practice, Dynamic Trader allows you to create the ratio chart directly. Here are the steps:
Steps:
- From File > Load a Data File, load the data for crude oil (e.g., USOIL.Monthly+) and then gold (e.g., GOLD.Monthly+).
- Under Conversion, enable Spreads, Ratios, and Products.
- In the Ratio section, set gold as the numerator and oil as the denominator.
- The Gold/Oil Ratio chart will now be displayed.
Using the Gold/Oil Ratio in Trading
One practical application of the Gold/Oil Ratio is identifying extreme levels and trading the expected mean reversion. Below is a real historical example:
In April 2020, during the peak of the COVID-19 crisis, the ratio surged above 90, meaning one ounce of gold was worth more than 90 barrels of WTI crude oil.
This was far beyond the normal historical range of 10-30, and even higher than levels seen during the Great Depression in the 1930s.
Trading Scenario:
When the ratio reaches unusually high levels (e.g., above 40 or even near 90), this often signals a severe divergence between gold and oil and increases the likelihood of a return to normal ranges.
In such cases, a trader may consider:
- Short gold (Sell XAU);
- Or go long WTI crude oil (Buy Oil).
If the ratio returns to its historical average (e.g., between 30 and 40) in subsequent months, the trader may capture significant profit.
Conclusion
The gold-oil relationship reflects broader macro forces rather than a simple cause-and-effect link. When viewed through inflation, monetary policy, energy demand, and the strength of the US dollar, their movements become far easier to interpret.
For traders, this connection provides a practical framework for spotting shifts in market sentiment and improving decision-making, especially when combined with intermarket analysis and tools like the Gold/Oil Ratio.