


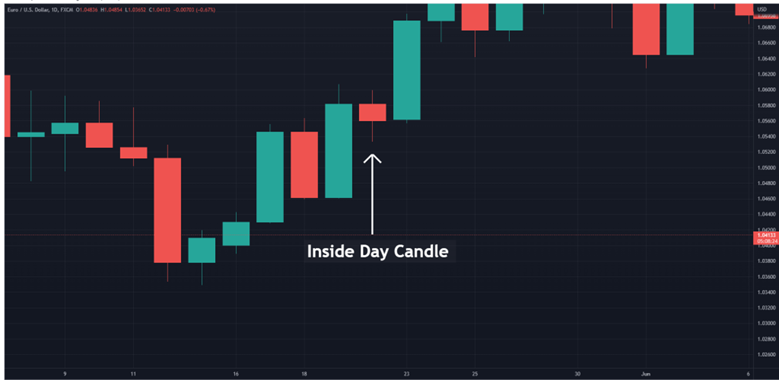
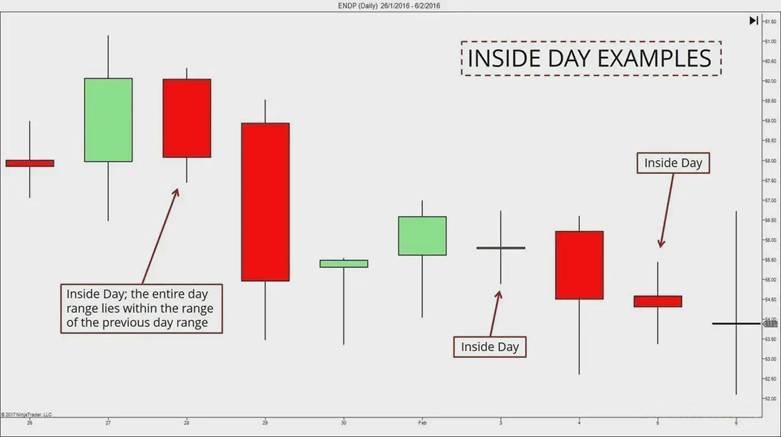
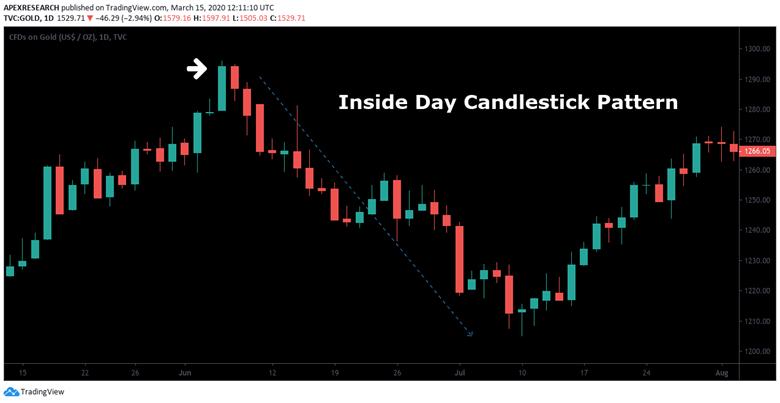
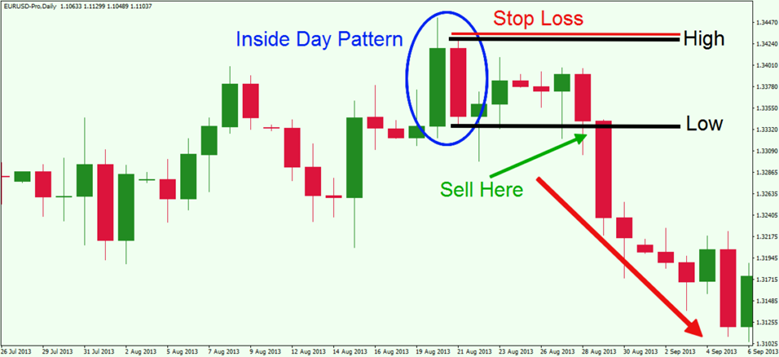
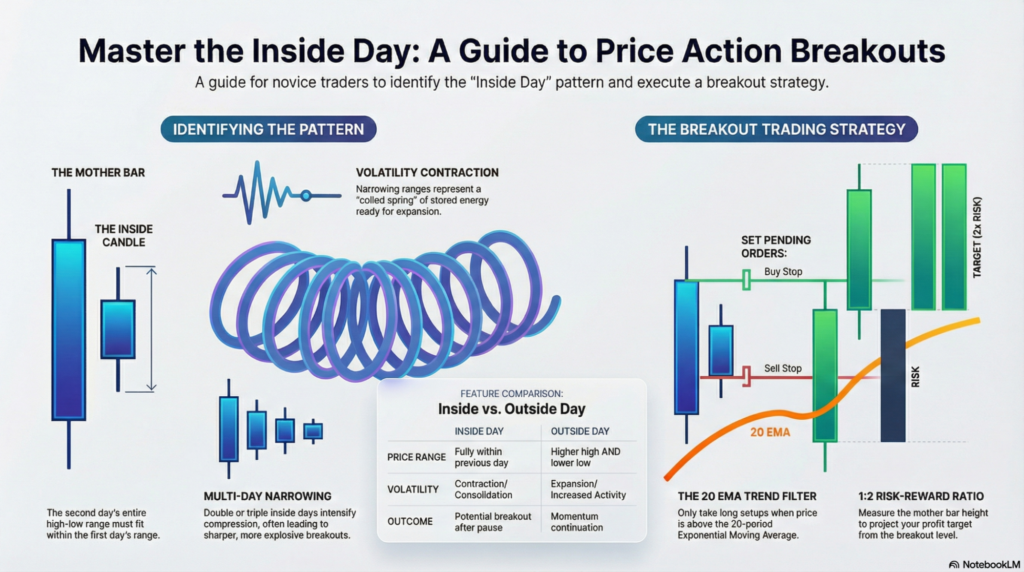
Inside days are simple chart patterns that even complete beginners can spot easily. They happen when today’s price stays completely inside yesterday’s range, creating a smaller inside day candle.
This pause often means the market is gathering energy for its next move – either up or down. Inside day trading is straightforward, visual, and popular because it gives clear signals without complicated maths.
Whether you’re just curious about trading or ready to practise, stay with Aron Groups. We’ll explain everything step by step with examples, tips, and practical ideas to help you understand this useful strategy.

- Inside days signal volatility contraction, often preceding strong breakouts in forex markets.
- Trade breakouts with confirmation, such as candle closes beyond the mother bar range.
- Use trend filters like the 20 EMA to favour continuation over reversal setups.
- Prioritise risk management: limit exposure and practise on demo accounts first.
Getting to Know Inside Days
Technical analysis often highlights inside days as a straightforward yet insightful price action pattern. Traders use them to spot periods of consolidation. These patterns reveal market indecision and frequently precede significant moves.
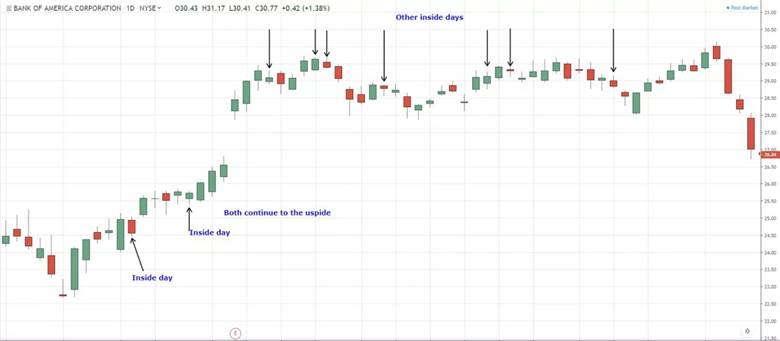
According to Investopedia, “An inside day occurs when the high and low range is completely within the previous day’s range.”
In fact, this inside day meaning points to temporary balance in the market.
How Inside Day Candles Really Form on the Chart
Traders identify inside days easily with these steps:
- Examine two consecutive daily candles.
- Confirm the second day’s high stays below the first day’s high.
- Ensure the second day’s low stays above the first day’s low.
- Note that the open and close prices of the second day fall within the prior range.
This formation highlights volatility contraction. The market trades in a tighter space.

Key Insight:
An inside day differs from a regular small candle because its entire range – not just the body – must fit inside the mother bar. This strict rule signals true consolidation.
Why Inside Days Happen: Understanding Market Psychology
Inside days reflect indecision between buyers and sellers. Neither side dominates clearly. Traders often take profits after strong moves. Others wait for upcoming news or data releases.
This pause creates balance. It builds pressure for the next directional push. Many sources link inside days to volatility contraction before expansion.
Volatility contraction frequently precedes breakout movement, though direction remains uncertain.
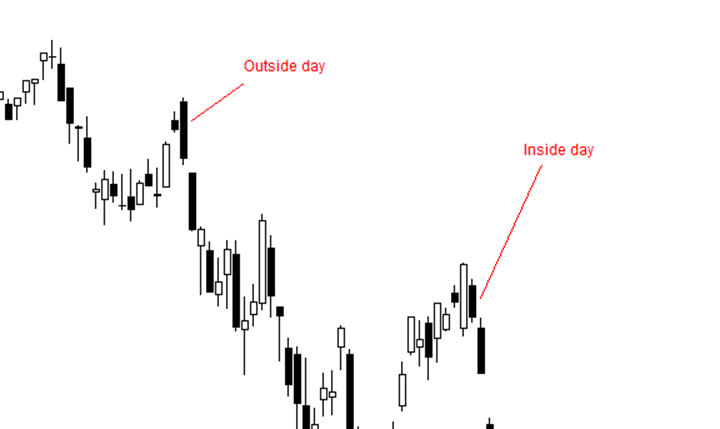
Inside Day vs Outside Day: Spotting the Crucial Differences
The inside day vs outside day comparison helps traders understand volatility behaviour. An outside day expands beyond the previous range, showing aggressive momentum.
| Aspect | Inside Day | Outside Day |
|---|---|---|
| Price Range | Fully within the previous day's range | Higher high and lower low than the previous |
| Volatility Implication | Contraction and consolidation | Expansion and increased activity |
| Typical Outcome | Potential breakout after pause | Continuation of strong momentum |
According to MarketBeat, inside day vs outside day patterns show contrasting market energy levels.
Q: What makes an inside day different from a regular small candle?
A: A regular small candle may have a tight range. Yet its high or low can exceed the previous day’s extremes.
An inside day requires the full range to stay inside the mother bar. This stricter condition better captures market hesitation and sets up clearer breakout signals.
Note:
Traders often confuse small-range candles with inside days. Always compare the full high–low range to the previous candle before marking the pattern.
Types of Inside Day Patterns
Inside day patterns vary based on market context and the number of consecutive days. Through candlestick analysis, traders classify them as bullish, bearish, or neutral. Multiple inside days often tighten ranges further. This increases the likelihood of a strong breakout due to built-up pressure.
Bullish Inside Day
A bullish inside day candle pattern typically forms during an uptrend or after a pullback. The inside candle shows a higher close relative to its open. Buyers maintain control despite the smaller range.
Price often breaks above the mother bar’s high. This confirms continuation higher. Traders favour this setup in established uptrends. It offers defined risk below the inside day’s low.
Bullish inside days gain reliability when followed by upward breaks in rising markets.
In this scenario:
- The prior trend is upward.
- The mother candle is often strong and bullish.
- The breakout above the mother bar’s high confirms continuation.
Bearish Inside Day
A bearish inside day candle pattern emerges in downtrends. The inside candle frequently closes lower. Sellers remain dominant during consolidation.
A break below the mother bar’s low signals potential downside acceleration. This pattern warns of resumed selling pressure. Stop-loss placement above the inside high protects entries. Context matters greatly. Prior downtrend strengthens bearish bias.
Key characteristics include:
- A dominant downward move before formation.
- A contained range within the prior bearish candle.
- Breakout below the mother bar confirming downside continuation.
Neutral Inside Days
Most single inside days stay neutral. The candle lacks a strong directional close. Price consolidates without committing to bulls or bears. These act as a breathing room. The prevailing trend often resumes after the pause.
According to some sources, neutral inside setups require additional confirmation, like volume or support levels for trades.
They highlight temporary equilibrium. Breakout direction decides the next move.
In this case:
- Buyers and sellers reach a temporary equilibrium.
- The breakout direction remains uncertain.
- Volume and volatility often decline during formation.
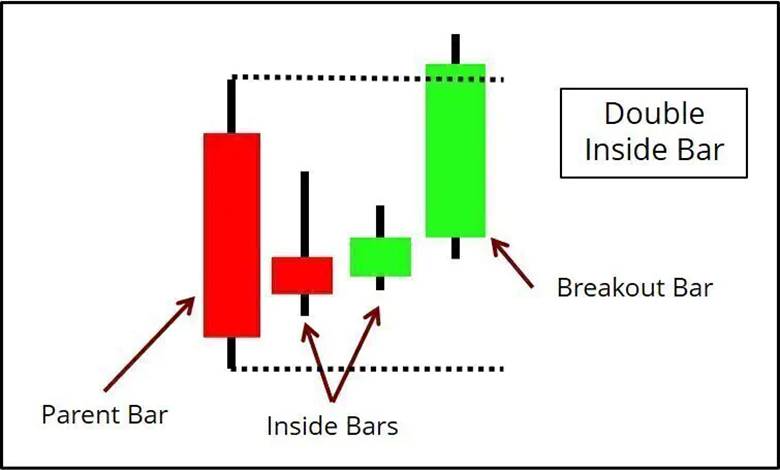
Double Inside Day
A double inside day features two consecutive inside days. The second day’s range nests fully within the first.
This progressive narrowing intensifies compression. Breakouts tend to be sharper than from single inside days.
- Even tighter consolidation zone.
- Improved risk-reward on breakout entries.
- Useful in both trends and ranges.
Traders place pending orders outside the outermost range.
Triple Inside Day & The Famous Three Japanese Candles
A triple inside day shows three successive narrowing inside days. Each range contracts inside the previous.
Did You Know?
Triple inside days often precede stronger breakouts due to extended compression and released energy.
This structure links to Japanese candlestick reversals. The “three inside up” is bullish: long bearish candle, smaller bullish inside (harami), then strong bullish confirmation. The “three inside down” mirrors bearishly.
Tip:
The more candles compressed within a mother bar, the greater the potential energy released during breakout. However, false breakouts remain possible.
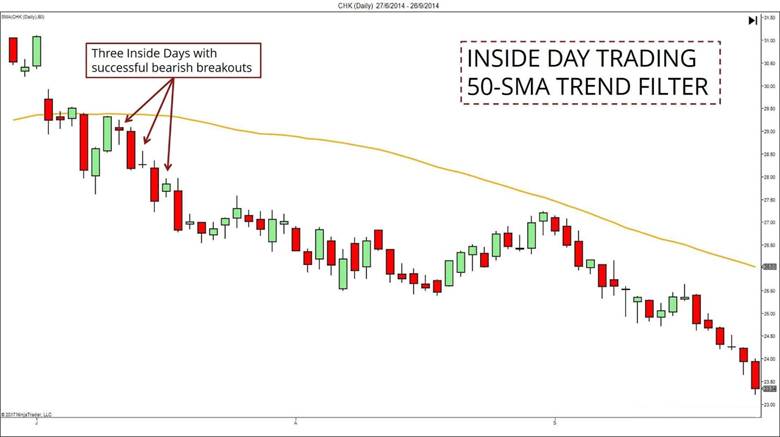
How the Market Behaves Around Inside Days
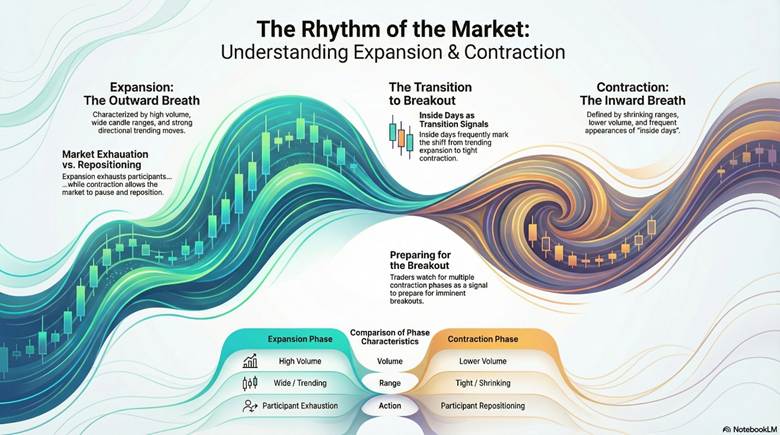
Markets constantly cycle between periods of high activity and quiet consolidation. Inside days highlight clear volatility contraction phases. Price ranges narrow significantly. This creates stored energy. Traders anticipate expansion next. Understanding these behaviours improves timing for entries and exits.
Expansion and Contraction Cycles in Price Action
Price action follows natural rhythms. Strong trends produce expansion. Candles show wide ranges and directional momentum.
Contraction phases follow. Ranges shrink. Inside days appear frequently here.
These cycles reflect market breathing. Expansion exhausts participants. Contraction allows repositioning.
- Expansion: High volume, trending moves.
- Contraction: Lower volume, tighter ranges.
- Transition: Often marked by inside days.
Traders use this knowledge. They prepare for breakouts after multiple contractions.
According to Blueberry Markets, contraction periods like inside days build tension before directional resolutions.
Volatility Squeezes: When the Market Holds Its Breath
Volatility squeezes develop when price movement slows dramatically. Daily ranges become very small.
Bollinger Bands narrow tightly around price. The middle line acts as a moving average. Outer bands measure standard deviations.
This squeeze signals impending volatility expansion. Direction remains unknown initially.
Inside days often coincide with these conditions. They reinforce the compression signal. Traders watch bandwidth indicators. Low readings confirm squeezes.
More Info:
Volatility squeezes acts like a coiled spring. Prolonged low volatility frequently precedes sharp, trending moves in forex pairs.
Inside Days in Range-Bound Markets: Spotting Potential Breakouts
A range-bound market features price bouncing between clear support and resistance. No strong trend dominates.
Inside days form commonly here. Multiple consecutive ones tighten the range further. This progressive narrowing increases breakout potential. Moves become explosive upon escape.
Traders identify the range boundaries. They place pending orders just outside.
- Watch for volume increase on breakout.
- Confirm with the close beyond the range.
- False breaks remain possible.
Direction often aligns with broader market bias. Patience proves essential in ranges.
According to TradersLog, multiple inside days in ranges improve breakout reliability significantly.
After Big Moves: How Inside Days Can Signal the Next Step
Impulsive moves push the price far too quickly. Exhaustion follows. Inside days often emerge as pauses.
In continuing trends, they resemble flags or pennants. Breakouts resume original direction.
At potential reversals, clusters appear near extremes. They warn of distribution or accumulation.
Context determines interpretation:
- Mid-trend: Likely continuation.
- After an extended run: Higher reversal risk.
- Combine with volume and structure.
Traders assess prior impulse strength. Weaker follow-through suggests reversal. A series of inside days may indicate imminent trend changes, though direction needs confirmation.
Reversals require additional signs. Volume fade, divergence, or extreme levels help identify them. Always wait for breakout confirmation. Use stop-losses. Trading involves substantial risk of loss.
Q: Why do inside days after strong moves often lead to continuation rather than reversal?
A: Continuation proves more common mid-trend. The impulse retains momentum. The inside day offers brief rest.
Warning:
Breakouts after major news events can produce whipsaws. Always assess liquidity and session timing before committing capital.
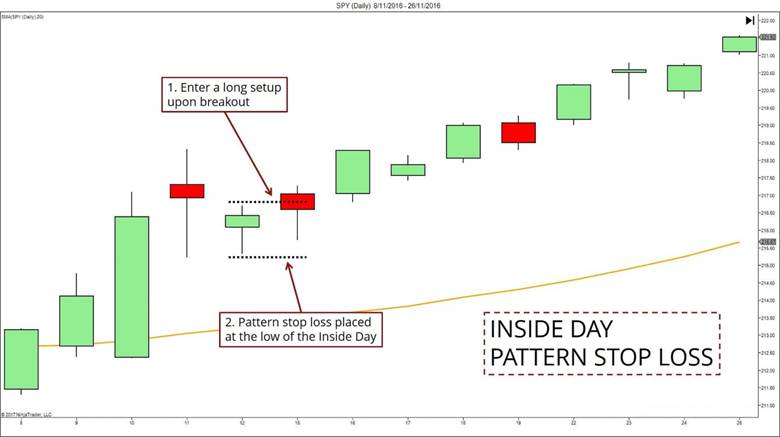
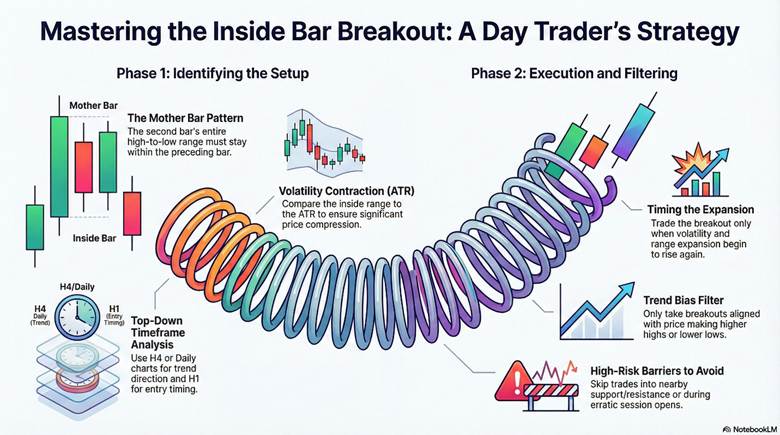
How to Trade Inside Day Breakouts
The inside day breakout strategy stands as one of the most direct ways to trade price action consolidation in forex markets. After a period of tight ranging, the price often explodes in one direction. Traders use pending orders to capture this momentum efficiently. Strict entry rules, breakout confirmation filters, stop-loss placement, and realistic targets define the approach. Risk management remains central. No pattern works every time. Practise extensively on demo accounts before live trading.Step-by-Step Inside Day Trading Guide
If you want to understand how to trade inside day setups effectively, follow a structured execution plan. Follow these expanded steps for consistent application:- Scan charts for a clear inside day formation. Look for the current daily candle fully contained within the previous day’s (mother bar) range.
- Assess broader context. Align with the higher timeframe trend. Check if the inside day follows a strong impulse or appears in a defined range.
- Draw the key levels. Mark the mother bar’s exact high and low. These act as breakout triggers.
- Prepare pending orders. Place a buy stop order 5–10 pips above the high for longs. Set a sell stop below the low for shorts.
- Define risk immediately. Place a stop-loss at the opposite side of the mother bar or at its 50% retracement level for tighter control.
- Set profit targets. Aim for at least 1:2 risk-reward. Measure the mother bar height and project it from the breakout level.
- Monitor execution. Cancel the unfilled order once it triggers. Watch for confirmation signals before adding to positions.
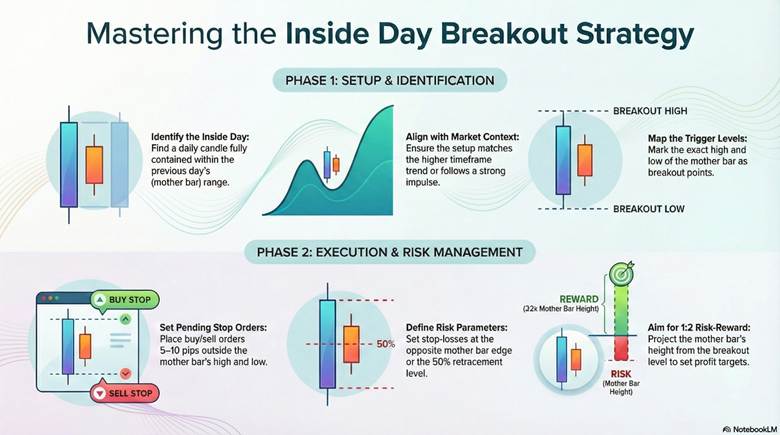
This methodical flow reduces emotional decisions. It focuses on high-probability setups.
Using Pending Orders: Buy Stop & Sell Stop Tricks
Pending orders excel for breakout trading. They allow precise entries without staring at screens constantly.
A buy stop order sits above the mother high. It activates only on upward momentum. This filters weak probes.
A sell stop below the low captures downside breaks similarly.
Advanced tricks include:
- Adding buffers in volatile pairs like GBP/JPY to avoid premature fills from spread or noise.
- Using one-cancels-other (OCO) orders on platforms that support them. This automates risk control.
- Scaling in partially on strong closes beyond the level for better average entries.
Traders appreciate this set-and-forget style. It aligns perfectly with daily timeframe strategies.
Warning:
Pending orders can gap over levels during news events. This leads to slippage. Avoid major economic releases.
How to Confirm a Breakout Before You Jump In
Many breakouts fail quickly. Strong breakout confirmation separates winners from traps.
Essential filters include:
- Waiting for a full candle close beyond the mother bar extreme on the chosen timeframe.
- Observing expanding volume or momentum on the breakout candle.
- Checking alignment with key indicators like a 20-period EMA or higher timeframe structure.
- Watching for retests. Price often pulls back to the broken level before continuing.
Pro Tip:
The "30-Minute Rule" Most false breakouts happen in the first few minutes of a session.
The Fix: Wait for the first 30-minute candle to close outside the Inside Day range.
If it closes back inside? Cancel the trade. It was likely a "Stop Hunt.
Combine multiple signals. A strong close with volume in a trending market offers the highest conviction.
False breaks frequently reverse sharply. Patience here preserves capital.
According to Tradeciety, volume surges on breakouts dramatically improve success rates compared to low-volume moves.
Inside Day Breakout Strategy for Forex Traders
Forex markets follow session-based volatility cycles. Many breakouts occur when liquidity increases. Traders should prioritise major currency pairs with tighter spreads and deeper liquidity.
Risk control remains essential. Proper risk management includes limiting exposure to a small percentage of account equity per trade.
Additionally, choosing the best currency pairs to trade based on volatility and spread conditions can improve execution efficiency.
Q: When Should I Avoid Trading an Inside Day Breakout?
A: You should avoid trading when the overall market structure is clearly range-bound with repeated failed breakouts. Avoid sessions with extremely low liquidity, such as late Asian hours for non-Asian pairs.
Also, skip trades when the risk-to-reward ratio is unfavourable or when major news is scheduled within minutes.
If higher timeframe trends contradict the breakout direction, the probability decreases significantly.
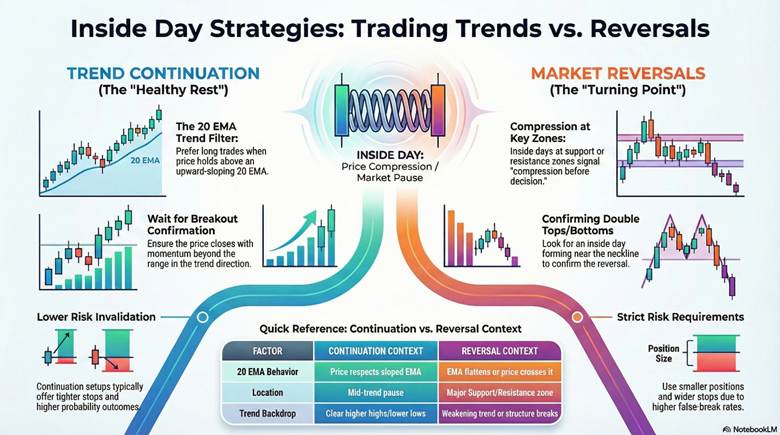
Riding Trends and Spotting Reversals With Inside Days
A well-planned inside day strategy depends on context. The same compression can act as a trend pause or a turning point. To avoid guessing, traders combine inside days with trend filters, key price zones, and classical reversal structures.
This section shows how to separate continuation setups from reversal setups using simple, repeatable rules.
Trading Inside Days in Strong Trends
Inside days often form as brief “rests” inside a healthy trend. They can appear after a strong impulse candle, when traders take profits and new traders wait. If the broader trend remains intact, a breakout in the trend direction is often the higher-probability outcome.
Continuation patterns reflect a temporary interruption in an existing trend, and traders often wait for a breakout as confirmation.
Using the 20 EMA to Filter Inside Day Trades Effectively
A 20-period exponential moving average (20 EMA) is commonly used as a “trend line” that updates quickly. It can help filter trades by direction and reduce random entries.
Practical filter rules:
- Prefer long setups when price holds above the 20 EMA and the EMA slopes upward.
- Prefer short setups when price holds below the 20 EMA and the EMA slopes downward.
- Treat flat EMA conditions as lower conviction.
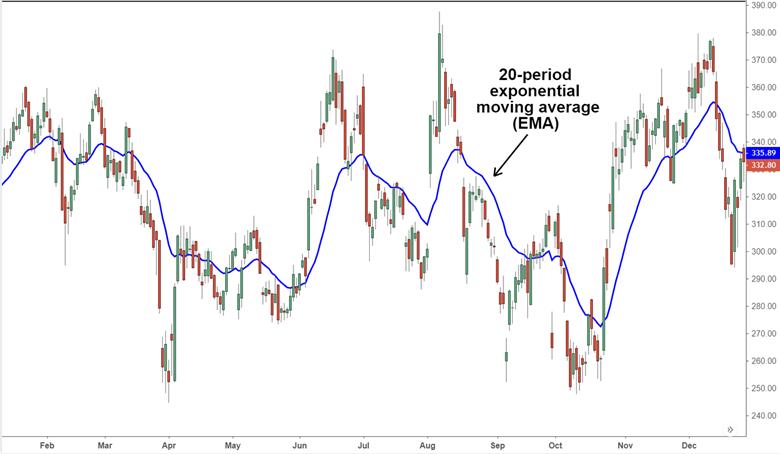
Tip:
Use the 20 EMA as a filter, not a trigger. Wait for a breakout close beyond the range.
Inside Day Pullback vs Continuation
A pullback setup forms when the price retraces into the trend, then compresses. A continuation setup forms when price pauses near recent highs or lows, then breaks out.
| Factor | Continuation context | Reversal context |
|---|---|---|
| Trend backdrop | Clear trend, higher highs or lower lows | Trend weakening, structure breaks |
| 20 EMA behaviour | Price respects EMA, EMA slopes | Price crosses EMA often, EMA flattens |
| Location | Mid-trend pause or after a controlled pullback | At a major support or resistance zone |
| Confirmation | Breakout closes with momentum in the trend direction | Breakout plus failure signs, then follow-through |
| Risk profile | Usually tighter invalidation | Often wider stops, more false breaks |
Spotting Inside Days at Key Support and Resistance Zones
Support and resistance are best treated as zones, not single prices. Inside days near these zones can act like “compression before decision”.
If the price compresses under resistance, a failed breakout may signal seller strength. If it compresses above the support, a breakdown failure may hint at buyer defence.
According to IG, support and resistance are price areas that tend to limit movement, driven by supply and demand.
Confirming Double Tops & Bottoms with Inside Days
Inside days can add structure to double tops and double bottoms. The pattern shows the market is testing a level, then pausing. A breakout from that pause can help confirm which side has control.
Examples traders look for:
- Double top → inside day forms under the neckline → downside break confirms selling pressure.
- Double bottom → inside day forms above the neckline → upside break confirms buying pressure.
A double top often signals weakening upside momentum, while a double bottom can indicate bullish reversal potential.
Counter-Trend Inside Day Breakouts
Counter-trend breakouts oppose the main trend. They carry a higher risk but offer big rewards at extremes.
Require strong confluence. Overextension, divergence, or major levels help. Entries demand caution. False breaks occur frequently.
Warning:
Counter-trend trades fail more often. Use smaller positions and strict stops to protect capital.
Managing Risk in Inside Day Reversal Trades
Reversal trades require stricter risk rules because failure rates are higher. A simple approach is to place the stop-loss beyond the “decision point”. That may be beyond the mother bar range, or beyond the swing that defines the reversal.
A helpful extra check is whether a head and shoulders pattern is developing. That structure often marks a shift from bullish to bearish conditions.
Q: How can I distinguish a continuation inside day from a reversal setup?
A: Continuation inside days form mid-trend, away from major levels, and a break in the trend direction with momentum.
Day Trading Tricks and Technical Combos With Inside Days
Day traders adapt inside day principles to shorter charts for faster signals. They use inside bars (similar patterns on any timeframe) for inside day trading. Combine them with indicators, volume, or pure price action. Filters like trend bias improve results. Lower timeframes increase opportunities but add noise.
Inside Day vs Inside Bar: What Works Best Intraday
In technical analysis, the difference between an Inside Day and an Inside Bar is simply the timeframe. Both refer to a two-bar price pattern where the second bar’s entire range (high and low) is completely contained within the high and low of the preceding bar, known as the “mother bar”.
An inside day refers strictly to daily candles. The full range stays within the previous day’s highs and lows.
An inside bar applies the same rule to any chart. Intraday traders prefer inside bars on H1 or lower. Inside bars form more often. They allow multiple setups per session.
Outside days or bars show expansion. Wider ranges signal volatility increase—the opposite of contraction.
Picking the Best Timeframes for Day Trading Inside Days
For beginners, higher timeframes reduce noise and false breaks. Many traders use a “top-down” routine. They map direction on H4 or daily, then refine entries on H1.
Practical approach:
- Use H4 or daily to define trend and key levels.
- Use H1 for entry timing and breakout confirmation.
- Avoid very small charts if spreads and whipsaws dominate.
Using Volatility Indicators & Range Expansion Signals
Inside day trading improves when you measure volatility contraction. A simple tool is ATR, which estimates the recent price movement size. When ATR is low and ranges compress, a breakout can travel further than expected.
Useful checks:
- Compare the inside range to the recent ATR.
- Prefer breakouts when volatility begins rising again.
- Treat “tiny ranges” as higher false-break risk.
Key Point:
Contraction is not a signal by itself. Your edge comes from timing expansion after confirmation, not before it.
Trend Structure and Market Bias Filters
Bias filters stop you from taking every breakout. Use simple structure rules that fit your plan.
Examples of bias filters:
- Trade with the trend when the price makes higher highs or lower lows.
- Avoid mixed structures where swings overlap heavily.
- Skip trades into nearby support or resistance barriers.
Also note session effects. Liquidity changes can distort range behaviour, especially around opens.
Combining Inside Days With a Price Action Framework
A practical framework combines a price trigger and one momentum filter. The RSI can help you avoid chasing weak breakouts.
For example, traders may avoid long breakouts when the RSI is falling sharply. Others look for RSI holding above a midline during bullish conditions.
How to Scan for Inside Day Opportunities
Scanners automate the search for inside day patterns across many instruments. An inside day scanner quickly identifies consolidation setups.
Platforms like Thinkorswim and TradingView offer custom tools. Traders save time and find opportunities in stocks or forex pairs efficiently.
What Exactly Is an Inside Day Scanner?
An inside day scanner searches for candles where the high and low stay within the previous day’s range. It flags potential volatility contraction.
Scanners run on daily charts. They highlight setups for breakout monitoring. Combining inside days with narrow range filters refines results for higher probability.
Traders apply additional criteria like volume or trend alignment.
More Info:
Scanners work best when you narrow the universe first. Start with liquid pairs or large-cap stocks, then scan.
Setting Up Your Inside Day Scanner in Thinkorswim
Thinkorswim’s Stock Hacker enables custom scans. Use ThinkScript for inside day conditions.
Simple code example:
plot insideDay = high < high[1] and low > low[1];
Add this as a study filter. Scan across watchlists or all stocks.
Users combine with NR4 (narrowest range in 4 days) for tighter setups.
According to Reddit’s r/thinkorswim community, this basic code reliably detects inside days on daily aggregation.
Scanning for Inside Days in TradingView
TradingView’s screener supports Pine Script. Create indicators or use built-in tools. Basic Pine Script for inside day detection:
//@version=5
indicator(“Inside Bar Highlight”, overlay=true)
isInside = high < high[1] and low > low[1]
barcolor(isInside ? color.yellow : na)
// Optional: show mother bar range
plot(isInside ? high[1] : na, “Mother High”, color=color.gray)
plot(isInside ? low[1] : na, “Mother Low”, color=color.gray)
This supports an inside day scanner TradingView workflow: find candidates, then validate context on the chart.
Finding Stocks & Forex Pairs With Inside Day Patterns
Start with instruments that have reliable liquidity and consistent daily ranges. For Forex, focus on major pairs during active sessions. For stocks, use large-cap lists to reduce gaps and irregular prints.
A practical scanning routine:
- Scan daily first, then review H4 or H1 for entry planning.
- Skip symbols with wide spreads or low average range.
- Note whether the setup forms near support or resistance.
Optimising Your Strategy and Managing Trades
A strong inside day trading strategy is not only about entries. It depends on position sizing, volatility context, and whether market conditions support clean breakouts. Optimisation is how you turn a setup into a repeatable process.
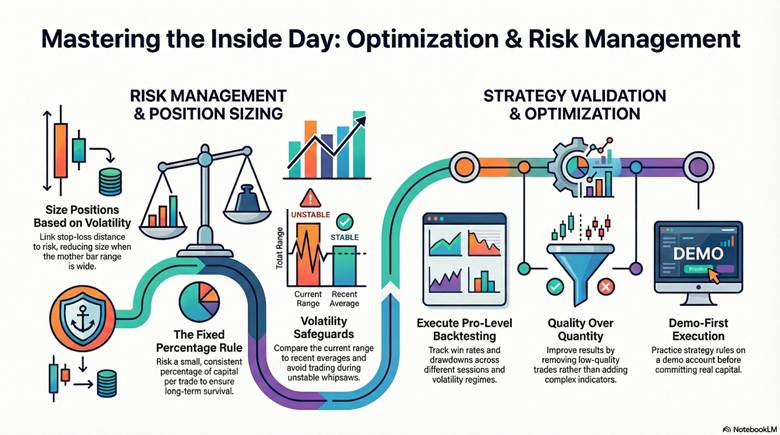
Position Sizing Tips for Inside Day Breakouts
Position sizing links your stop-loss distance to how much you risk per trade. Wider ranges require a smaller size. Narrow ranges allow a larger size, but slippage still matters.
Position sizing should consider stop-loss distance and market volatility, not just conviction.
Beginner-friendly rules:
- Risk a small, fixed percentage per trade.
- Size down when the mother bar range is unusually wide.
- Never increase size to “make back” losses.
Note:
Practice sizing and execution on a forex demo account before using real capital.
Trading Inside Days in High vs Low Volatility
High volatility can create bigger breakouts, but also more false triggers. Low volatility can produce tight ranges, yet breakouts may stall without participation.
Useful checks:
- Compare today’s range to the recent average range.
- Avoid trading when spreads widen unusually.
- Expect more whipsaws when volatility is unstable.
How News & Fundamental Triggers Affect Inside Day Trades
Inside days often form before scheduled announcements, when traders reduce exposure. The breakout may be fast, but direction can flip if the first move fades.
Practical safeguards:
- Avoid entries shortly before major economic releases.
- Prefer confirmation after the first reaction candle closes.
- Reduce size if you choose to trade news-adjacent setups.
Backtesting Your Inside Day Strategies Like a Pro
Backtesting shows whether your rules work across different conditions. It also reveals where the strategy fails, which is essential for risk control.
A simple backtest checklist:
- Define exact entry, stop, and exit rules.
- Separate results by session and volatility regime.
- Track win rate, average win/loss, and maximum drawdown.
- Record “no trade” filters and their impact.
Q: What Is the Fastest Way to Improve an Inside Day Trading Strategy?
A: Start by removing low-quality trades, not by adding indicators. Filter for trend direction, clear breakout confirmation, and enough space to the next support or resistance zone. Then backtest those exact filters over a meaningful sample.
Finally, practice execution on the demo until you can follow the rules without hesitation.
Conclusion
Inside days are a simple, educational price action tool that shows market balance before a potential breakout. They work best when paired with strong risk rules, including clear stop-loss placement, position sizing, and breakout confirmation. No pattern is guaranteed, so false breakouts should be expected.
To build consistency, practise the inside day trading strategy in a controlled environment, track results, and refine rules based on evidence. Start on a forex demo account, develop disciplined execution, and keep learning step by step to improve decision-making over time.