


When it comes to investing, three key questions come to mind: How much profit do I want to earn? How much price volatility can I tolerate? And how do I find a balance between the two?
The answers to these questions are summarized in one simple concept: understanding the relationship between risk and return. By grasping this concept, you can build an optimal investment portfolio based on your risk tolerance and time horizon, and transform your financial decisions from emotional choices into a logical and defensible approach.
To learn more about these concepts in detail and discover how to build a portfolio that aligns with your goals, continue reading.

- Risk isn't always about constant volatility; sometimes, it also means losing out on growth opportunities.
- Risk and return are always present in every decision, even in holding cash in a bank account.
- The best return isn't necessarily the highest return; rather, it's the return that aligns with your risk tolerance.
- Lowering risk doesn't always mean lowering returns. Through intelligent diversification, you can improve both.
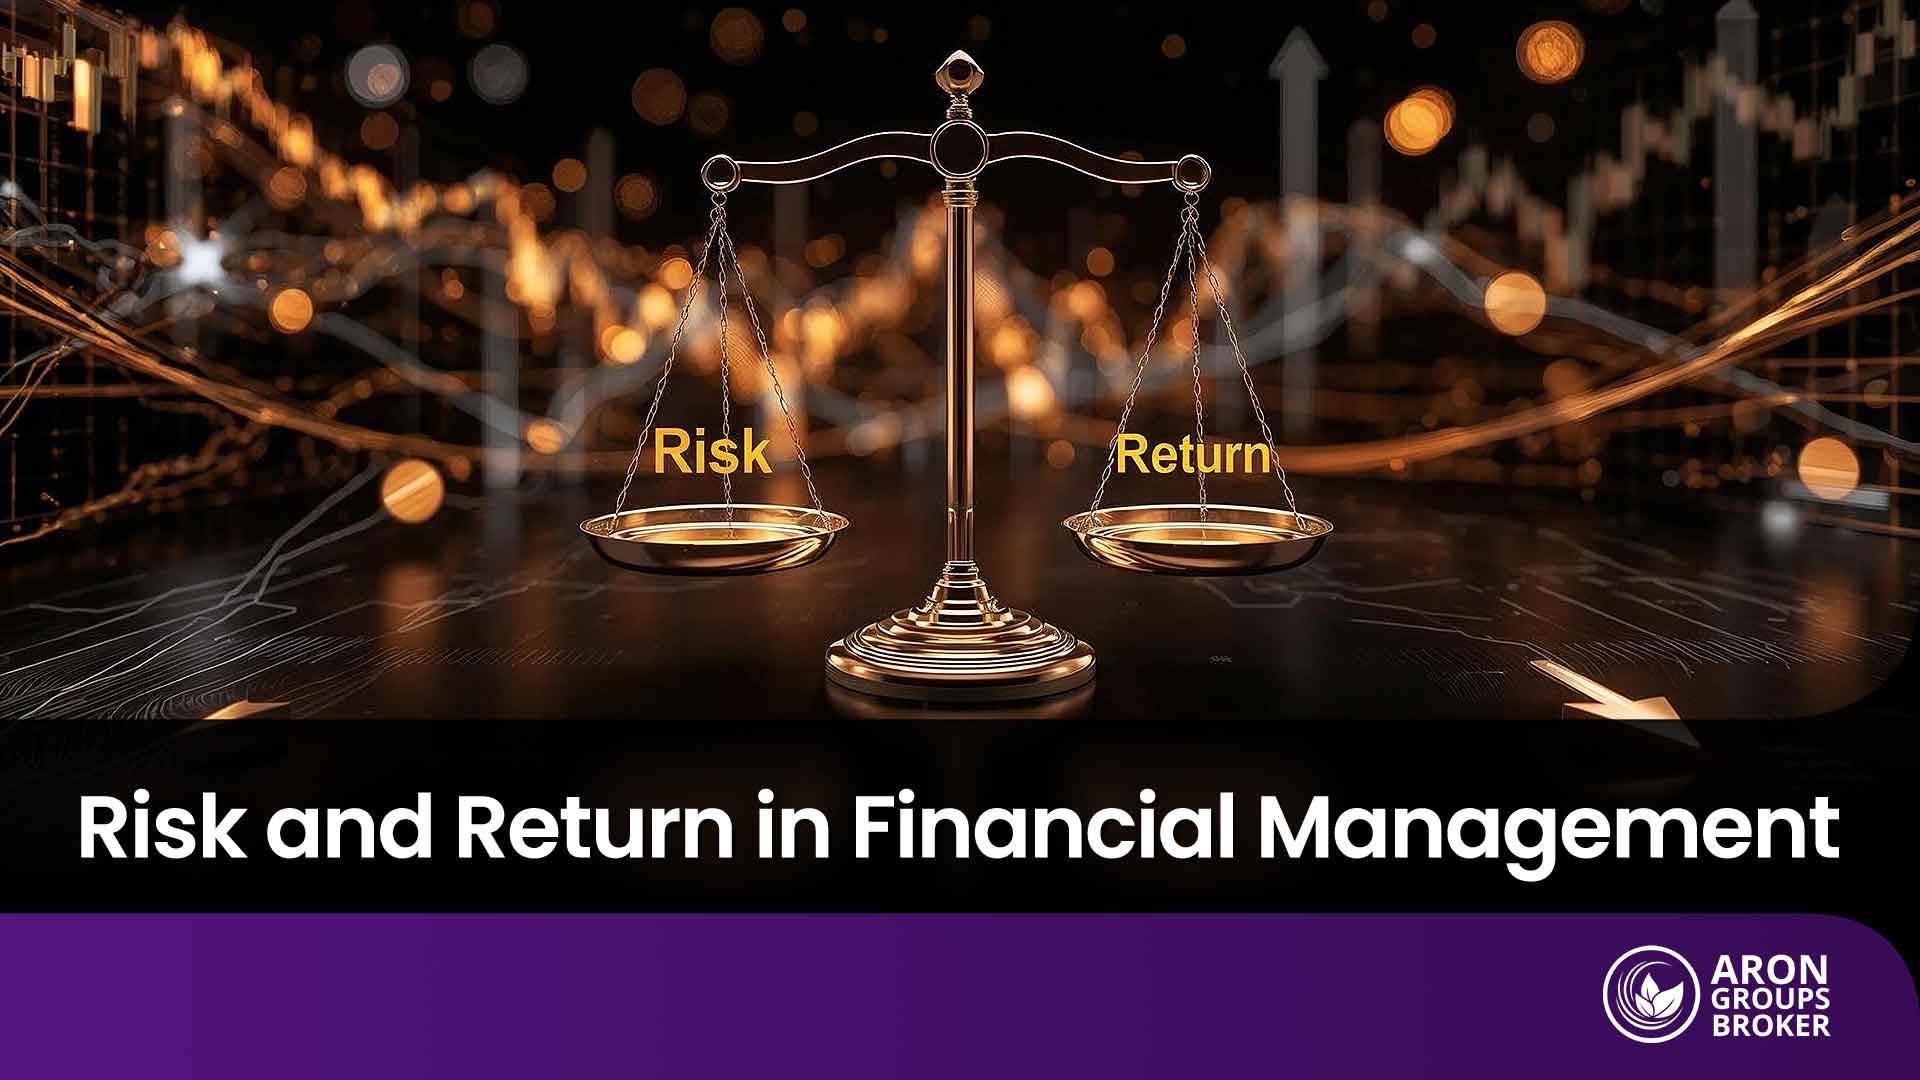
What are Risk and Return in Investing?
Risk and return are two inseparable concepts in the world of investing. In simple terms, risk is the probability that the final outcome of your investment will differ from what you expected. This difference can manifest as price fluctuations or even a financial loss.
Risk has different types:
- Volatility Risk: The upward and downward movement in the price of an asset.
- Liquidity Risk: The inability to sell your asset quickly at a reasonable price.
- Inflation Risk: When the return is not enough to maintain your purchasing power against inflation.
- Systemic Risk: Macroeconomic events that affect the entire market (such as war or an economic crisis).
- Unsystematic Risk: Bad news that affects only a specific company and its stock.
Return refers to the profit you earn from an investment. This profit can be generated from changes in the asset’s price (such as an increase in stock price) or from periodic income (such as stock dividends or rental income from property). Sometimes, other factors like currency exchange rate fluctuations also contribute to the return.
Why Are Risk and Return Always Intertwined in Investing?
The risk-return relationship in financial markets is a fundamental and universal principle. The greater the risk or uncertainty of an investment, the greater the reward a capital provider requires. This reward is a higher expected return, which is reflected in the asset’s price. This relationship is a natural mechanism that maintains market equilibrium.
- Compensation for Uncertainty (Risk Premium): When an asset’s future is ambiguous, an investor will not accept it without the promise of a higher return. This extra compensation is called a risk premium and helps to balance prices.
- Competition and Arbitrage: If an asset were truly “low-risk and high-return,” significant capital would be attracted to it. This influx of capital would drive its price up, consequently reducing its return. In this way, the risk-free opportunity disappears, and the market reaches equilibrium.
- Quality and Liquidity: High-quality government bonds typically have lower returns due to their lower default risk and higher liquidity. In contrast, riskier corporate bonds or stocks of small companies must promise a higher return to attract investors, compensating for their risk and liquidity cost.
- Complexity and Transparency: The more complex an asset is and the less transparent its information, the higher its risk. To cover this ambiguity, the market demands a higher return, thereby compensating for the cost of uncertainty.
- Inflation and Purchasing Power: Even assets that seem safe on the surface still carry the risk of losing purchasing power if their return is less than the inflation rate. To remain attractive, these assets must offer a return that is commensurate with the inflationary environment; otherwise, investors will gravitate toward riskier but potentially higher-return options.

According to CFI, financial management and risk-return strategies should not focus solely on short-term profits or risk reduction; rather, they should be designed to enhance shareholders’ real wealth over the long term.
Types of Investment Risk
Here are the different types of risk in investing.
Systematic (Market) Risk and Its Contributing Factors
This is a risk that affects the entire market and cannot be eliminated through portfolio diversification. It usually originates from macroeconomic factors such as changes in interest rates, economic recession or boom, geopolitical risks, monetary and fiscal policies, or commodity shocks like a surge in oil prices.
For instance, when central banks sharply raise interest rates, the valuation of growth stocks comes under pressure, the cost of financing increases, and most stocks fall simultaneously, even if some companies’ performance is strong.
Unsystematic (Company or Sector) Risk
This risk is specific to a particular company or industry and can be significantly reduced through portfolio diversification. It can stem from poor management, a product failure, legal/regulatory risks, or new competition.
For example, Company A delays the launch of its key product for months. As a result, that company’s stock (and perhaps a few direct competitors) falls, but the broader market is not seriously impacted.
Liquidity Risk and Its Importance for Investors
This refers to the difficulty of buying or selling an asset quickly at a fair price. The lower the trading volume and the wider the bid-ask spread, the higher the cost of entering and exiting a position.
If you own a small, thinly traded stock and need to sell it urgently, there will be few buyers and a lack of order depth. To get cash quickly, you’ll often be forced to sell for several percent less than a fair price. This is an example of liquidity risk and a higher “cost of exit.”
However, a large Exchange-Traded Fund (ETF) in the same industry has many buyers and sellers. For this reason, it usually trades quickly and its price remains close to its Net Asset Value (NAV). This means you lose less of the real value when converting it to cash.
Inflation Risk and Its Impact on the Value of Money
Inflation erodes your purchasing power. On paper, you might see a good return, but a significant portion of it may have only served to “maintain the value of your money.” What matters is the real return, not just the nominal figure.
For example, if you had a 15% nominal return in a given year and the inflation rate was 10%, a large part of your profit was spent on offsetting inflation, and your real return would feel closer to 4 to 5 percent.
Risk and return, rather than having a linear relationship, follow more of a curve in practice. Beyond a certain point, taking on additional risk does not necessarily lead to higher returns.
The Relationship Between Risk and Return
In the world of investing, risk and return are two sides of the same coin, and understanding their relationship is the cornerstone of any smart financial decision.
Why Does Increased Risk Usually Lead to Increased Return?
In the context of financial management, the market defines a reward for every level of uncertainty. When an asset has more volatility or a higher probability of error in forecasting its performance, an investor demands a risk premium for accepting that situation, that is, a higher expected return.
If such a reward did not exist, capital would flow out of that asset until prices changed and a new equilibrium was established.
The Efficient Frontier and Its Role in Selecting an Optimal Portfolio
The Efficient Frontier is a key concept in Modern Portfolio Theory that helps investors find the best possible combination of assets. In simple terms, this frontier is a line that represents the best investment portfolios, that is, those that:
- Offer the highest return for a given level of risk.
- Incur the lowest risk for a given level of return.
If your investment portfolio is below this frontier, it means you could earn a higher return for the same amount of risk or accept less risk for the same return.
For example, instead of putting all your capital into stocks (100% stocks), you can invest in a combination, such as 70% stocks and 30% government bonds. In many cases, this combination has much lower volatility than a 100% stock portfolio while its returns remain nearly the same. By doing this, you have effectively moved your portfolio toward the Efficient Frontier, not below it.
How Is Investment Return Calculated?
Return is the primary measure of investment success, and various methods exist to calculate it, each providing a different and complementary picture of the final outcome.
Nominal Return vs. Real Return
Nominal return is the raw number you see on paper, before considering inflation. In contrast, real return shows how much your purchasing power has increased after the effect of inflation.
Sometimes the nominal figure looks appealing, but if inflation is high, a large portion of that return has only served to preserve the value of your money. For decision-making, looking at the real return provides a more accurate picture of your “actual profit.”
Expected Return vs. Realized Return
As the name suggests, expected return is an estimate or forecast you make based on available analysis and information before starting an investment or at the beginning of a period. This number isn’t a guaranteed promise but a logical, data-driven expectation.
In contrast, realized return is the outcome that actually occurs at the end of the investment period. The difference between these two figures reflects the inherent risks. Factors like unexpected news, sudden policy changes, human error in analysis, or even chance can cause the realized return to diverge from your expected return.
A less-discussed but equally important factor in reducing risk is time diversification (investing across different time periods), which in practice is just as crucial as asset diversification.
Common Metrics for Calculating Return
To measure the profit from an investment, various metrics are used, each with a specific application. Here are the most important ones:
1. Price Return
This metric considers only the change in an asset’s price and ignores cash payments like dividends or rent.
2. Total Return
This metric is more comprehensive, including both the price change and all cash receipts (such as dividends, bond coupons, and rent). Total return is typically calculated assuming these receipts are reinvested and is a more complete measure for comparison.
3. Dividend/Coupon Yield
This metric shows the ratio of annual cash income (like dividends or bond coupons) to your investment’s value. It’s beneficial for investors seeking regular income.
4. Compound Annual Growth Rate (CAGR)
If you want to compare the performance of a multi-year investment on an annual basis, CAGR is the best option. This metric converts multi-year performance into a single average annual rate, allowing you to compare investments with different time frames easily.
5. Time-Weighted Return (TWRR)
This metric is suitable for evaluating the performance of portfolio managers. TWRR neutralizes the impact of investor cash inflows and outflows to show how well the portfolio itself performed without external influences.
6. Money-Weighted Return (IRR/XIRR)
This type of return is useful for projects, startups, or any scenario with irregular cash flows. By considering the timing and amount of each cash inflow or outflow, the money-weighted return shows the true return of the investment.
7. Net Return
This is the profit that remains for you after all fees, taxes, and transaction costs have been deducted. You should always use this net figure as the basis for your investment decisions.
How to Measure Risk and Return in Investing
This section aims to introduce a few practical yardsticks to help you build a clearer picture of risk and return in financial management, both before and after you invest, to make more disciplined decisions.
Risk/Reward Ratio
The risk/reward ratio shows you how much you are willing to lose in a trade or investment idea to achieve a potential profit. In other words, this ratio compares the potential profit against the potential loss.
For example, a ratio of 1:2 means that for every one unit of currency you risk, you expect to earn at least two units in profit.
Before you begin any investment, you should define your stop-loss (the point where you accept a loss) and your price target (the point where you take a profit). You can then calculate this ratio to decide whether entering the trade is a logical move.
Beta and Measuring Market Risk
Beta is a tool used to measure how volatile an asset is compared to the overall market. In other words, beta shows how much the price of an asset moves up or down relative to the market index.
Interpreting the Beta Coefficient
- Beta of 1: This means the asset’s volatility is approximately the same as the market’s. If the market grows by 10%, this asset is also expected to grow by about 10%.
- Beta greater than 1: This indicates the asset is more volatile than the market. These types of assets are more sensitive to systematic risk. For instance, if a stock has a beta of 1.5 and the market grows by 10%, that stock is expected to grow by 15%.
- Beta less than 1: This shows the asset moves more moderately than the market. These assets act as a buffer in a portfolio, helping to stabilize it.
- Negative Beta: This means the asset usually moves in the opposite direction of the market. This characteristic is very useful for portfolio diversification, as it can be profitable during a market downturn.
The beta coefficient is not static; it changes with economic cycles, company structure, and market volatility. Therefore, it is necessary to re-evaluate it periodically.
Standard Deviation and Variance as Volatility Indicators
Standard deviation and variance are two statistical tools used to measure an asset’s volatility and the dispersion of its returns. In simple terms, these two metrics show how uncertain and unpredictable an asset’s returns are.
Interpreting Standard Deviation and Variance
- A larger number: indicates greater volatility and uncertainty. This increased volatility can lead to an emotionally unsettling experience for the investor.
- Asset Correlation: When calculating a portfolio’s risk, the volatility of each individual asset isn’t the only important factor; the correlation between them also matters. Placing assets that move in the same direction together reduces the effect of diversification.
- A more complete picture: For a better understanding of risk, it’s advisable to consider other metrics in addition to standard deviation and variance, such as maximum drawdown and liquidity, to avoid being surprised by unexpected outcomes.
The Sharpe Ratio for Comparing Investments
The Sharpe Ratio is a tool for measuring and comparing the performance of investments. It tells you how much excess return (above the risk-free rate) an investment has generated for the amount of risk taken. In simpler terms, this ratio shows an investment’s efficiency in using risk.
Interpreting the Sharpe Ratio
- A higher number: The higher the Sharpe Ratio, the more return your investment has generated per unit of risk. This metric helps you compare “apples to apples” and understand which fund, portfolio, or strategy has performed better.
- Empirical standard: Generally, a Sharpe Ratio above 1 is considered good, and above 2 is excellent. However, this is a general rule, and its precise interpretation depends on the asset type and the time period.
- Downside risk: If your primary focus is on the risk of price declines (downside risk), the Sortino Ratio can be a more suitable choice. It provides a more realistic picture of return quality because it only considers negative volatility.
In a situation of chronic inflation, the traditional risk-return equation breaks down, and preserving capital value becomes a higher priority than seeking returns.
Risk and Return Management Strategies
Here is an introduction to various risk and return management strategies.
Portfolio Diversification
Diversification is a key strategy for reducing your portfolio’s dependence on a single source of risk. By diversifying, you can achieve a proper balance between risk and return.
Types of Diversification
- Inter-asset class: Spread your assets across different classes such as stocks, bonds, gold, commodities, real estate investment trusts (REITs), and cash. This prevents a shock in one specific market from affecting your entire capital.
- Intra-asset class: Even within a single asset class, you should diversify. For example, in stocks, divide your investments among various industries, large and small companies, investment styles (like value or growth stocks), and different geographical regions. In bonds, you can diversify across various maturities and credit qualities.
- Targeting low correlation: Simply increasing the number of assets isn’t enough. You must include assets in your portfolio that typically don’t move up or down at the same time. This is what creates genuine diversification.
- Periodic rebalancing: The weight of assets in your portfolio changes over time. By rebalancing your portfolio at set intervals, you ensure that you don’t stray from your planned risk and return management strategy.
Setting Stop-Losses in Trades
A stop-loss is your safety brake in the world of investing. This tool helps you prevent large losses and allows you to stay in the market for future trades.
Practical Stop-Loss Types
- Price/Technical: Set your stop-loss slightly below a support level, above a resistance level, or at a point that invalidates your initial analysis.
- Trailing Stop: As the price moves in your favor, your stop-loss gradually moves with it. This method allows you to lock in profits while exiting the trade in case of a sudden price reversal.
- Time-based: If your desired signal isn’t confirmed by a specific time, exit the trade. This type of stop-loss prevents you from being tied up in unprofitable trades for a long period.
Money Management and Determining Position Size
Money management means determining your maximum acceptable loss before you even think about profit. This ensures you can stay in the market even after several consecutive losses.
Key Principles of Money Management
- Fixed risk per trade: Risk only a small percentage of your total capital on each trade (e.g., 1% to 2%). This strategy prevents your capital from being wiped out, even with a series of losses.
- Smart position sizing: The size of each trade should be inversely proportional to the distance to your stop-loss. The farther away your stop-loss, the smaller the position you should take, and vice versa.
- Simultaneous risk cap: If you enter multiple trades with similar directions, control your total open risk. This prevents your entire portfolio from being damaged by a shared piece of news.
- Phased entry and exit: Instead of entering a trade with all your capital at once, enter in multiple phases. When you reach your profit targets, also take profits in stages.
- Journaling and review: Log all your trades, stop-losses, and risk/reward ratios. This helps you maintain discipline and improve the quality of your decision-making.
Choosing Safe-Haven Assets Like Gold and Bonds
“Relatively safe” assets play a buffering role in your portfolio by reducing overall volatility. However, it’s important to note that these assets are not entirely risk-free.
Types of Safe Assets and Their Uses
- High-quality government bonds: These bonds typically act as a safe haven during periods of market uncertainty and volatility, helping to stabilize your portfolio. However, these bonds are sensitive to changes in interest rates.
- Inflation-protected securities: These options are more suitable for inflationary environments or when you don’t want your portfolio to be sensitive to interest rate fluctuations.
- Gold: Gold is a well-known tool for diversifying against systemic risks and inflation. However, gold itself is volatile and, unlike some assets, does not generate periodic income (like dividends). Therefore, you must adjust its weight in your portfolio based on your goals and time horizon.
The Role of Risk and Return in Investor Decision-Making
Risk and return are your compass in the world of investing. Every decision you make, from buying a stock to holding cash, is essentially accepting a certain level of risk to achieve a desired return. The quality of your decisions depends on three questions:
- How risk-tolerant are you?
- What return do you need to reach your goals?
- Do your risk tolerance and return needs align with your investment portfolio and your real-life situation?
The Different Views of Risk-Takers vs. Risk-Averse Investors
Risk-Taker Investors
These individuals are willing to accept greater volatility to achieve a potentially higher return. They typically allocate a larger portion of their portfolios to growth stocks, volatile assets, or innovative opportunities. To prevent major losses, this group needs greater discipline in money management and setting stop-losses.
Risk-Averse Investors
For these individuals, preserving the original capital is the main priority. They allocate a larger portion of their portfolios to high-quality bonds, low-volatility funds, and cash. While this approach lowers the expected return, it provides greater peace of mind.
Three Key Metrics for All Investors
Both groups must consider three fundamental metrics:
- Risk appetite: How much volatility can you tolerate psychologically?
- Risk capacity: How much of a loss can you handle financially?
- Return requirement: What return do you need to achieve your goals?
The combination of these three metrics will guide you in weighting your assets and choosing your investment instruments.
The Importance of Investment Horizon in Accepting Risk
Time is a crucial buffer against risk. The longer your investment horizon, the less important short-term fluctuations become, and the more logical it is to accept risk.
- Short-term (1 to 3 years): In this period, stability and liquidity are more important. Therefore, low-volatility assets and instruments with higher liquidity are safer choices.
- Medium-term (3 to 7 years): Over this horizon, a balanced mix of stocks and bonds can effectively manage risk and return. Periodic rebalancing of the portfolio helps you stay near the Efficient Frontier.
- Long-term (7+ years): In the long run, it is more logical to allocate a larger portion of your capital to growth assets, as you have more opportunity to recover from downturns and benefit from compounding.
Investment Psychology and Its Effect on Risk Tolerance
Our minds are not always rational. Some common behavioral biases can shift the risk-return balance against us:
- Loss aversion: The pain of a loss feels more intense than the pleasure of a gain. This feeling causes us to hold onto losing positions for too long and sell small winners too early.
- Recency bias: We overemphasize recent events. After a few market crashes, we see the future as bleak, and after a few periods of growth, we think it will always be green.
- Herding behavior: We often follow the crowd, especially during market peaks when excitement and liquidity risk are high.
- Anchoring: We fixate on a specific number, such as the purchase price or a mental target, and ignore market realities.
Solutions for Reducing Biases
To counter these behavioral biases, you can use these methods:
- Written rules: Before entering a trade, write down your risk/reward ratio, stop-loss, and exit scenarios, and stick to them.
- Trading journal: Record the reasons for each decision, your immediate feelings, and the outcome. This transparency is the enemy of repeated biases.
- Phased investing and automatic rebalancing: These strategies reduce reliance on emotions and bring discipline to your decision-making.
- Diversified portfolio: Monitor asset correlation so that a single piece of news doesn’t impact your entire portfolio.
- Determine a maximum drawdown: By specifying the maximum acceptable loss, you’ll avoid making “emotional decisions” during crises.
Conclusion
Ultimately, a sound investment decision means aligning risk and return with your personal character and real-life circumstances. Whether you are a risk-taker or risk-averse is important, but what’s more crucial is that your choices are compatible with your investment horizon and investment psychology.
By adhering to clear rules such as portfolio diversification, money management, and periodic review, you can achieve a return that is both tolerable and sufficient for reaching your goals.


