


The Arms Index (TRIN) is a powerful technical indicator that combines price and volume data to show buying and selling pressure. Designed over half a century ago, it helps traders spot bullish, bearish, or neutral conditions and act with more clarity.
In this article, we explain what the Arms Index is, how to calculate and interpret it, and how to use it in stocks and forex. The goal is to introduce practical examples and precise interpretations for daily trading and short-term decision-making.

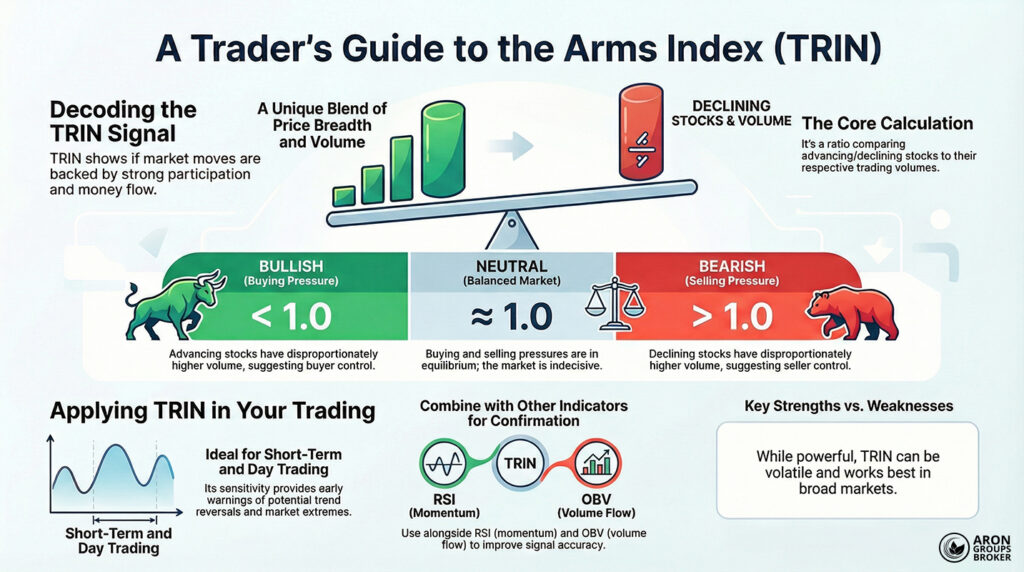
- The Arms Index (TRIN) combines price and volume data to show the market’s supply-and-demand balance.
- TRIN values below 1 suggest demand dominance and a bullish bias, while values above 1 point to selling pressure.
- It is useful for day trading and spotting overbought or oversold conditions in both stock and forex markets.
- Combining TRIN with indicators such as RSI and OBV can improve signal quality and reduce false signals.
What Is the Arms Index (TRIN)?
According to chartschool, the Arms Index, also known as TRIN (short for Short-Term Trading Index), measures market strength using breadth and volume. It was developed by Richard Arms in 1967 and is widely used to detect short-term overbought and oversold conditions.
TRIN shows whether supply and demand are balanced or skewed, based on how many symbols rise or fall. It also checks whether trading volume supports those advances or declines, which adds an extra layer of confirmation.
What Does TRIN Show?
Unlike indicators that focus only on price or only on volume, TRIN blends both to capture broader market behaviour. This makes it useful when price action looks strong, but volume data tells a different story.
- When TRIN is below 1, demand is stronger than supply, and the market is usually in a bullish phase.
- When TRIN is above 1, supply outweighs demand, and the market may be weakening or falling.
- A TRIN value of 1 suggests a near-perfect balance between supply and demand.
Although it was built for the New York Stock Exchange (NYSE), it is now used in other markets too. Common examples include:
- Nasdaq,
- S&P 500 or Nasdaq 100,
- Broader forex market data, with small adjustments in the input method.
How to Calculate and Interpret the Arms Index (TRIN)
The Arms Index (TRIN) is calculated by combining market breadth and volume data to assess the balance between supply and demand. It tracks not just how many symbols advanced or declined, but also how volume flowed behind those moves.
TRIN Calculation Formula:
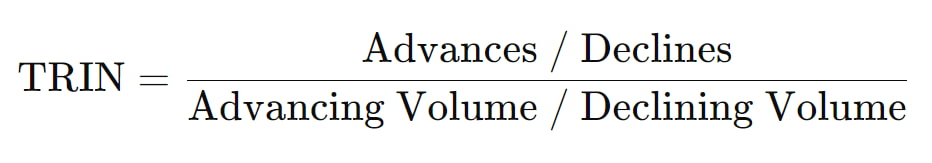
- Advances: number of symbols that closed higher during the session;
- Declines: number of symbols that closed lower during the session;
- Advancing Volume: total volume traded in advancing symbols;
- Declining Volume: total volume traded in declining symbols.
Example
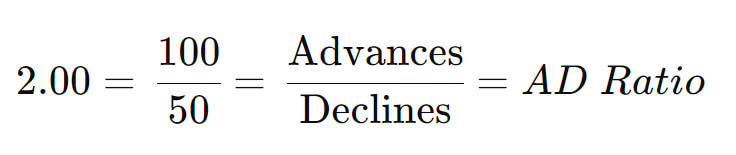
Assume that at the end of a trading day, the market-wide data looks like this:
- Advances: 100;
- Declines: 50;
- Advancing Volume: 200 million shares;
- Declining Volume: 100 million shares.
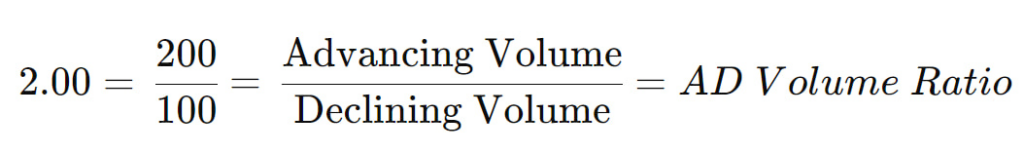
Step 1: Calculate the AD Ratio (Advances ÷ Declines)
Step 2: Calculate the AD Volume Ratio (Advancing Volume ÷ Declining Volume)
Step 3: Calculate TRIN
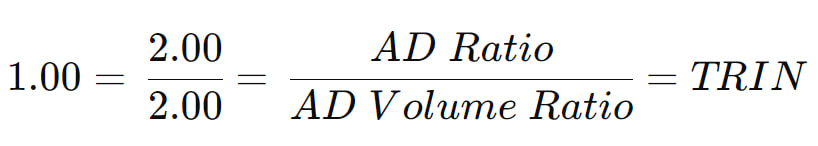
When both ratios rise in the same proportion, TRIN often stays near 1, signalling balance. In this example, the market is considered balanced because breadth and volume are in line with similar ratios.
How Does the Arms Index Show Supply and Demand in the Market?
The Arms Index (TRIN) is a ratio of two key market measures: the AD Ratio and the AD Volume Ratio. It shows whether price rises or falls are backed by meaningful, reliable volume, revealing buyer or seller control.
When TRIN Rises Above 1
As explained in CFI, a sharp rise in TRIN means sellers have taken control and the market is facing broad, heavy selling pressure. In this situation, many symbols are falling, and a significant share of total volume is also flowing into declines. That combination suggests market participants are actively exiting positions rather than just reacting to small price moves.
In the example below, based on real New York Stock Exchange (NYSE) data, the red line highlights extreme weakness. The market breadth and volume figures show that declining symbols dominated both participation and traded volume.
- Only 15% of symbols were advancing, while 85% were declining (AD Ratio = 0.15).
- Advancing volume was only 5% of total market volume, while declining volume reached 95% (AD Volume Ratio = 0.05).
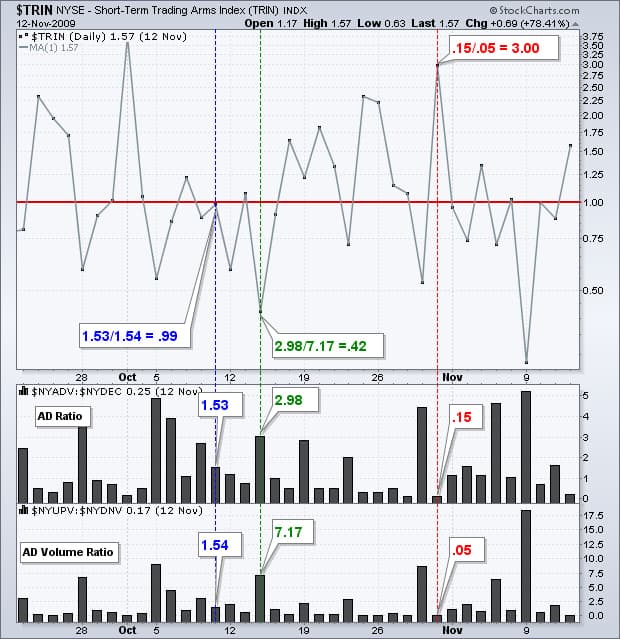
TRIN Calculation in This Case:
TRIN = 0.15 ÷ 0.05 = 3.00
This very high number shows that most symbols are negative, and heavy volume is powering the declines. In these conditions, the market is under strong selling pressure, and long entries carry a very high risk.
When TRIN Falls Below 1
A low TRIN value indicates that buyers are in control and demand is outweighing supply in the market. This usually means many symbols are rising, and strong volume is supporting those advances, not just thin trading.
- A large portion of symbols is moving higher (the green line in the chart).
- More importantly, high traded volume is backing the rise, showing buyers are entering with conviction.
In this case, the market is in a strong bullish trend, and TRIN signals that strength by moving lower.
TRIN Formula Example:
TRIN = 2.98 ÷ 7.17 = 0.42
A low TRIN suggests the market is rising on “demand strength,” supported by both breadth and meaningful volume. High volume alongside many advancing shares is a positive signal, often implying the uptrend may continue.
When TRIN Is Close to 1
When TRIN moves close to 1, it suggests a relative balance between supply and demand in the market. In this zone, neither buyers nor sellers has a meaningful advantage, often creating a neutral market tone.
- The number of advancing symbols is roughly equal to the number of declining symbols.
- The volume behind advancing symbols is not very different from the volume behind declining symbols.
This typically signals a waiting market, where direction is unclear, and traders should stay cautious. In such conditions, it is wiser to wait for confirmation from other indicators or additional analysis.
How Can You Use the Arms Index in Stock and Forex Market Analysis?
This indicator is useful in traditional exchanges like the NYSE and Nasdaq, and it can also support forex analysis. In forex, you can apply it by analysing groups of assets or currency pairs to identify the dominant trend.
Detecting Buying and Selling Pressure with the Arms Index (TRIN)
One of TRIN’s main uses is measuring real-time buyer and seller strength during active market conditions. The TRIN value helps you understand which side currently has the upper hand in market control.
- If TRIN is below 1, advancing symbols and their traded volume outweigh declining symbols and their volume.
- If TRIN is above 1, sellers are more active, and heavier volume is backing price declines across the market.
Because of this, TRIN can support entry and exit decisions, especially when the market is highly volatile.
Combining TRIN with RSI and OBV for More Accurate Analysis
Although TRIN alone offers valuable insight into supply-and-demand balance, pairing it with complementary indicators improves precision. Two practical tools for this purpose are RSI and OBV, which add momentum and volume-confirmation context.
- RSI (Relative Strength Index) shows whether the price is in overbought or oversold territory based on speed and magnitude.
- OBV (On-Balance Volume) links volume to price direction and can warn of divergences when volume fails to confirm price.
When TRIN signals align with RSI and OBV, confidence improves because multiple angles confirm the same market pressure.
For example, if all three suggest buyer strength, a long entry becomes more reasonable under a defined risk plan. Likewise, if all three lean bearish, you may consider exiting longs or entering a short position more confidently.
Practical Use of the Arms Index in Day Trading
In short-term and day trading, where decisions must be fast and precise, TRIN can act as a strong supporting tool. It helps traders quickly understand the market’s overall direction and the intensity behind current moves.
- Early warning of trend reversal: rapid TRIN shifts can flag emerging overbought or oversold phases before many indicators react.
- Relative view of extremes: very low TRIN (for example, below 0.5) may signal overheated buying and a possible pullback.
- Fast read on market sentiment: by mixing price and volume, TRIN shows whether buyers truly support the move or not.
When TRIN is combined with lower timeframes, such as 5-minute or 15-minute charts, signals become more actionable. Pairing it with indicators like RSI, EMA, or MACD can create a real edge for timely entries and exits.
Pros and Cons of Using the Arms Index (TRIN) in Technical Analysis
Like any analytical tool, this index has strengths and limitations that traders should understand before relying on it.
Pros of the Arms Index (TRIN)
The main advantages of the Arms Index (TRIN) for practical market analysis include the following:
- Combines price and volume in one tool: TRIN tracks both advancing/declining symbols and their traded volume simultaneously, improving context.
- Useful for spotting real supply-and-demand pressure: It helps confirm whether price moves are backed by meaningful money flow or not.
- Works well for short timeframes and day trading: Fast TRIN swings can act as early alerts for reversals or sentiment shifts.
- Contrarian behaviour versus market trends: Extreme readings, like below 0.5 or above 3, can signal overbought or oversold conditions.
Cons of the Arms Index (TRIN)
The main drawbacks of the Arms Index (TRIN) are important, especially when applying it outside broad equity markets.
- High dependence on broad market breadth data: Accurate TRIN requires full advance/decline counts and separate volume data, which forex often lacks.
- Lower accuracy in markets with few symbols: In small indexes or narrow asset groups, one large move can distort TRIN readings.
- High volatility on lower timeframes: Without confirmation, short-term TRIN noise can mislead traders into reacting too quickly.
- Requires confirmation from other tools: TRIN should not be a standalone entry or exit trigger, and works best with RSI, OBV, or MAs.
Comparing the Arms Index (TRIN) with Other Market Strength Indicators
To understand TRIN’s usefulness, it helps to compare it with other well-known market indicators. Each tool highlights a different angle of market psychology, trend strength, and volume participation.
Below, we compare TRIN directly with the AD Line, Tick Index, VIX, and OBV to clarify strengths and weaknesses.
TRIN vs AD Line and Tick Index: Which Is More Precise?
The AD Line (Advance–Decline Line) is a popular market breadth indicator that tracks the market’s overall direction. It subtracts declining symbols from advancing symbols each day, then cumulates the result to show the broad trend in health.
The Tick Index is a very short-term indicator showing how many symbols last traded above or below their prior price. It is often used for intraday timing, especially when traders need a quick snapshot of immediate market pressure.
Comparison Table: TRIN vs AD Line vs Tick Index
| Indicator | Data Type | Strengths | Weaknesses |
|---|---|---|---|
| TRIN | Breadth + Volume | Combines symbol counts and volume, reacts quickly to market pressure shifts | Needs full market data, can be noisy at times |
| AD Line (Advance–Decline Line) | Breadth | Shows the market’s overall path using cumulative net advances/declines | Ignores volume, does not measure pressure strength alone |
| Tick Index | Intraday price changes | Shows whether more symbols are rising or falling at any moment | Unstable and sensitive to small swings, mainly useful for scalping |
If you want one indicator that measures price balance and confirms pressure strength through volume, TRIN is more precise. For longer-term context and trend-direction confirmation, the AD Line is often the better supporting tool.
TRIN vs VIX: Which Shows Market Sentiment Better?
The VIX, often called the market “fear index,” reflects expected volatility in U.S. equities over the next 30 days. It is derived from S&P 500 options pricing and represents investor anxiety or confidence about future market conditions.
- If VIX rises, the market expects stronger volatility, often linked to fear and uncertainty.
- If VIX stays low, the market is calmer and more stable, and investors tend to be more optimistic.
Comparison Table: Arms Index (TRIN) vs VIX
| Feature | TRIN | VIX |
|---|---|---|
| Main focus | Buy/sell balance weighted by volume | Market fear or confidence through expected future volatility |
| Nature | Internal market data (breadth + volume) | Options market data (S&P 500 options) |
| Use case | Real-time view of active trader pressure | Gauging future expectations and psychological risk levels |
| Best timing | Day trading and short-term analysis | Hedging strategies and medium-term risk analysis |
TRIN captures today’s real sentiment inside live transactions, while VIX reflects forward-looking expectations and stress levels. Day traders often find TRIN more actionable, while investors may prefer VIX for longer-term risk management.
Key Differences Between TRIN and OBV in Volume Analysis
OBV (On-Balance Volume) is a classic technical analysis indicator that tracks money flow into or out of a specific asset. It combines daily volume with price direction to build a cumulative volume line that may confirm trends.
- If price rises, that day’s volume is added to OBV.
- If the price falls, that day’s volume is subtracted from OBV.
Comparison Table: Arms Index (TRIN) vs the OBV Indicator
| Feature | TRIN | OBV |
|---|---|---|
| Structure | Ratio using symbol counts and their volumes | Cumulative volume conditioned on a positive or negative price change |
| Perspective | Whole market (relative supply and demand) | One symbol or asset (inflow and outflow) |
| Use case | Measuring overall market pressure | Confirming trends or spotting divergences in a single asset |
| Signalling style | Often contrarian at extremes | Positive or negative divergence versus price trend |
If you want a macro view of market-wide volume pressure across many symbols, TRIN is usually more suitable. If you focus on one stock or asset and want divergence signals, OBV is generally the better choice.
Conclusion
The Arms Index (TRIN) is a distinctive tool that blends price and volume data to assess supply-and-demand dynamics more precisely. By delivering real-time signals about buying or selling pressure, it helps traders make sharper decisions in volatile markets.
For best results, combine TRIN with indicators like RSI and OBV, and respect its limits, especially in smaller markets. Mastering TRIN and applying it correctly can give day traders a real edge and deepen their understanding of market behaviour.


