


Many traders at the beginning of their journey face the question of how to identify the market’s main trend amid short-term price fluctuations. One of the tools that proves highly useful in this context is the Accumulative Swing Index (ASI).
This indicator analyzes consecutive price movements to provide a clearer view of the overall market direction, enabling traders to make more informed decisions. In this article, we will introduce the ASI step by step, explain how it works, and show how to apply it alongside other indicators so you can develop a practical strategy with the Accumulative Swing Index (ASI) and use it more effectively in your trading.

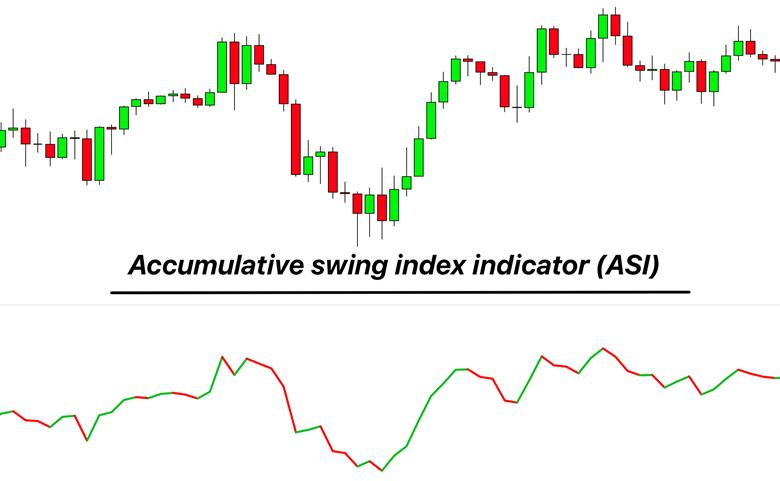
- The Accumulative Swing Index (ASI) is a more comprehensive version of the Swing Index, calculated using candlestick data including open, close, high, and low prices.
- This indicator helps traders look beyond daily fluctuations and gain a clearer picture of long-term market trends.
- When the market is in an uptrend, the ASI value turns positive, and during a downtrend, the ASI value becomes negative.
- The ASI is a practical tool for understanding trend strength and assessing overall market direction, especially when combined with other technical analysis tools.
What is the Accumulative Swing Index (ASI) and How Does It Work?
Many traders face the challenge of identifying the true market trend when looking at price charts because short term volatility often hides the bigger picture. In such situations the Accumulative Swing Index (ASI) can be very useful since it aggregates price data and presents a clearer view of the overall market direction.
The Accumulative Swing Index is calculated using candlestick data such as open, close, high and low. The result is a cumulative value that reflects both the strength and the direction of price movement. This allows traders to separate short lived fluctuations from genuine long term trends.
The Accumulative Swing Index (ASI) is effective not only for identifying broader market movements but also for confirming buy and sell signals. A steady rise in ASI usually points to a higher chance of an uptrend continuing, while a gradual decline may signal a potential downtrend. Because of these qualities, the ASI is considered an important tool in technical analysis that helps traders enter the market with more confidence and reduce the risk of poor decision making.

According to Investopedia, the Accumulative Swing Index (ASI) is a trendline indicator used by technical traders to measure the long term trend of an asset’s price, and it is calculated by simultaneously incorporating the open, close, high, and low prices.
Formula and Calculation of the Accumulative Swing Index (ASI)
To understand the calculation of this tool, we must first become familiar with the concept of the Swing Index (SI). This index is derived by comparing today’s closing price with yesterday’s closing price and also by considering the open, high, and low of the previous period. The simplified formula is presented as follows:
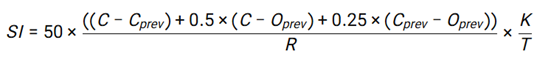
Here, C is today’s closing price, C previous is yesterday’s closing price, and O previous is yesterday’s opening price. R represents the largest difference among today’s high or low and yesterday’s close. K measures the difference between today’s price and the previous high or low. T is the limit move, which is often set at 300 for stocks.
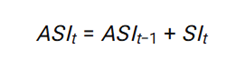
Once the SI is calculated for each period, its value is added to the previous total, creating a continuous line known as the Accumulative Swing Index (ASI).
In simple terms, this indicator adds up daily price changes to highlight the market’s primary trend. If the line is moving upward, it suggests bullish strength, while a downward slope indicates a higher probability of bearish conditions.
According to Investopedia, “the Accumulative Swing Index compiles small price changes across multiple periods to create a clearer picture of the overall market trend and helps filter out price noise.”
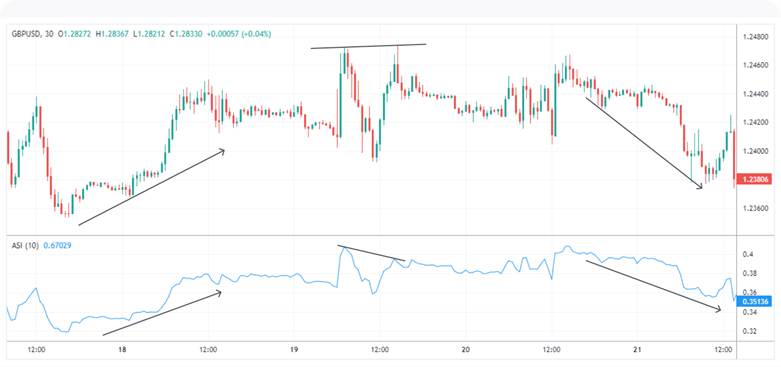
Identifying Bullish and Bearish Trends with the Accumulative Swing Index (ASI)
When analyzing trends with the Accumulative Swing Index (ASI) there are a few straightforward rules to follow. A positive ASI value that slopes upward is generally considered a sign of a bullish market trend. Conversely, when the ASI is negative and moving downward, it suggests a stronger likelihood of a bearish trend. If the ASI line hovers around the zero level without significant movement, the market may be in a sideways phase with no clear trend.
For example, in the Apple (AAPL) stock chart, when the ASI was positioned above zero and angled upward, the price of the stock also moved higher, confirming the bullish trend. This simple approach can serve as an important part of a strategy with the Accumulative Swing Index (ASI), especially when combined with other tools such as trendlines for confirmation of signals.
Identifying Breakouts with the Accumulative Swing Index (ASI)
Price breakouts are significant only when traders can confirm that the new market move is sustainable and that a genuine trend reversal is taking shape. The Accumulative Swing Index (ASI) serves as a valuable tool for confirming such situations.
Typically, if the price of an asset breaks above a previous resistance level and the ASI simultaneously moves above its prior high, this alignment can be a strong signal of a bullish breakout. On the other hand, when the price drops below a previous support level and the ASI also falls beneath its corresponding low, the likelihood of a bearish breakout increases.
For example, in the EUR/USD currency pair, traders have been able to identify new trends more quickly when the ASI confirmed price moves through key levels. An important detail is that many analysts also consider trading volume during breakouts, since high volume adds conviction to the move. For this reason, using ASI together with tools such as support and resistance levels provides stronger confirmation of breakouts and helps reduce false signals.
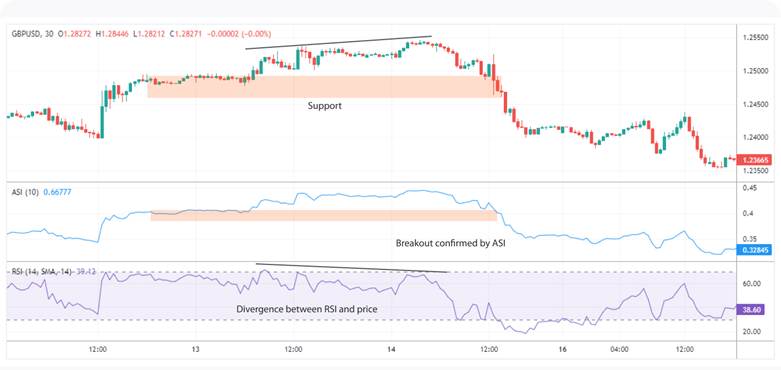
According to Forex-Indicators, “false breakouts in trendlines drawn on bar charts are often not confirmed by the trendlines drawn on the Accumulative Swing Index (ASI).”
Trading with the Accumulative Swing Index (ASI)
The Accumulative Swing Index (ASI) is most effective when its signals are analyzed alongside actual price movements. In general, when the ASI crosses above the zero line, it can indicate the start of a new trend, while a divergence between the index and price action is often viewed as a signal to exit. This straightforward logic forms the foundation of a strategy with the Accumulative Swing Index (ASI) that is widely used in markets such as forex and cryptocurrencies.
Identifying Entry and Exit Points with ASI
For entries, when the ASI value is above zero and sloping upward, it may suggest a buying opportunity. Conversely, if the ASI falls below zero or price creates a new high but the ASI fails to confirm the move, this situation acts as a warning to exit. Such divergences between price and the indicator often point to weakening momentum and a possible trend reversal.
Setting Stop Loss with ASI
For risk management, stop loss levels can be determined based on recent swings in the ASI. In long positions, the stop loss is usually placed slightly below the most recent ASI low. In short positions, it is placed just above the most recent ASI high. This method aligns stop loss placement with the actual behavior of the indicator, helping traders avoid unnecessary whipsaws and better protect their capital.
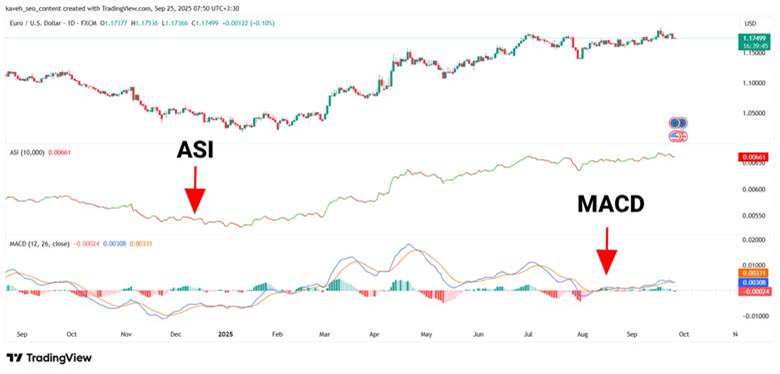
Combining the Accumulative Swing Index (ASI) with MACD
Using multiple indicators together can significantly improve the accuracy of analysis. One common approach is combining the Accumulative Swing Index (ASI) with the MACD. When the ASI confirms a bullish market trend and, at the same time, the MACD generates a buy signal through a bullish crossover, the reliability of the signal increases substantially. In this setup, the ASI acts as a confirmation of the overall market direction, while the MACD highlights momentum shifts. The result of this combination is fewer false signals and a more effective filtering of weak trading setups.
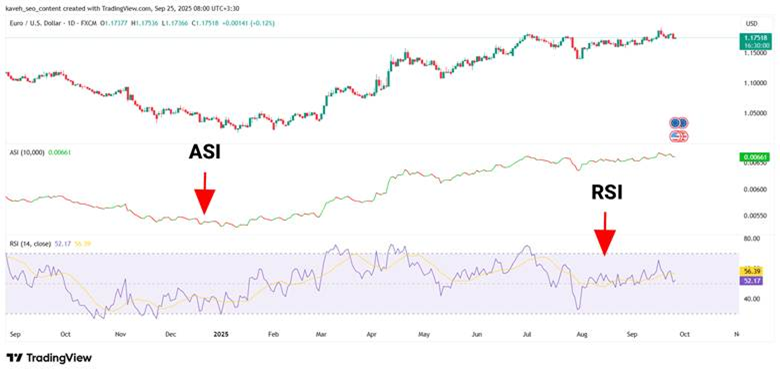
Combining the Accumulative Swing Index (ASI) with RSI
The combination of the Accumulative Swing Index (ASI) and the Relative Strength Index (RSI) can be highly effective for spotting entry points in overbought and oversold conditions. The RSI measures whether the market is overbought (above 70) or oversold (below 30), while the ASI confirms the broader trend. When the ASI is bullish and at the same time the RSI falls below 30, it often signals a strong buying opportunity because the pullback occurs within an overall uptrend.
This strategy with the Accumulative Swing Index (ASI) helps filter out false signals. For example, in Apple stock, if the ASI is positive and the RSI drops to 25, opening a long position at 150 dollars with a target of 160 dollars can be a reasonable trade setup.
Combining the Accumulative Swing Index (ASI) with Moving Averages
When the Accumulative Swing Index (ASI) is used alongside moving averages, trading signals tend to become more reliable. For instance, if the price of a stock breaks above its 50 period moving average while the ASI is also positive and rising, this alignment can indicate the continuation of a bullish trend. In another example, if the price holds above the 20 period exponential moving average (EMA) and the ASI confirms an upward direction, the likelihood of sustained upward movement becomes stronger. This combination allows traders to filter weak signals and gain greater confidence in their trend analysis.
Advantages and Disadvantages of the Accumulative Swing Index (ASI)
One of the main advantages of the Accumulative Swing Index (ASI) is its strong ability to identify long term trends. Also known as the cumulative swing index, it calculates price data in an aggregated way and filters out market noise, offering a clearer picture of the overall price direction. Many traders believe that using the ASI together with other tools makes analysis more reliable and trading decisions easier to manage.
However, there are also limitations to consider. The calculations behind ASI are more complex compared to many other indicators, which may be challenging for beginners. In addition, because the data is accumulated over time, the ASI can sometimes react with a lag to sudden market changes. In sideways or range bound markets, the risk of false signals also increases.
For this reason, answering the question of what the Accumulative Swing Index (ASI) is requires looking at both strengths and weaknesses. Understanding these aspects allows traders to use it more effectively as part of a broader strategy with the Accumulative Swing Index (ASI) and alongside other methods of technical analysis to improve the accuracy of their decision making.
How to Activate and Configure the Accumulative Swing Index (ASI) in MetaTrader and TradingView
To set up and use the Accumulative Swing Index (ASI) in the MetaTrader platform, the indicator file must first be downloaded and placed into the Indicators folder located under MQL4 or MQL5. After copying the file and restarting the software, the indicator will appear in the Indicators list and can then be added to the chart. Within the settings menu, various parameters can be adjusted, with the most important being the Limit, which is typically set to 300 by default for stocks.
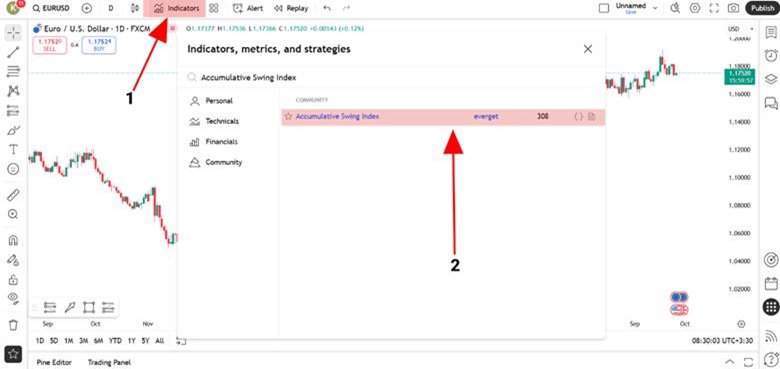
In TradingView, the process is much simpler. A user can go to the Indicators section, search for Accumulative Swing Index, and select one of the available scripts. Once the indicator is added to the chart, its settings can be customized, including adjusting the Limit value and modifying other display features. This flexibility allows traders to tailor the ASI to their strategy and market preferences.
Configuring this tool properly provides a clearer understanding of what the Accumulative Swing Index (ASI) is, and using it alongside other methods of technical analysis enhances the accuracy of trading decisions.
Conclusion
In conclusion, the Accumulative Swing Index (ASI) offers traders the opportunity to gain deeper insight into price dynamics and develop a stronger understanding of overall market behavior. What truly matters is how this indicator is applied within the framework of a broader strategy with the Accumulative Swing Index (ASI), where traders can combine personal experience with practice in demo accounts to use it effectively. If you are looking to enhance the quality of your analysis, the best step is to start using this tool today and experience its value in real trading decisions.


