


In markets like forex or cryptocurrencies, the Auto Fibonacci indicator is a practical option for traders seeking to identify key market levels with minimal manual effort. By automatically plotting Fibonacci levels, this tool intelligently detects swing highs and lows. It draws Fibonacci lines directly on the chart, making the analysis process easier for traders at all experience levels.
If you are looking for a tool that saves time and improves the accuracy of your trading decisions, the Auto Fibonacci indicator can be a suitable choice. In this article, we cover everything from the main features of the Fibonacci indicator for MetaTrader to a guide on downloading the Fibonacci indicator and its practical applications. Stay with Aron Groups until the end of this guide.

- The Auto Fibonacci indicator removes the need to draw Fibonacci levels manually, making technical analysis faster and more user-friendly for traders at any experience level.
- The ability to adjust Fibonacci levels and the number of candles in this indicator allows traders to tailor it to different trading styles, from scalping to long-term strategies.
- Combining the Auto Fibonacci indicator with tools such as RSI and trendlines increases the probability of identifying valid signals and helps prevent poor trading decisions.
What Is the Auto Fibonacci Indicator and What Is It Used For?
Technical analysis tools like Fibonacci help traders understand market patterns more clearly. They are based on the Fibonacci number sequence, introduced by an Italian mathematician in the 13th century. This simple sequence (0, 1, 1, 2, 3, 5, …) generates key ratios such as 23.6%, 38.2%, 50%, and 61.8%. In financial markets, these ratios are widely used to estimate potential reversal or continuation zones and form the basis of many advanced tools.
The Auto Fibonacci indicator is designed to simplify this process. Instead of requiring traders to identify swing highs and lows manually, it automatically detects these points and draws Fibonacci levels on the chart. This means support and resistance zones are plotted for you, removing the need for manual calculations and reducing the risk of human error. This is particularly practical on platforms like MetaTrader.
Traders in markets such as forex, equities, and cryptocurrencies often use Fibonacci-based indicators in MetaTrader to find better entry and exit points. For example, the 61.8% retracement level is often watched as a potential reversal zone. Compared with manual methods, an Auto Fibonacci indicator offers:
- Faster chart analysis and more consistent, precise level detection across different instruments and timeframes.
Because it saves time and standardizes how levels are drawn, many traders consider Auto Fibonacci a useful addition to their technical toolkit.

The Auto Fibonacci indicator can also be integrated with MetaTrader's alert systems, so you receive instant notifications when the price reaches key Fibonacci levels.
Key Features of the Auto Fibonacci Indicator
The Auto Fibonacci indicator is a standout tool in technical analysis, thanks to its unique capabilities, making it highly valuable for traders in financial markets such as forex, equities, and crypto. By automating the process of plotting Fibonacci levels, this indicator reduces analysis time and improves accuracy.
Unlike traditional tools that require manual configuration, this indicator offers a smarter, more streamlined user experience. Below, we review three core features that set the Fibonacci indicator for MetaTrader apart from other tools.
Customisable settings
One of the main reasons for the popularity of the Auto Fibonacci indicator is the ability to customise it according to the trader’s needs. Users can select Fibonacci levels such as 23.6% or 61.8%, change the colour of the lines, or adjust the number of bars to scan (BarsToScan).
Features such as enabling or disabling specific modes (like HighToLow) also allow traders to optimise the tool for different strategies, from intraday trading to long-term investing. This flexibility makes analysis more personalised and precise.
Automatic detection of highs and lows
Selecting swing highs and lows for drawing Fibonacci levels is often challenging, especially for beginner traders. The Fibonacci indicator for MetaTrader uses advanced algorithms to automatically identify these points and plot the Fibonacci levels on the chart. This significantly reduces human error and helps less-experienced traders perform more reliable analyses without years of chart-reading experience.
Support for multiple timeframes
The flexibility of the Auto Fibonacci indicator in working across different timeframes, from one-minute charts to daily charts, makes it suitable for a wide range of trading styles. Whether you are scalping in short timeframes or conducting long-term analysis in forex or crypto markets, this tool delivers effective performance. This versatility enables traders to apply their strategies consistently under various market conditions.
Installing the Auto Fibonacci Indicator in MetaTrader
Installing the Auto Fibonacci indicator on MetaTrader 4 or 5 is straightforward, allowing traders to benefit from its automated features in technical analysis. In this section, we provide a step-by-step guide to downloading the Fibonacci indicator, installing it, and applying the initial settings so you can easily use it in your forex or crypto trading.
If you are using other platforms such as TradingView, Fibonacci tools for technical analysis are available there as well. However, MetaTrader 5 is a popular choice because of its high compatibility with this type of indicator.
Downloading the Auto Fibonacci Indicator File
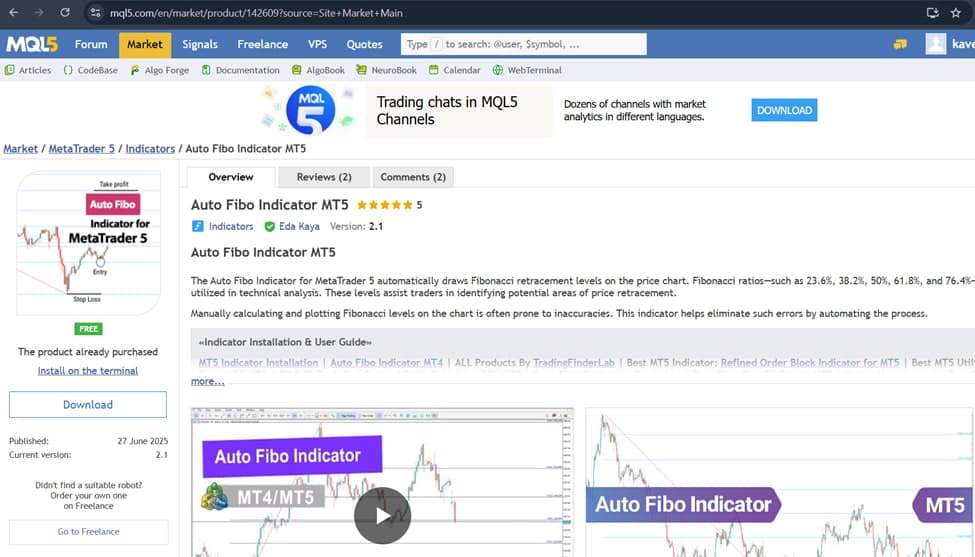
To begin, you need to download the Fibonacci indicator file for MetaTrader from trusted sources. Websites such as MQL5.com provide reliable resources for downloading Fibonacci indicators for free.
When downloading, make sure the file format is .ex5 or .mq4, and avoid untrusted sources to protect your system’s security. Checking user reviews and the website’s credibility can help you avoid malicious files. After downloading, unzip the file if it is compressed and prepare it for installation.
Steps to Install the Indicator in MetaTrader
To install the Auto Fibonacci indicator, follow these steps:
- Open MetaTrader 4 or 5, then from the File menu select Open Data Folder.
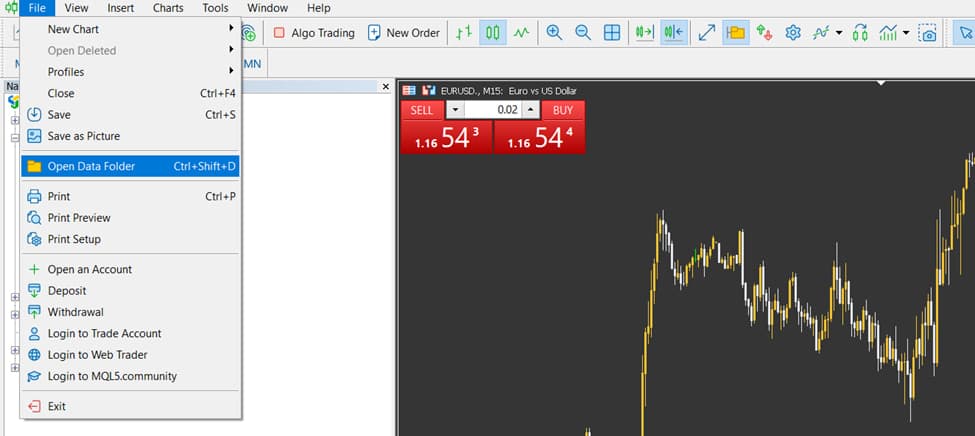
- In the opened directory, go to the MQL4 (or MQL5 for MetaTrader 5) folder, then open the Indicators folder.
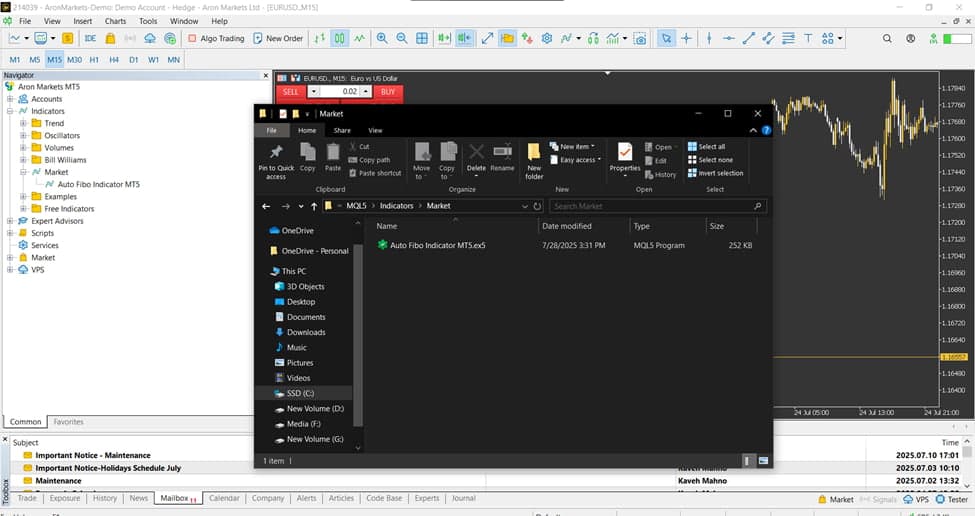
- Copy the indicator file (.ex5 or .mq4) into this Indicators folder.
- Close MetaTrader and open it again.
- In the Navigator panel (usually on the left side of the platform), right-click on Indicators and select Refresh.
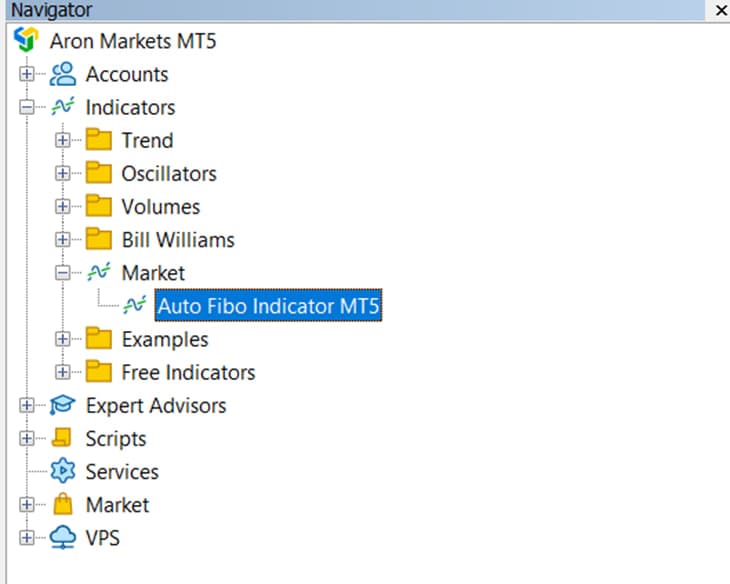
- Find the Fibonacci indicator for MetaTrader in the list and either drag and drop it onto the chart or double-click to apply it.
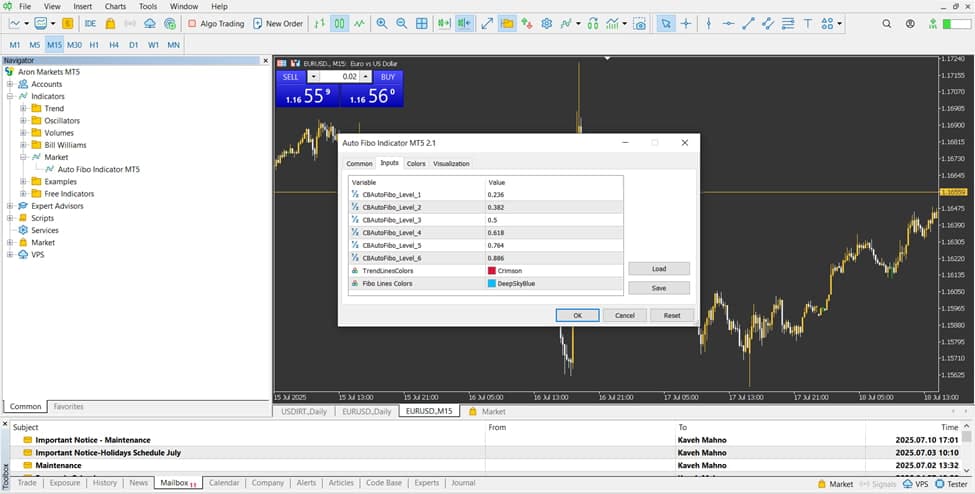
Checking Initial Settings After Installation
After activating the Auto Fibonacci indicator, a settings window will open. The default configuration usually includes standard Fibonacci levels (23.6%, 38.2%, 50%, 61.8%) and a default number of candles to scan (BarsToScan). You can modify the line colours, Fibonacci levels, or the number of bars analysed according to your strategy.
First, test the indicator with the default settings on a demo account to find the best configuration for your trading approach.
Using the Auto Fibonacci Indicator in Market Analysis
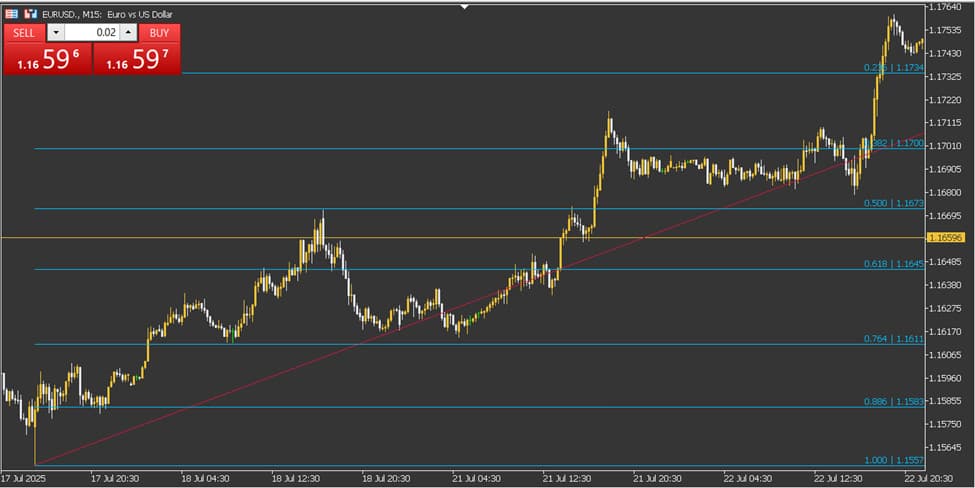
Using the Auto Fibonacci indicator allows traders to quickly and accurately identify retracement and extension levels on the chart, without manually drawing anything. This becomes even more effective when the tool is combined with other indicators or trendlines to validate trading decisions.
Fibonacci retracement levels are used when the price pulls back from a previous move. These levels often highlight areas where the price may reverse again. The Auto Fibonacci indicator automatically plots these retracement levels, making it easier to spot potential reversal zones. It can also draw Fibonacci extensions, which help project trend continuation and set price targets, helping identify the next possible support or resistance level.
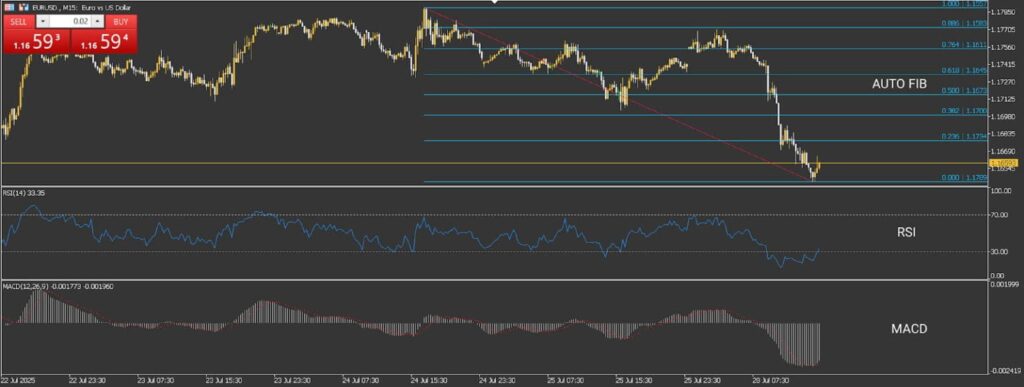
To strengthen market analysis, many traders combine the Auto Fibonacci indicator with additional technical tools, such as:
- RSI, MACD, or moving averages for confirmation of market momentum
- Trendlines or price channels to identify overlap zones or Fibonacci clusters where multiple signals align
Such combinations help provide more reliable entry and exit signals.
Trading volume is another crucial factor. When the price reaches a Fibonacci level with strong volume, the likelihood of a significant reaction increases; if the volume is weak, the level may carry less weight and could signal only a minor or temporary reaction.
According to LuxAlgo, research shows that when Fibonacci levels overlap across multiple timeframes, the probability of a successful trade can increase by up to 40%, while false signals can be reduced by as much as 37%.
Conclusion
Using the Auto Fibonacci indicator is one of the most effective ways to simplify the analysis process in financial markets. By automatically detecting price highs and lows, it accurately plots Fibonacci retracement and extension levels on the chart without any manual intervention. Its main advantages are ease of use, higher analytical accuracy, and significant time savings.
To fully understand how the Auto Fibonacci indicator works, it is recommended to first practice with it on a demo account before using it on a live account. This helps you become familiar with its settings, how levels are drawn, and how price reacts to different Fibonacci zones.


