


In technical analysis, identifying a trend’s direction is only half the story. The more crucial part is understanding the strength, or momentum, behind that trend. Does the current trend have the power to continue, or is it on the verge of a reversal? The answer to this question can define the line between a successful trade and a poor entry. The Awesome Oscillator (AO) indicator, a tool developed by the legendary trader Bill Williams, was designed precisely to answer this question.
This indicator visually displays not only the direction of movement but also the trend’s acceleration and overall health. In this comprehensive guide, we will cover everything from the foundational concepts and the AO’s calculation formula to advanced trading strategies and methods for combining it with other tools.

- The Awesome Oscillator primarily measures the acceleration and strength (momentum) of a trend, not just its direction.
- Bars above the zero line on the indicator's histogram indicate bullish strength, while bars below it signal bearish strength.
- A divergence between the price chart and the AO indicator is a strong warning of a potential trend reversal.
- Never trade on AO signals alone; always combine them with price action analysis.
What Is the Awesome Oscillator and Its Application in Technical Analysis?
The Awesome Oscillator (AO) indicator acts like a speedometer for the market. This technical analysis tool measures market momentum, essentially the acceleration and strength of price movement, to gauge how strong or weak the current trend is.
What Does AO Indicator Do?
By comparing the market’s recent velocity with its broader historical velocity, the tool helps traders identify potential market turning points, gauge increases or decreases in trend strength, and determine optimal times to enter or exit a trade.
AO Indicator Formula and Visualization
The Awesome Oscillator’s calculation is based on the Simple Moving Average (SMA). The formula is as follows:
AO = SMA(Median Price, 5) – SMA(Median Price, 34)
Here’s a breakdown of the formula’s components:
- Median Price: This is calculated as (High + Low) / 2 for each period.
- SMA(Median Price, 5): A 5-period Simple Moving Average of the Median Price.
- SMA(Median Price, 34): A 34-period Simple Moving Average of the Median Price.
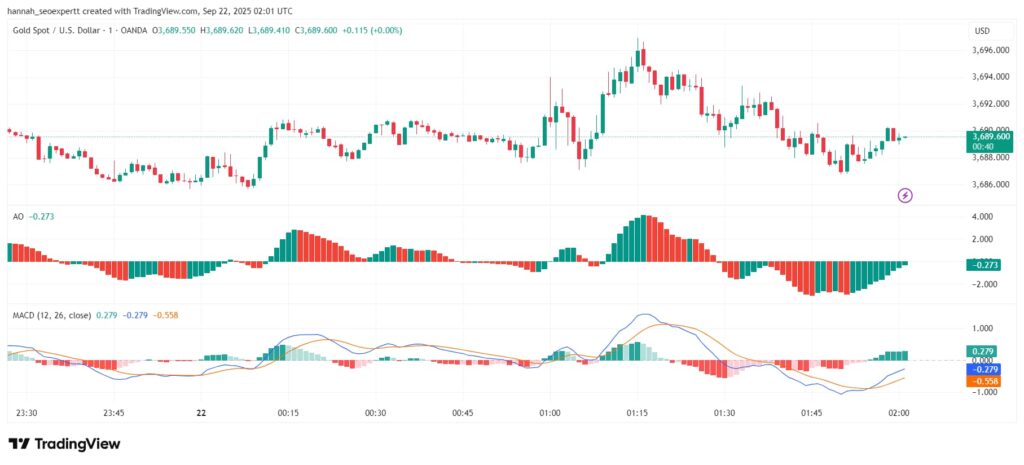
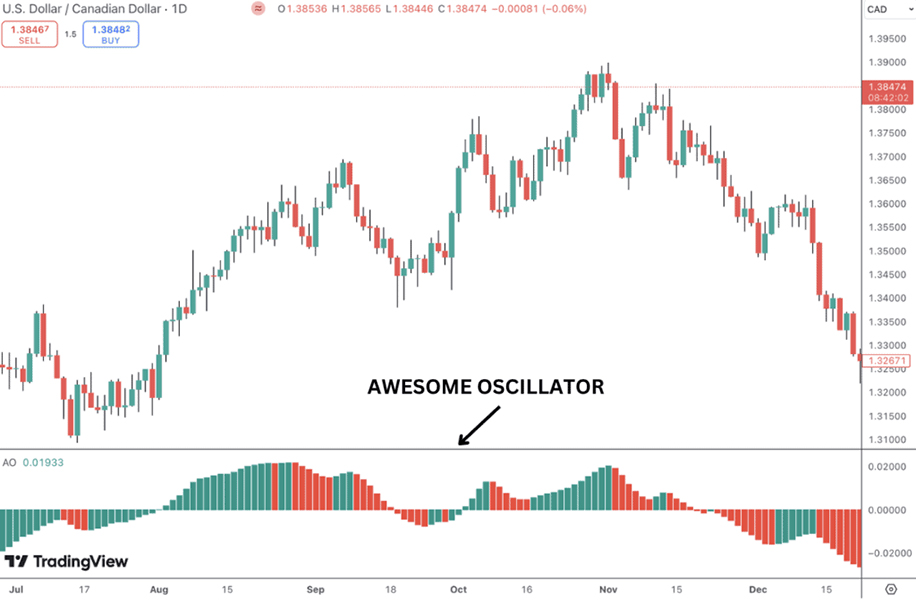
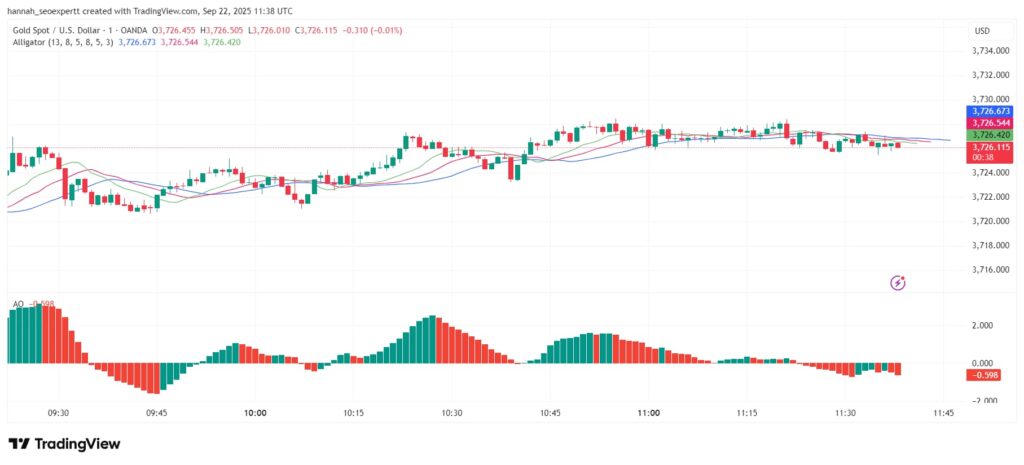
The Awesome Oscillator appears as a green and red histogram that moves above and below a zero line.
- Green Bar: A bar is colored green when its value is higher than the previous bar, indicating an increase in bullish momentum.
- Red Bar: A bar is colored red when its value is lower than the previous bar, indicating an increase in bearish momentum.
Key Differences Between the AO and MACD Indicators
While both the Awesome Oscillator (AO) and the Moving Average Convergence Divergence (MACD) are used to measure momentum and identify divergences, there are several key differences between them:
- Calculation Source: The AO is calculated using the midpoint of the price bars (High + Low) / 2, whereas the MACD is calculated using the closing price.
- Type of Moving Average: The AO uses Simple Moving Averages (SMA) in its formula. In contrast, the MACD uses Exponential Moving Averages (EMA), which give more weight to recent price data.
- Signal Line: The MACD includes an additional signal line. Trading signals are generated when the MACD line crosses the signal line. The AO does not have a signal line; its trading signals are read directly from the histogram and its relationship with the zero line.
Key Differences Between the AO and the Momentum Indicator
The standard Momentum indicator calculates the difference between the current price and the price n periods ago, plotting the result as a single oscillating line. The Awesome Oscillator (AO), however, takes a more sophisticated approach:
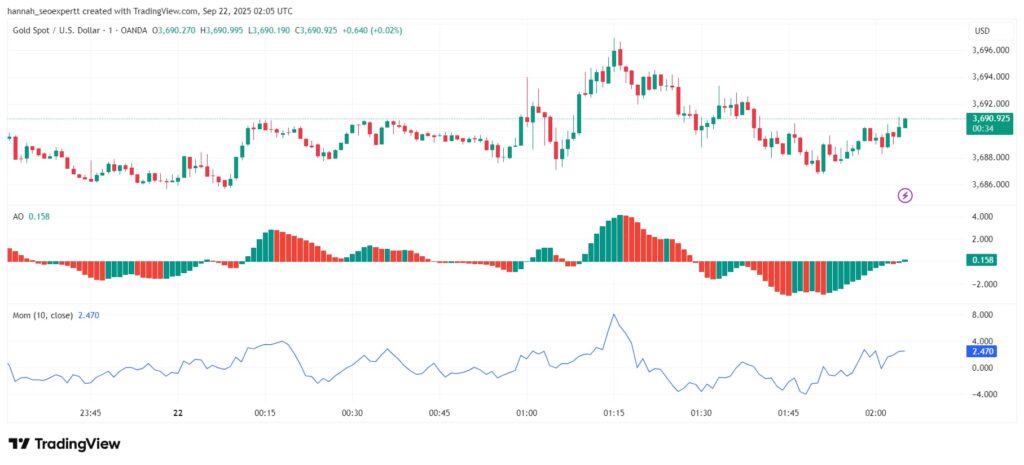
- The AO measures the difference between two moving averages, which provides a smoother and more comprehensive view of market momentum.
- While the standard Momentum indicator can be quite volatile, the AO’s use of moving average filters out minor fluctuations, resulting in fewer whipsaws and clearer trading signals.
AO Indicator Trading Signals: How to Identify and Trade Them
One of the reasons for the Awesome Oscillator’s popularity is its clear and distinct trading signals. Below, we examine three primary trading strategies using this indicator.
Zero Line Crossover: Identifying a Change in Trend Direction
The Zero Line Crossover is the most fundamental yet one of the most powerful signals generated by the AO indicator.
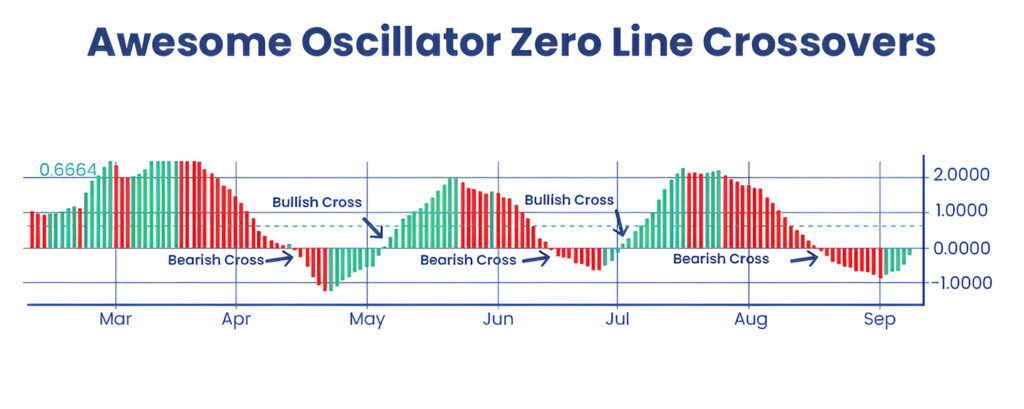
- Buy Signal: When the AO histogram crosses from below the zero line to above it, this indicates a shift in momentum from bearish to bullish. This action is considered a buy signal.
- Sell Signal: Conversely, when the histogram crosses from above the zero line to below it, it signals a shift in momentum from bullish to bearish and serves as a sell signal.
The Saucer Signal: Spotting Rapid Momentum Shifts
The Saucer signal is a trend-following signal that indicates a potential continuation of the current market movement.
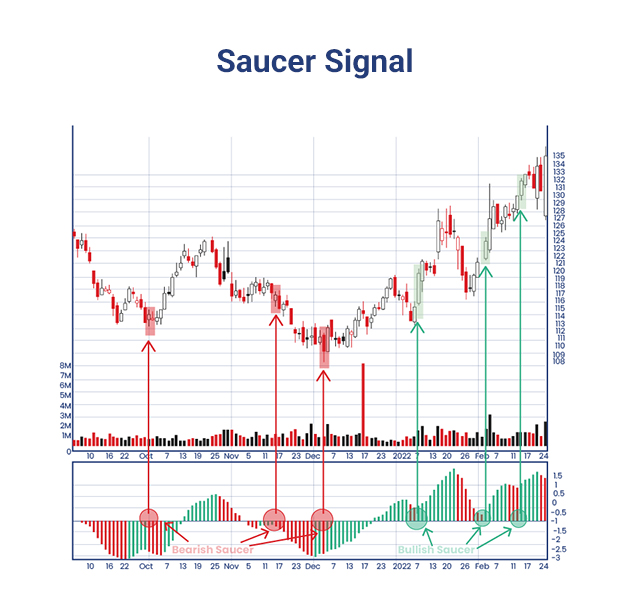
- Bullish Saucer (Buy Signal): This pattern occurs above the zero line. It forms when the histogram is declining (red bars) and, after two consecutive red bars, is followed by a green bar. This setup suggests that bullish momentum is reaccelerating.
- Bearish Saucer (Sell Signal): This pattern occurs below the zero line. It forms when the histogram is rising (green bars) and, after two consecutive green bars, is followed by a red bar.
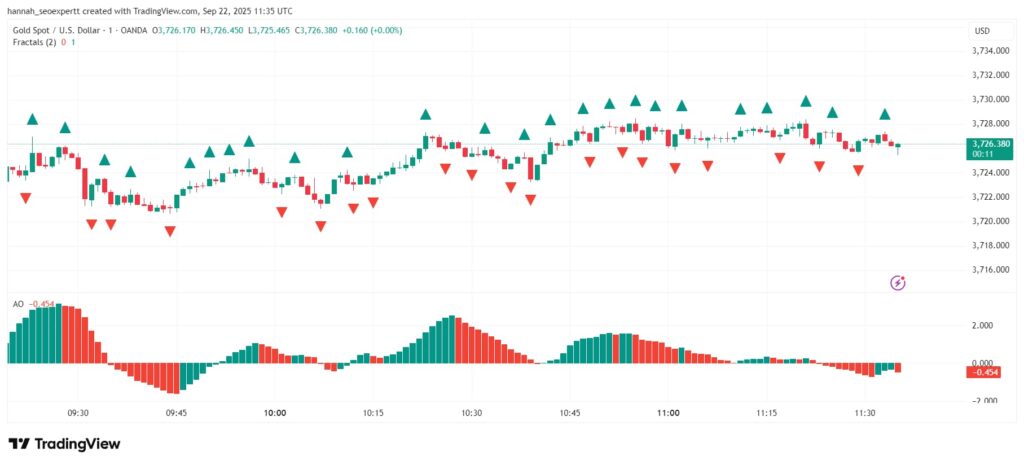
The Twin Peaks Signal: Catching Reversal Points
This signal, which is a form of divergence, is used to identify potential reversal points at the end of a trend.
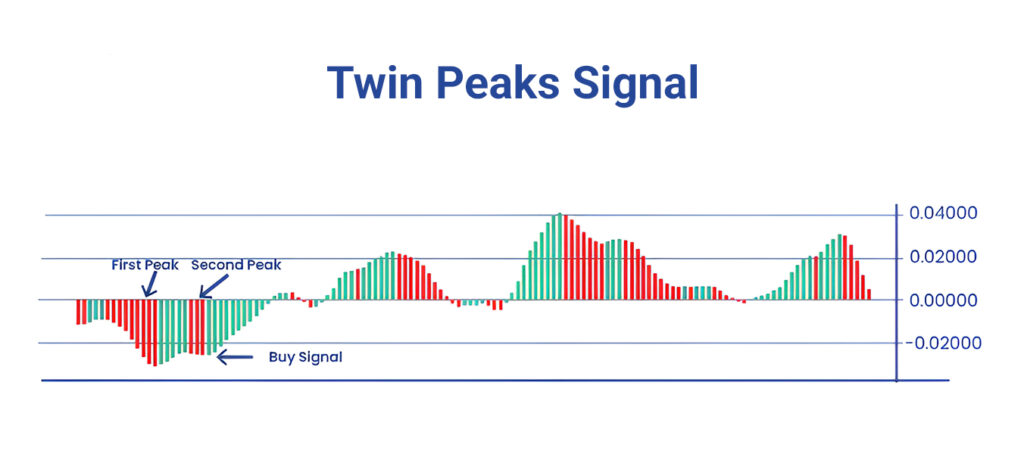
- Bearish Twin Peaks (Sell Signal): This occurs when the price makes a new higher high, but the AO indicator forms a lower high. This bearish divergence indicates weakening momentum in an uptrend and a potential market reversal.
- Bullish Twin Peaks (Buy Signal): This occurs when the price makes a new lower low, but the AO indicator forms a higher low. This bullish divergence signals weakening momentum in a downtrend and presents a potential buying opportunity.

According to Tradingview.com, a critical rule for the "Twin Peaks" pattern is that the trough, or the valley between the two peaks, must never cross the zero line. If this trough touches or moves past the zero line, the signal is considered invalid and should be disregarded.
Using the AO Indicator for Trend Confirmation to Avoid Poor Entries
One of the most effective ways to use the Awesome Oscillator is as a confirmation filter. Before entering any trade, pay close attention to the histogram’s position relative to the zero line.
- For a potential long position (buy), it’s best to wait until the histogram is above the zero line.
- For a potential short position (sell), the presence of the histogram below the zero line confirms the trade’s bearish bias.
This simple step helps you avoid taking trades against the market’s dominant momentum.
Combining the AO Indicator with Price Action
The true potential of any indicator is unlocked when it’s combined with price action analysis. Instead of blindly trading on AO signals, look for confirmation on the price chart itself.
For example:
- When you see a bullish Zero Line Crossover signal, look for a corresponding breakout above a key resistance level or the formation of a bullish candlestick pattern on the price chart.
- When you spot a bearish “Twin Peaks” divergence, wait for the price to break below a bullish trendline or for a strong bearish candle to close before entering a short position.
Combining the AO with Other Bill Williams Indicators
The Awesome Oscillator is part of a larger trading system designed by Bill Williams. For higher-probability signals, you can combine the AO with his other indicators, such as the Alligator and Fractals.
- Combining with the Alligator Indicator: When the Alligator’s lines are open and indicating a strong trend, AO signals that align with that trend (like the Saucer signal) have a much higher degree of reliability.
- Combining with the Fractals Indicator: An AO buy signal is confirmed when the price breaks above the most recent up fractal. Similarly, a sell signal is confirmed when the price breaks below the most recent down fractal.
Pros and Cons of the Awesome Oscillator (AO)
Like any other technical indicator, the Awesome Oscillator has its own set of advantages and disadvantages, which we will explore below.
Advantages of the Awesome Oscillator (AO)
The Awesome Oscillator offers several unique benefits that make it a popular tool among traders, including the following key advantages:
- Rapid Momentum Identification: The indicator quickly shows the trader the strength and direction of market movement (bullish or bearish acceleration).
- Clear Trading Signals: It provides well-defined signals like the “Zero Line Crossover,” “Saucer,” and “Twin Peaks,” which are easy to interpret.
- Simple Visualization of Market Strength: The green and red histogram makes it very simple to visually understand the force of buyers and sellers without complex analysis.
- Versatility in Different Market Conditions: It is effective in both trending markets (to confirm continuations) and ranging or sideways markets (to identify divergences and reversal points).
- Free and Requires No Complex Configuration: The AO is a standard, free indicator on all major trading platforms, and its default settings (5 and 34) are optimized for most market conditions.
Disadvantages of the Awesome Oscillator (AO)
While the Awesome Oscillator (AO) can be a valuable tool for identifying market momentum, traders should also be aware of its limitations, which include the following drawbacks:
- Lagging Signals: Because it’s based on moving averages, its signals appear slightly after the actual price movement has occurred.
- False Signals in Volatile Markets: In choppy markets that lack a clear direction and have sharp, rapid price swings, the AO may generate numerous false signals.
- Requires Confirmation: To increase the probability of a successful trade, AO signals are not sufficient on their own and must be confirmed with other analytical tools, such as price action, support and resistance levels, or other indicators.
- Poor Performance in Sideways Markets: When the market is not trending and is consolidating within a narrow range, the indicator tends to hover around the zero line, failing to produce reliable signals.
- Ignores the Closing Price: The AO is calculated using the midpoint of the price bar (High + Low) and disregards the closing price, which many traders consider the most significant price of a given period.
How to Add and Configure the AO Indicator in MetaTrader and TradingView
Adding this indicator to your trading platform is straightforward. Below, we will explain the steps to activate the AO indicator in TradingView and MetaTrader.
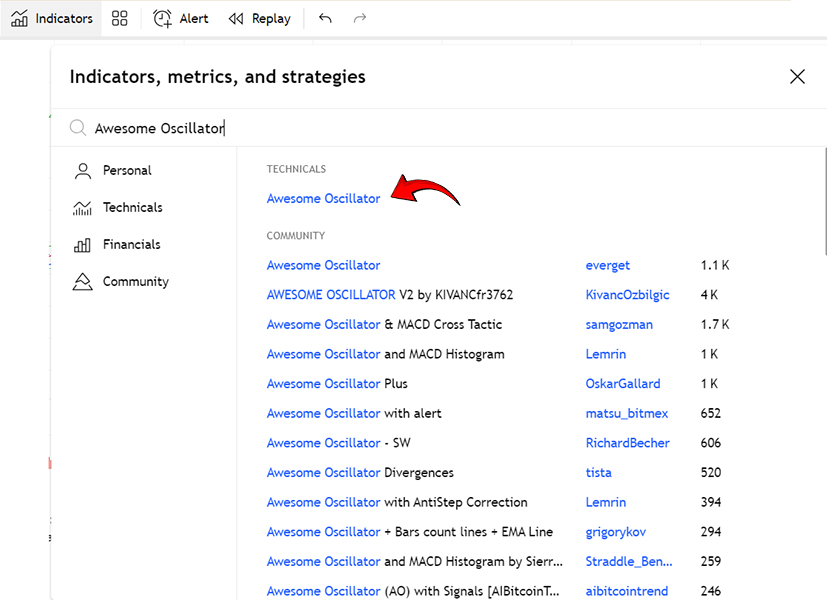
On TradingView
- At the top of your chart, click on the “Indicators” button.
- In the search box, type “Awesome Oscillator”.
- Click on it from the results list to add it to your chart.
On MetaTrader (MT4/MT5)
- From the top menu, navigate to Insert > Indicators > Bill Williams.
- Select “Awesome Oscillator” from the list.
- In the pop-up window, confirm the default settings and click OK.
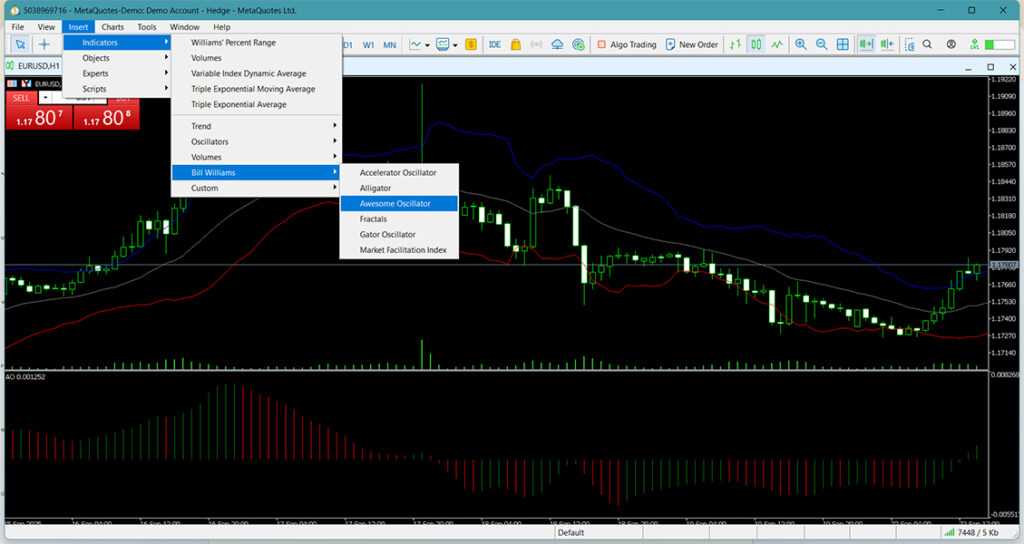
Note: Bill Williams optimized the indicator's default settings (periods 5 and 34) and does not need to be changed in most cases.
Conclusion
The Awesome Oscillator (AO) is an efficient and versatile analytical tool for measuring market momentum. By providing clear signals such as the Zero Line Crossover, the Saucer, and Twin Peaks, this Bill Williams indicator helps traders of all levels identify trading opportunities and better understand market trends.
The key to successfully using this tool is to combine an Awesome Oscillator strategy with other analytical methods, such as price action and proper risk management. With practice and experience, the AO indicator can become an essential part of your analytical toolkit and significantly help improve your trading results.


