icon icon Home
icon icon Accounts
icon icon Quick start
icon icon Symbols

How to Identify Sideways Trends Using a Range Market Indicator

Author
Abe Cofnas
Abe Cofnas
calendar Last update: 11 November 2025
watch Reading time: 13 min

The market isn’t always moving. Sometimes it slows down, takes a breath, and prepares for the next breakout. If you can accurately identify these moments of calm, you can position yourself strategically before the next major move begins.
This is where the Range Market Indicator comes into play; an intelligent tool designed to precisely detect neutral or sideways zones, helping traders avoid high-risk trades during times when the market is neither bullish nor bearish.
In this article, you’ll learn how to use this indicator, often considered the best indicator for range trading, in combination with other powerful analytical tools to identify ranging areas, spot professional entry and exit points, and even profit from limited market volatility.

bookmark
Key Points:
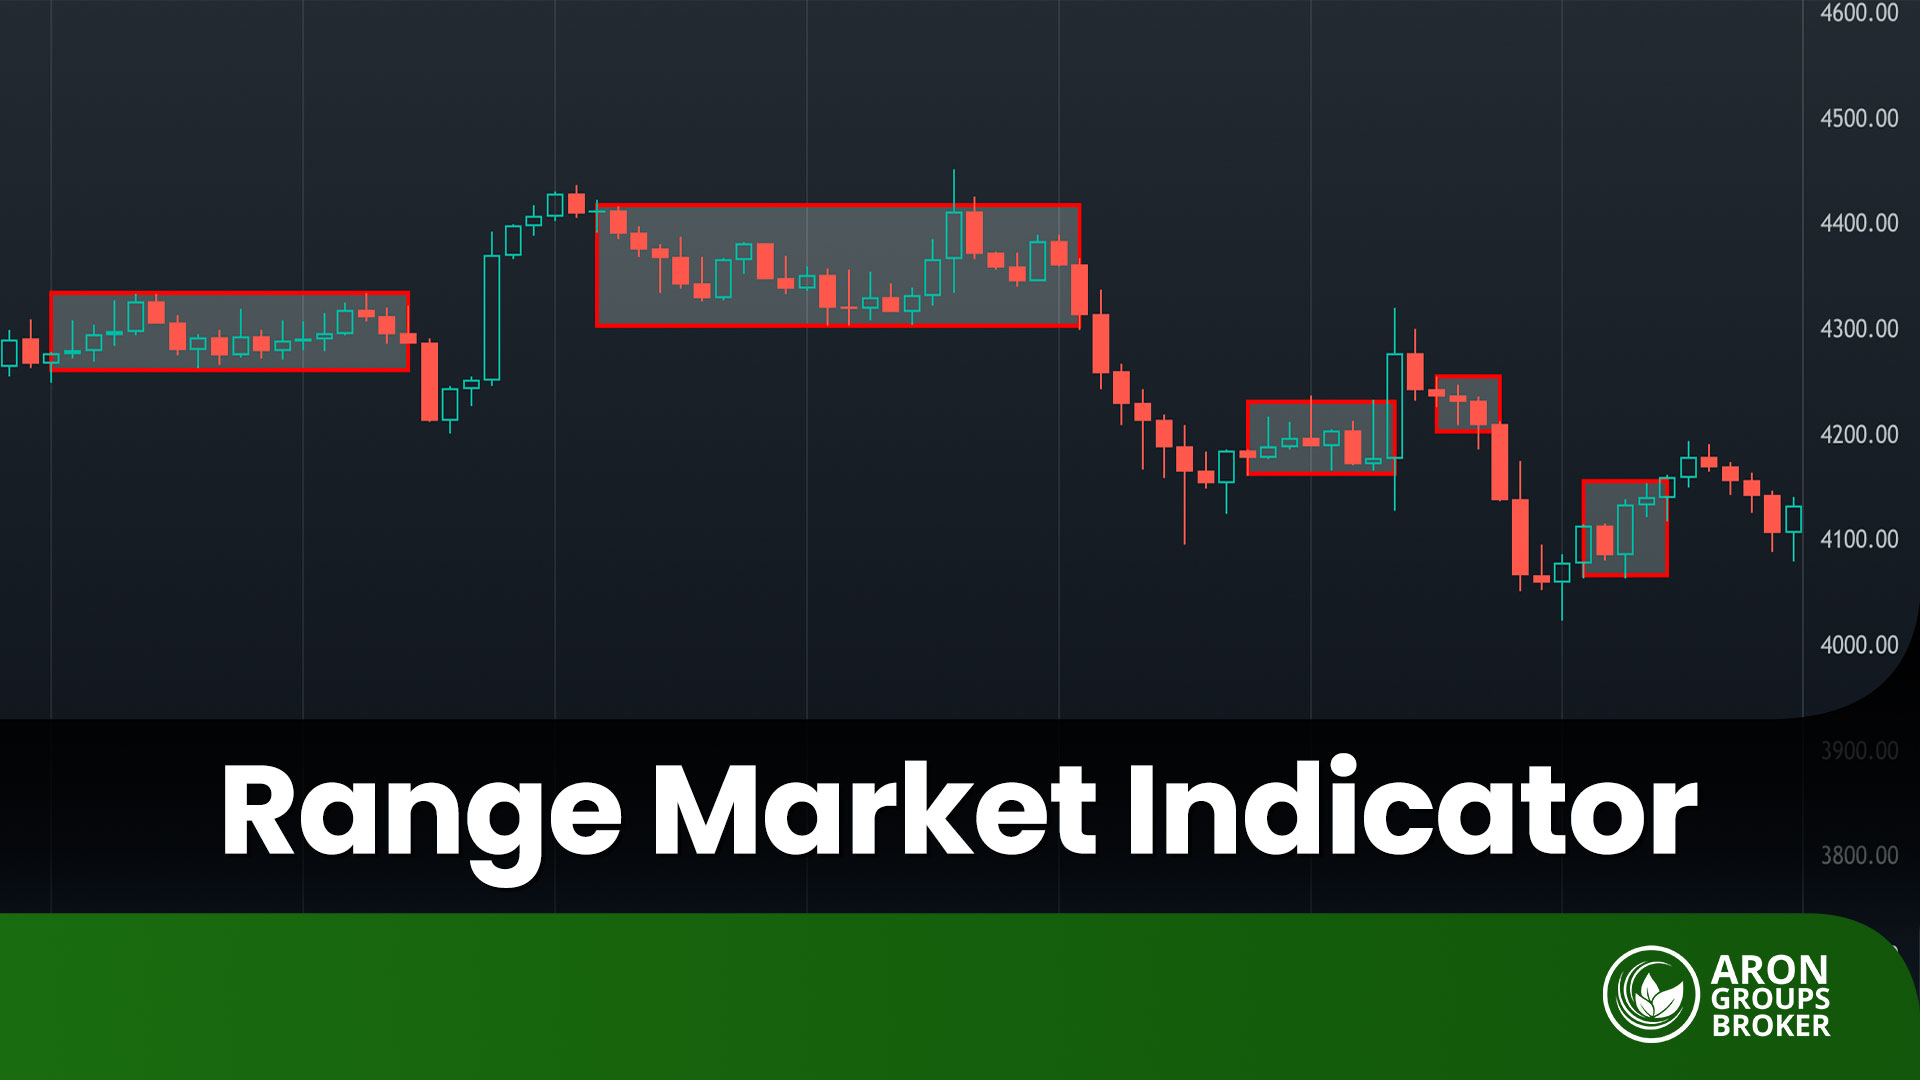
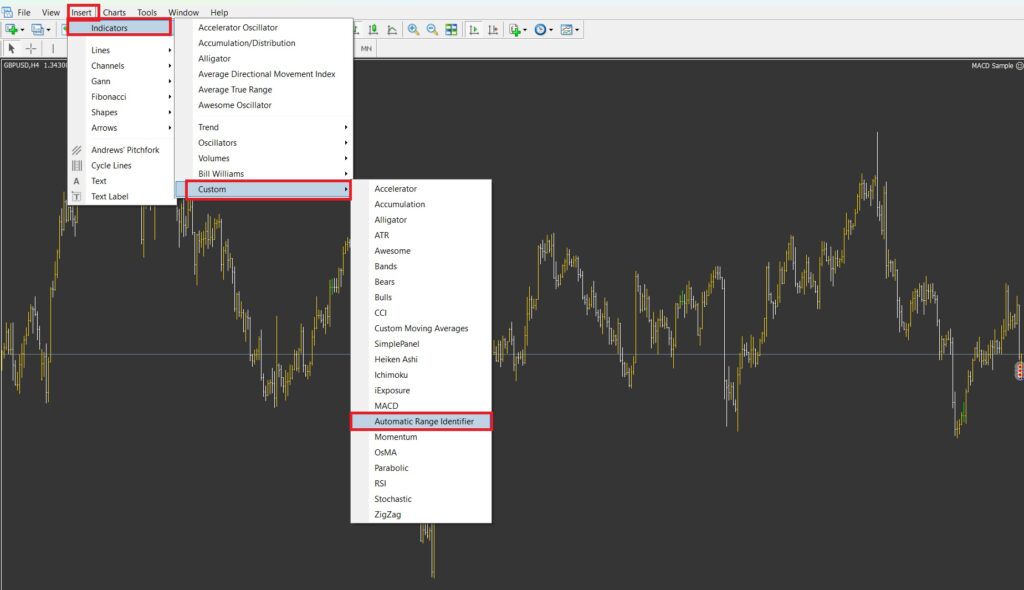
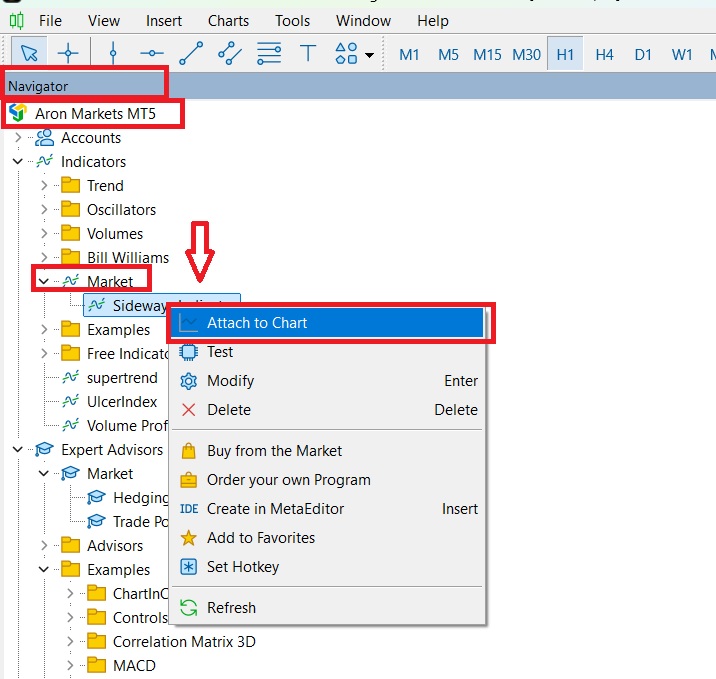
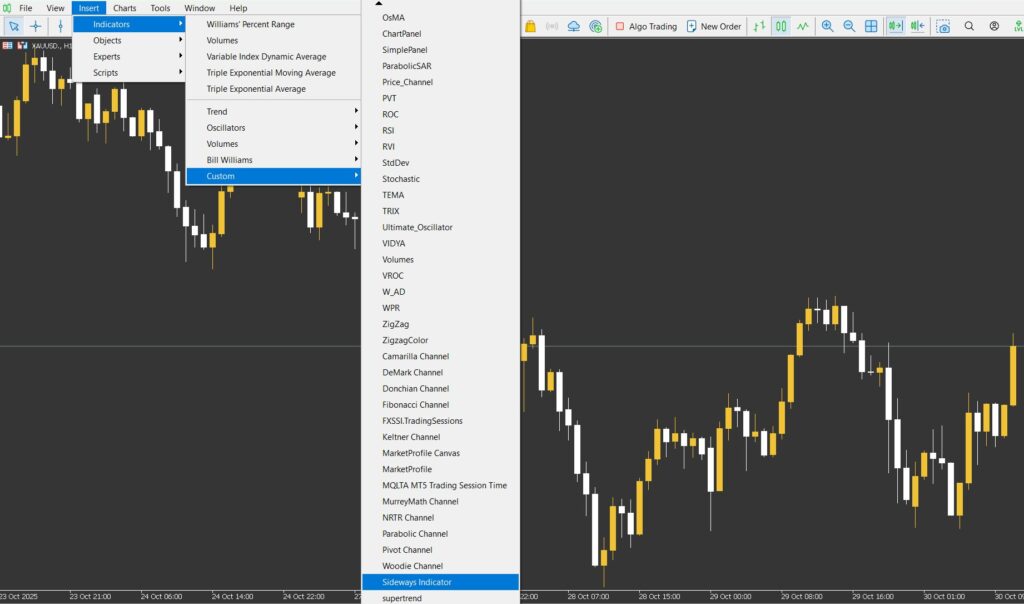
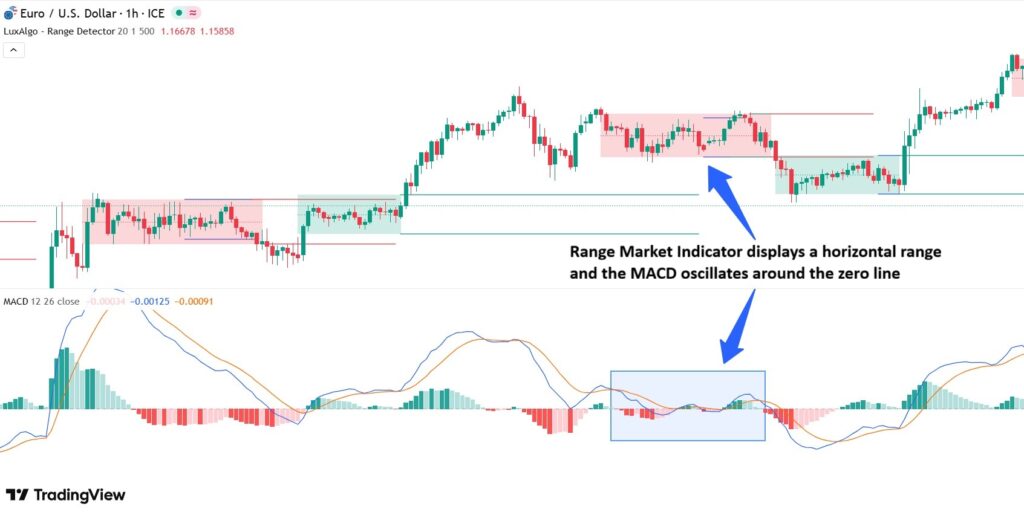
  • The biggest mistake most traders make is entering a trade without first identifying the market condition. The Range Market Indicator is designed specifically to help you determine whether the market is trending or consolidating.
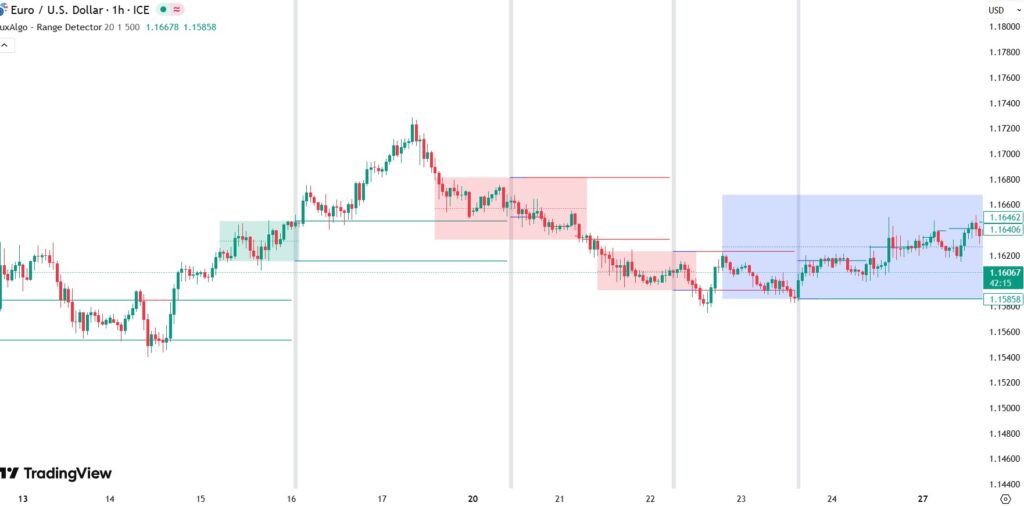
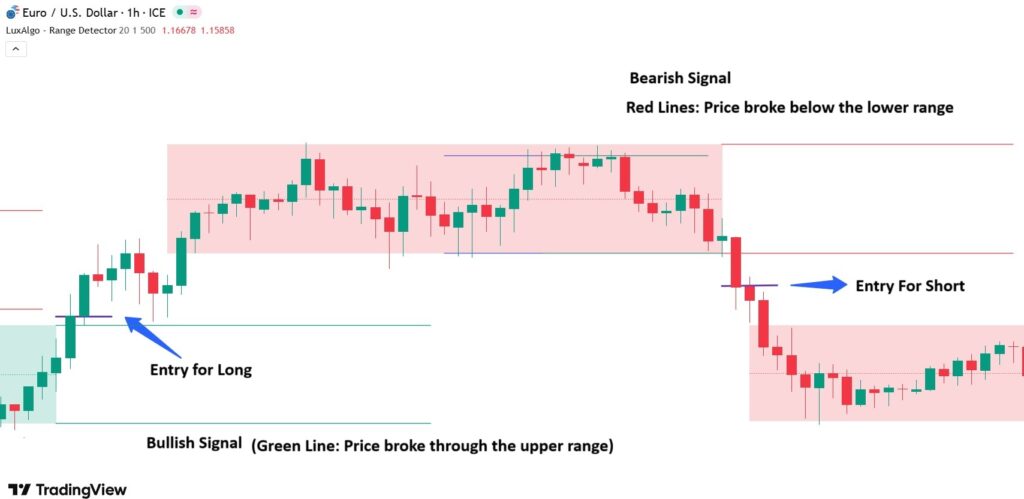
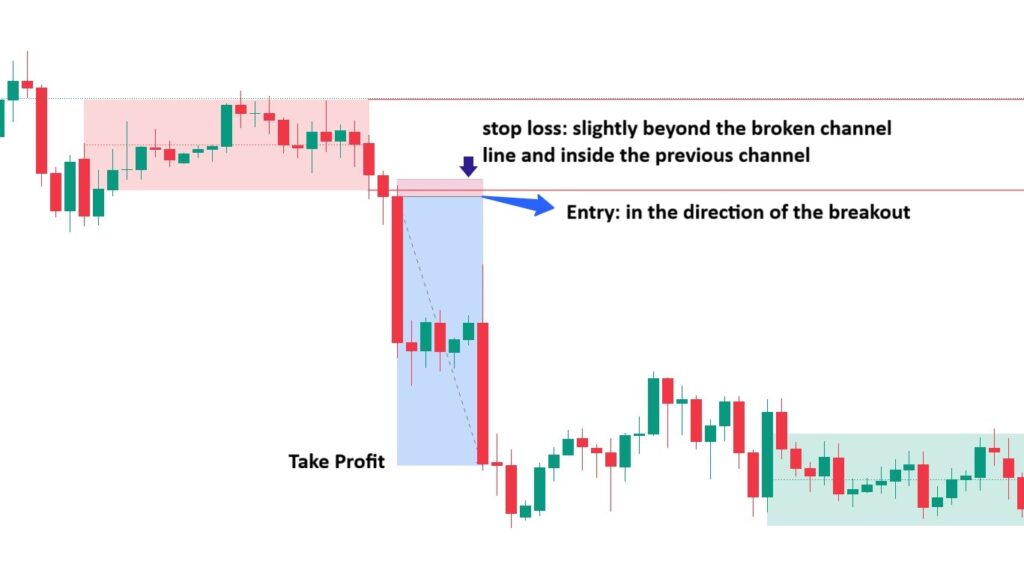
  • Always allow the Range Indicator to confirm the breakout before entering a position in the direction of the move. Acting only after confirmation helps you avoid false breakouts and trade with higher confidence.
  • Recognizing a ranging market means understanding the true cycle of price movement. A trader who can identify when the market is resting will always be better prepared for the next trend than those who cannot.

What Is a Range Market and Why Should You Recognize It?

According to Babypips, a Ranging Market (also known as a Sideways Market or Neutral Market) is one of the three primary market conditions in technical analysis. In this phase, the price fluctuates between two horizontal levels of support and resistance, without showing a strong bullish or bearish trend. Essentially, the market moves within a horizontal channel, indicating equilibrium between buyers and sellers.

Why Is It Important to Identify a Range Market?

Here are several key reasons why recognizing a range market is crucial for traders:

  • More Accurate Risk Management:
    When you know the market is in a range phase, you can avoid opening large positions and instead reduce your trade size, minimizing exposure to unpredictable moves.
  • Strategy Optimization:
    During range-bound conditions, strategies such as range trading, mean reversion, and scalping tend to deliver better results. In contrast, trend-following strategies are generally less effective in these environments.
  • Identifying the Right Time to Enter a New Trend:
    A breakout from a range is often the first signal of a new trend forming. If you can accurately identify accumulation and distribution phases, you can position yourself early in major market moves, before momentum picks up.
  • Preventing Emotional Trading:
    Understanding that the market is in a neutral phase helps you avoid impulsive decisions and emotion-driven entries, keeping your trading plan disciplined and data-driven.


What Is a Range Detection Indicator?

Manually identifying range-bound zones would be challenging, especially on lower timeframes or with highly volatile assets. This is where the Range Detection Indicator plays a crucial role.

A range trading indicator typically uses metrics such as Average True Range (ATR), volatility, and trend strength to automatically highlight range zones on the chart. It helps traders identify when the market is consolidating or preparing for a breakout.
This tool visually marks range areas on the chart using bands or color-coded zones, allowing traders to instantly see where price movement is neutral and where potential breakout opportunities may emerge.

best indicator for range trading​
sms-star

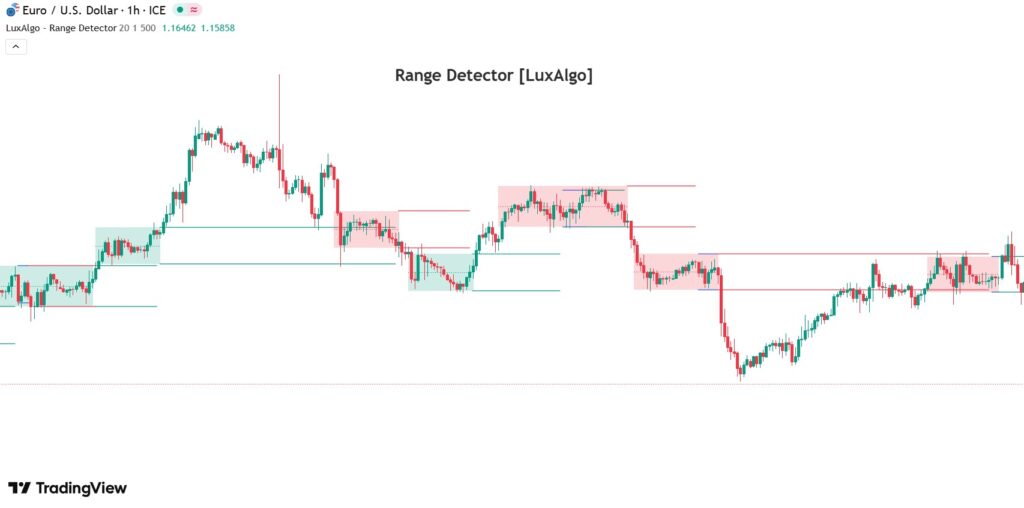
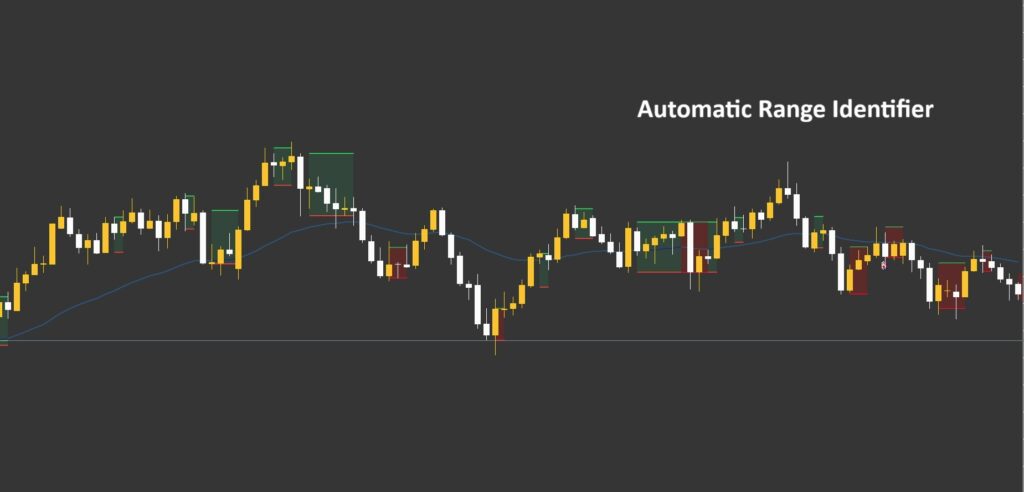
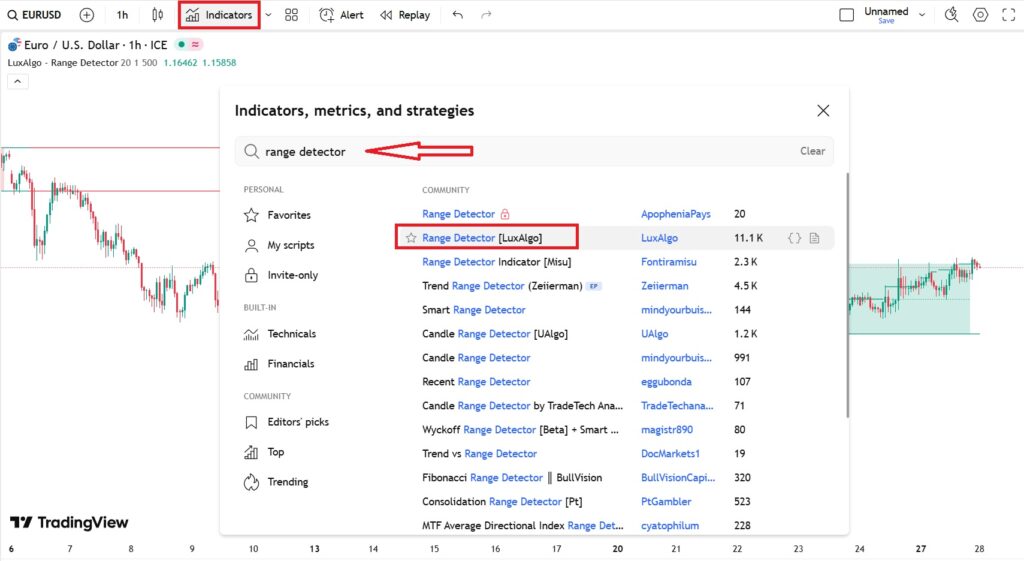
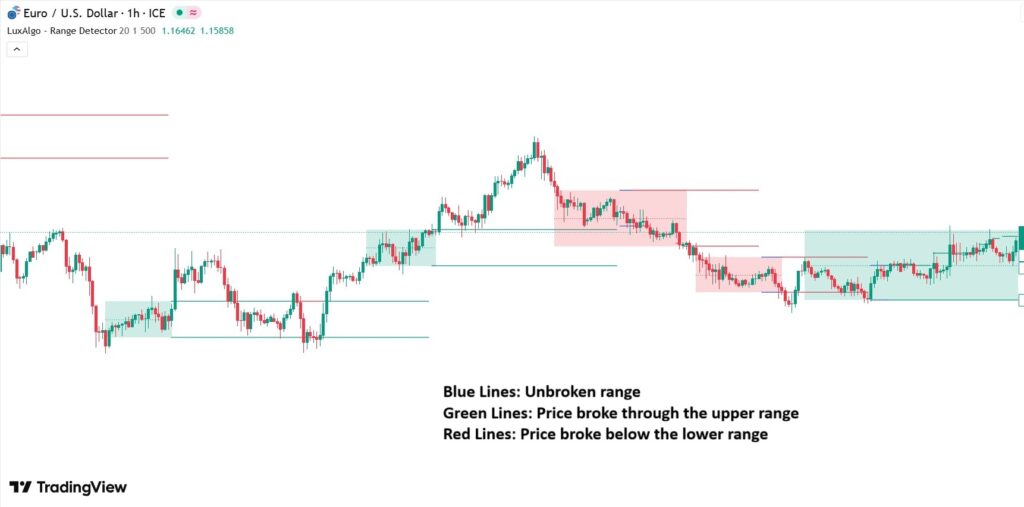
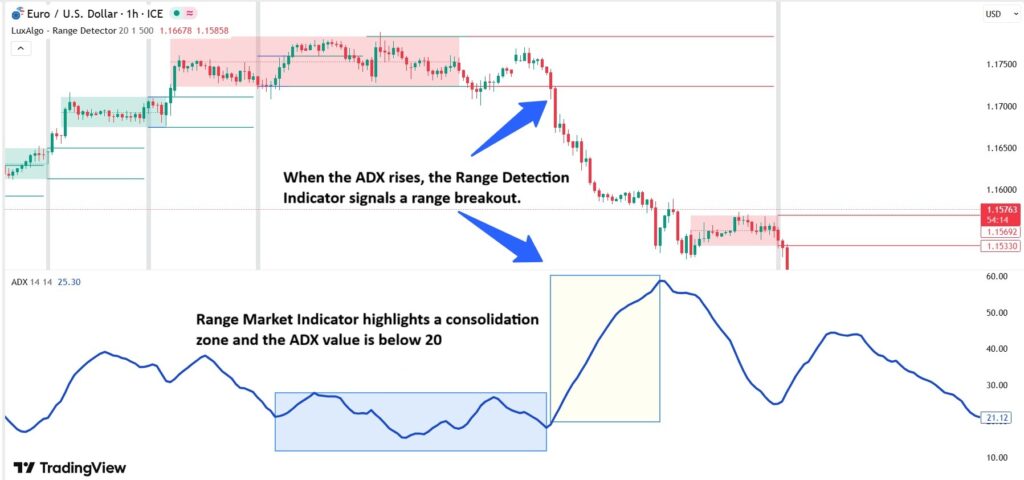
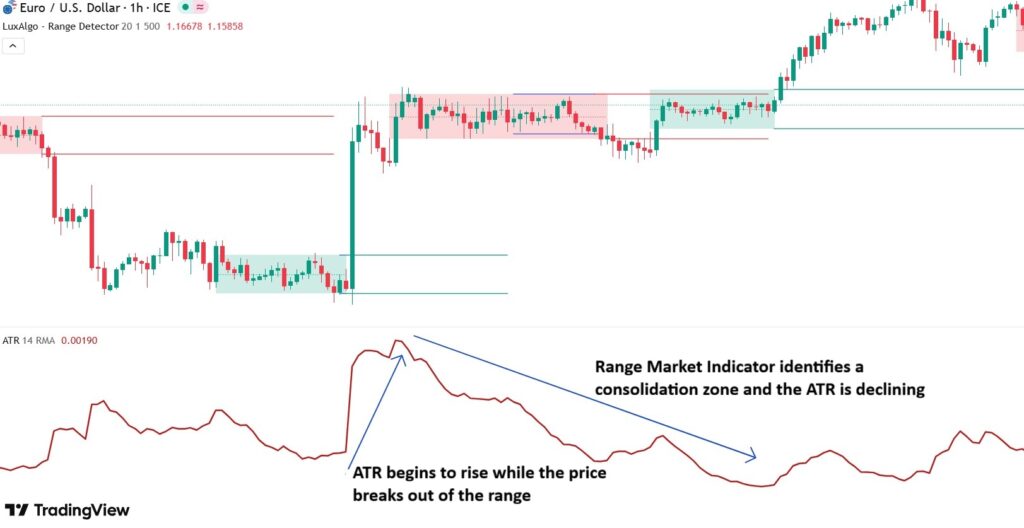
Range detection indicators often operate based on a core principle: as long as the market stays within a defined price range, it is considered to be in a ranging phase. Once price gains enough momentum to break out of that range, a trend begins to form.

How to Activate and Configure the Range Detection Indicator in MetaTrader and TradingView

To activate the Range Detection Indicator in MetaTrader and TradingView, follow the steps below.

Activating and Configuring the Range Detection Indicator in MetaTrader

To download and install the Range Market Indicator in MetaTrader 4 (MT4) or MetaTrader 5 (MT5), follow these steps:

In MetaTrader 4 (MT4)

MetaTrader 4 offers several free indicators designed to identify ranging market conditions. One of the most popular options is the Automatic Range Identifier.
  • Open the MQL5 website.
  • Go to the “Market” tab.
  • Search for “Automatic Range Identifier.”
best indicator for range trading​
  • Click on the Download button to launch MetaTrader 4.
  • Then, log in to your trading account to complete the setup process.
How to Identify Sideways Trends Using a Range Market Indicator
  • Once you log in to your account, the indicator will be automatically added and installed in MetaTrader.
  • Next, navigate to View → Indicators → Custom, and locate the Range Market Identifier indicator from the list.
best indicator for range trading​
  • Click on the indicator name. In the window that appears, you can adjust the settings according to your preferences.
  • Finally, click OK to add the indicator to your price chart.
How to Identify Sideways Trends Using a Range Market Indicator
best indicator for range trading​

In MetaTrader 5

Unlike MetaTrader 4, MetaTrader 5 does not offer a built-in free range detection indicator. However, tools such as Range Detector by LuxAlgo are available on the MQL Market, which can be easily purchased and added to the MetaTrader platform.

  • First, download the indicator file from the MQL Market.
How to Identify Sideways Trends Using a Range Market Indicator
  • Next, open MetaTrader 5, and from the Navigator → Indicators menu, right-click on the indicator’s name.
  • Then, select Attach to Chart, close MetaTrader, and reopen it to complete the installation.
best indicator for range trading​
  • Now, from the View → Indicators → Custom menu, locate the Range Detector by LuxAlgo indicator and double-click on it to add it to your price chart.
best indicator for range trading​

Activating and Configuring the Range Detection Indicator in TradingView

  • First, open your price chart.
  • Then, go to the Indicators tab.
  • In the search bar, type “Range Detector”, and select Range Detector (LuxAlgo) from the list to add it to your chart.
best indicator for range trading​

Range market indicators typically display two horizontal lines that represent the upper and lower boundaries of a ranging market.

According to LuxAlgo, the Range Detector indicator provides a clear visual representation of range-bound zones in the market in the following way:

  • The upper line of the indicator acts as a resistance level, while the lower line serves as support.
  • The range boundary lines extend to the right side of the price chart, allowing them to be used as historical support and resistance levels if needed.
  • The vertical gray lines in the background indicate the exact moments when the indicator detects a ranging market, and the horizontal dashed line marks the midpoint of the range.
How to Identify Sideways Trends Using a Range Market Indicator

How to Trade Using the Range Market Indicator

In the Range Detection Indicator:

  • When the price approaches the upper line but fails to break above it, there is a high probability of a reversal to the downside. Conversely, when the price approaches the lower line, it often indicates a potential bounce to the upside. (Blue lines)
  • If the price breaks above the upper boundary, it signals a possible bullish breakout and the beginning of an uptrend. (Green lines)
  • If the price falls below the lower boundary, it indicates a potential bearish breakout and the start of a downtrend. (Red lines)

Based on these principles, the following section explains how to trade effectively using the Range Market Indicator.

best indicator for range trading​
sms-star

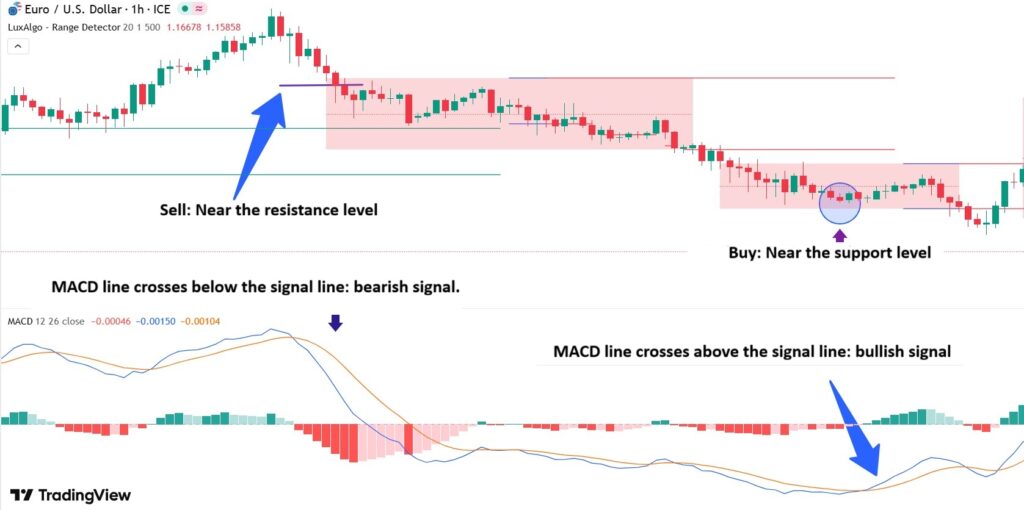
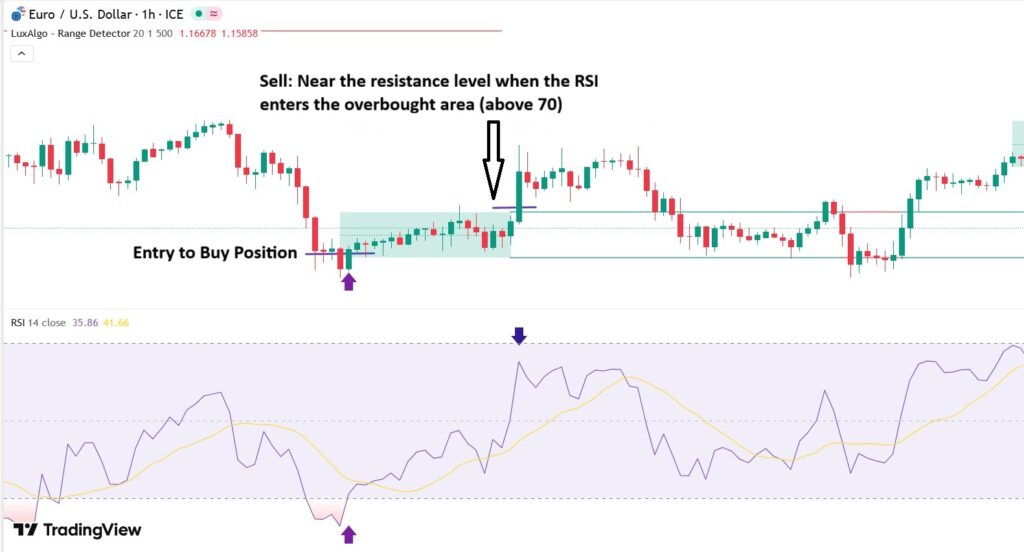
To confirm the signals generated by the range market indicator, it’s recommended to use additional tools such as other technical indicators, price action analysis, and trading volume.

Identifying Entry and Exit Points Using the Indicator

For traders, one of the biggest challenges in sideways or neutral markets is determining the right time to enter or exit a position. Range detection indicators, by measuring price volatility and price compression, help identify areas where the market is in a state of balance or consolidation.

Once the range boundaries are defined, two main trading opportunities typically arise:

  • Range-bound Trading, where traders capitalize on price fluctuations between support and resistance levels.
  • Breakout Trading, which focuses on capturing strong price movements that occur after the price breaks out of the consolidation zone.

Below, we’ll explore each approach in detail.

Range-bound Trading

In range-bound trading, the best entry points for long trades (or exits for short trades) are usually found near the lower support level of the range, while the best exit points or short entries occur near the upper resistance level.
For instance, if the indicator shows that the price is approaching the upper boundary while buying momentum is weakening, it can serve as a signal to exit long positions or consider short entries. Conversely, when the price approaches the lower end of the range, the likelihood of a price reversal increases, presenting a potential buying opportunity.

best indicator for range trading​

Breakout Trading

When the indicator confirms a valid breakout, you can open a position in the direction of the breakout.

best indicator for range trading​

Setting Stop Loss and Take Profit Levels in Range Trading

One of the most important principles in range-bound trading is maintaining strict risk management, as false breakouts (fake breakouts) are quite common in this type of market.

To set stop loss and take profit levels in range trading:

  • The stop loss should be placed slightly below the support level (for long positions) or slightly above the resistance level (for short positions). This helps limit potential losses in the event of a genuine breakout.
  • The take profit target is usually set at the opposite boundary of the range — meaning, if you enter a buy trade near the bottom, you should take profit near the top of the range.
  • The risk-to-reward ratio should be at least 1:2, ensuring that your trades remain profitable over the long term.
best indicator for range trading​

To set take profit and stop loss levels during a channel breakout:

  • First, wait for the candle to close and confirm the breakout.
  • Once the next candle begins, enter a trade in the direction of the breakout (as shown below with a short position).
  • Place the stop loss slightly beyond the broken channel line (in this case, just above the lower boundary) and inside the previous channel.
  • Set the take profit target at up to twice the width of the channel.
best indicator for range trading​
sms-star

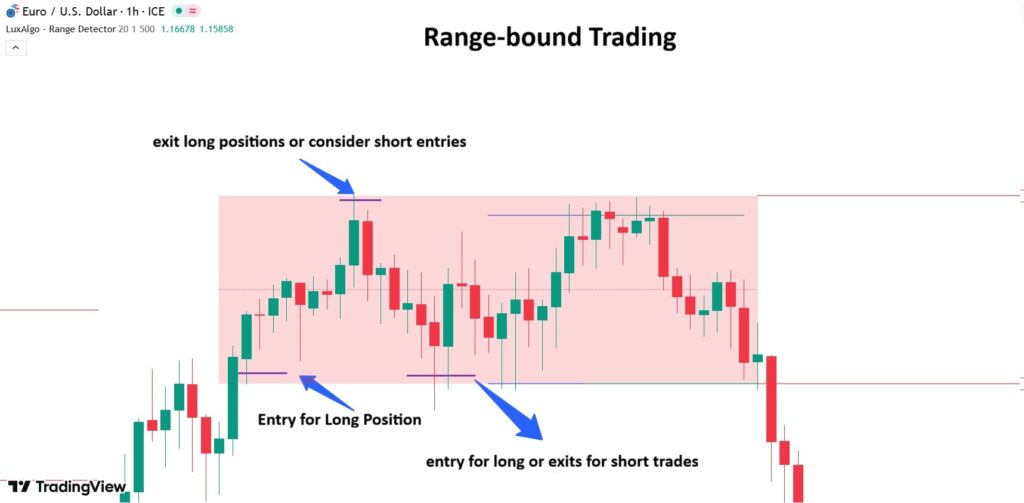
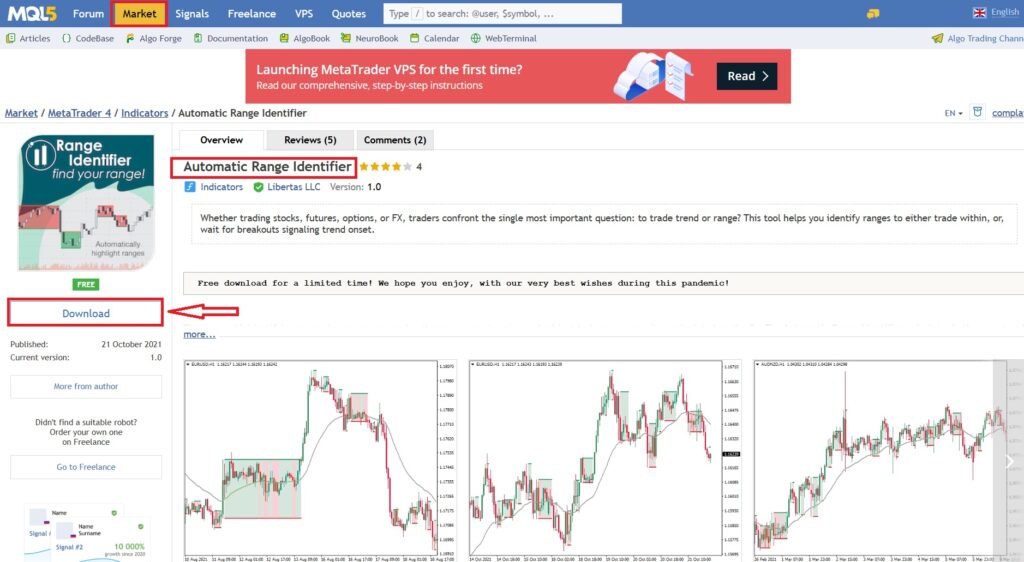
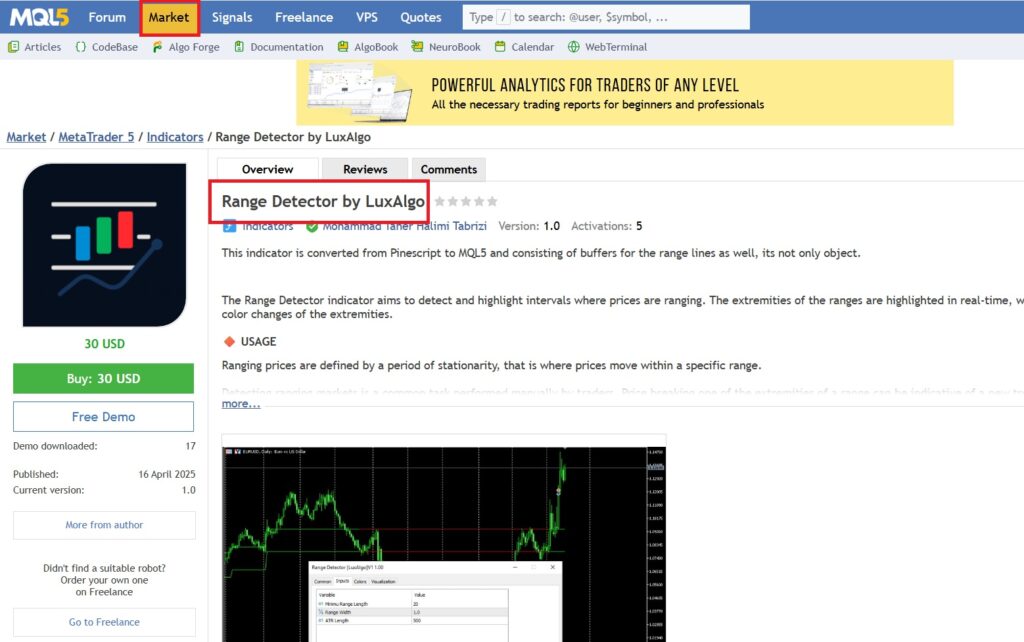
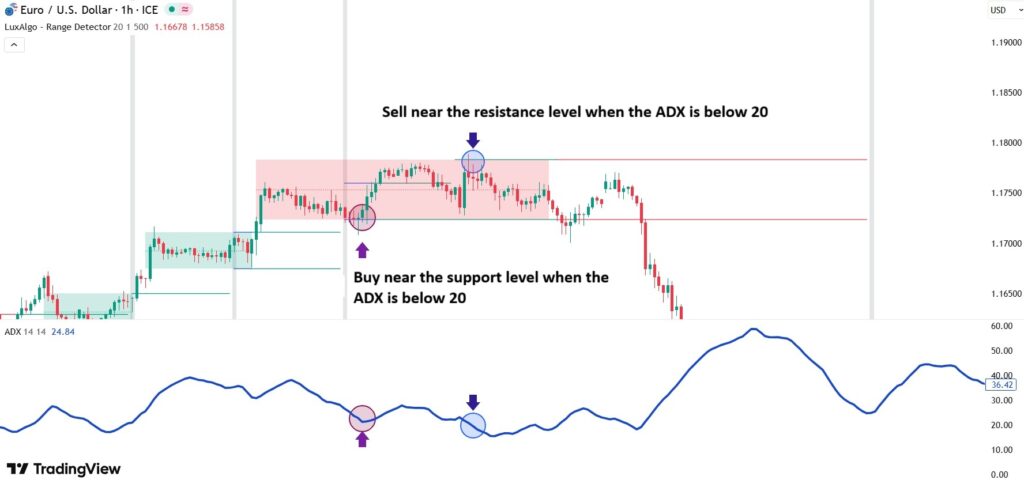
A successful trader is someone who knows when to trade and, more importantly, when not to trade. The Range Detection Indicator is specifically designed for this purpose.

Combining the Range Detection Indicator with Other Indicators

Using multiple indicators simultaneously helps traders receive stronger and more reliable trading signals. This approach reduces the likelihood of false signals and improves the accuracy of technical analysis.
In the following section, we’ll explore how to combine the Range Detection Indicator with several other popular trading indicators to enhance your market analysis.

Combining the Range Market Indicator with the ADX Indicator

The ADX (Average Directional Index) is a tool used to measure the strength of a trend, without indicating its direction. High ADX values signal a strong trend, while low ADX values suggest a range-bound or weak market.

When combining the Range Market Indicator with the ADX indicator:

  • Identifying a Range Market: When the Range Market Indicator highlights a consolidation zone and the ADX value is below 20, it confirms that the market is range-bound.
best indicator for range trading​
  • Entry Points:
    · Buy near the support level when the ADX is below 20.
    · Sell near the resistance level when the ADX is below 20.
  • Exit Strategy:
    When the ADX starts to rise and crosses above 20, it may indicate that the market is breaking out of the range, signaling it’s time to exit the trade.
best indicator for range trading​

Combining the Range Market Indicator with the ATR Indicator

The ATR (Average True Range) is a tool used to measure market volatility. In range-bound markets, the ATR typically decreases, as the price movement remains limited within a narrow range.

  • When the Range Market Indicator identifies a consolidation zone and the ATR value is also declining, it suggests that the sideways movement is likely to continue.
  • However, when the ATR begins to rise while the price breaks out of the range, it indicates a high probability of a new trend forming.
best indicator for range trading​

Combining the Range Market Indicator with the MACD Indicator

One of the most popular tools for analyzing momentum and trend reversals is the MACD (Moving Average Convergence Divergence) indicator. In range-bound markets, the MACD histogram typically exhibits minor fluctuations, while the MACD and signal lines stay close to each other.

  • When the Range Market Indicator displays a horizontal range and the MACD oscillates around the zero line, it indicates that the market is in a neutral phase.
  • A price breakout from the range, accompanied by the MACD crossing above or below the zero line and forming positive or negative divergence, can serve as a signal for the beginning of a new trend.
best indicator for range trading​

When combining the Range Detection Indicator with the MACD indicator:

  • Identifying the Range Market:
    Use the Range Detection Indicator to determine the market’s consolidation zone.
  • Entry Points:
    Buy: Near the support level when the MACD line crosses above the signal line, indicating a bullish signal.
    Sell: Near the resistance level when the MACD line crosses below the signal line, indicating a bearish signal.
  • Exit Strategy:
    Exit the trade when the MACD line crosses the signal line in the opposite direction of your position.
  •  
best indicator for range trading​

Combining the Range Market Indicator with the RSI Indicator

The RSI (Relative Strength Index) is a powerful tool for identifying overbought and oversold zones. In range-bound markets, the RSI typically fluctuates between 30 and 70 in a consistent pattern.

When combining the Range Market Indicator with the RSI indicator:

    • Identifying the Range Market:
      Use the Range Market Indicator to detect the market’s consolidation zone.
  • Entry Points:
    • Buy: Near the support level when the RSI reaches the oversold area (below 30) and starts moving upward.
    • Sell: Near the resistance level when the RSI enters the overbought area (above 70) and begins to move downward.
  • Exit Strategy:
    Exit the trade when the RSI approaches the opposite extreme — around 70 for buy trades and 30 for sell trades.
How to Identify Sideways Trends Using a Range Market Indicator

Combining the Range Market Indicator with the Bollinger Bands Indicator

The Bollinger Bands indicator is a dynamic tool used to measure market volatility and price range. In range-bound markets, the bands typically contract, whereas during breakouts, they expand sharply.

When the Range Market Indicator identifies a range and the Bollinger Bands are in a tight (compressed) state, it suggests that the market is gearing up for a significant move.
A price breakout from the detected range, accompanied by widening bands, signals the start of a strong directional movement.

When combining the Range Market Indicator with Bollinger Bands:

  • Identifying the Range Market:
    First, identify the market’s range zone using the Range Market Indicator.
  • Entry Points:
    Buy: Near the support level when the price touches the lower Bollinger Band and starts moving upward.
    Sell: Near the resistance level when the price reaches the upper Bollinger Band and begins to move downward.
  1.  
  • Exit Strategy:
    Exit the trade when the price approaches the opposite band, or when the bands start to expand in the opposite direction of your trade.
best indicator for range trading​
sms-star

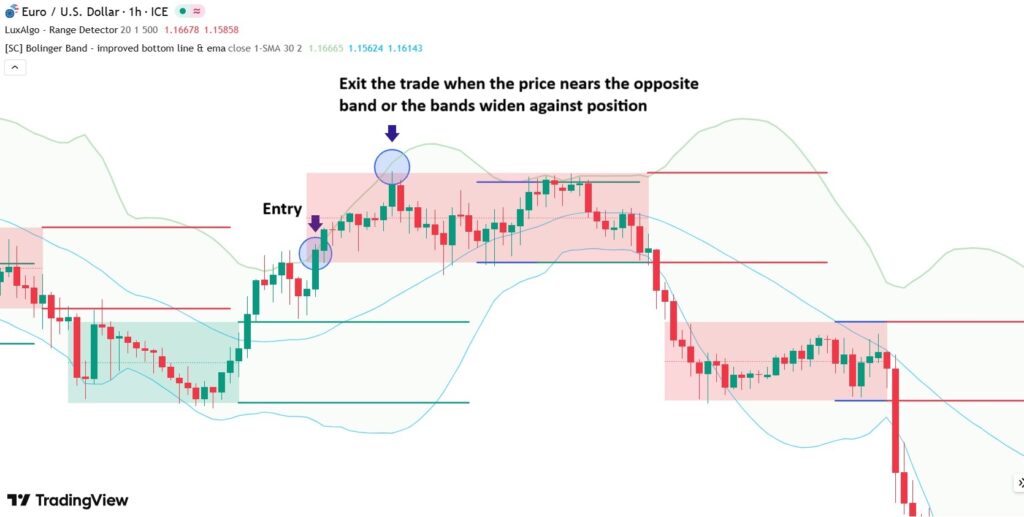
When the Bollinger Bands tighten (squeeze), it signals decreasing volatility and a potential strong price movement ahead. If this squeeze occurs within a range, it may indicate that the range phase is nearing its end.

Conclusion

The Range Detection Indicator is a practical tool for identifying neutral phases in the market, helping traders avoid emotional entries and high-risk trades during non-trending conditions. Combining this indicator with tools such as ADX, ATR, MACD, RSI, and Bollinger Bands can significantly enhance analysis accuracy and improve trading decisions.

Continue Reading
not-found
calendar 11 November 2025
Rate this article

Leave a Reply

Your email address will not be published. Required fields are marked *

No thanks