


The Bill Williams strategy is an analytical system that targets not only market behavior but also the trader’s mindset. Bill Williams, a market analyst and psychologist, believed that most trader errors stemmed not from weak technical analysis but from a lack of awareness of their own mental and emotional mechanisms. By combining “Chaos Theory,” market psychology, and several proprietary indicators, he designed a model to help traders discover the hidden order behind market volatility.

- The Bill Williams strategy is designed based on Chaos Theory and market psychology.
- This strategy yields its best results in trending markets and on higher time frames.
- Proper risk management and practice on a demo account are essential for success with this strategy.
- Combining signals from multiple indicators within this strategy helps increase trading accuracy.
Introduction to Bill Williams and His Trading Philosophy
Bill Williams was a pioneer in integrating psychology with technical analysis. He believed that to succeed in the market, mastering one’s mind and emotions was just as important as understanding charts. This is because the market is a reflection of human behavior: complex, emotional, and yet, driven by repeating patterns.
Bill Williams’ Life and Achievements
Bill Williams (1932-2019) was one of the most influential thinkers in the field of market analysis. In the 1990s, Williams introduced his proprietary indicators, including the Alligator indicator, the Awesome Oscillator, and the Fractal indicator, which fundamentally changed how price action was analyzed.
His goal was to enable traders to understand the market’s internal structure and base their decisions on the hidden order found within seemingly random fluctuations. Interestingly, Williams was a psychologist before he was a trader. This psychological background led him to take the trader’s mind as seriously as he took charts and prices.
Principles of Market Psychology According to Bill Williams
In Williams’ view, the market is a mirror of human emotions. Fear, greed, hope, and doubt are the primary drivers of every price movement. He therefore placed market psychology as the central pillar of his analysis.
He proposed several key principles:
- Markets are mostly range-bound or lack a clear trend. They only enter genuine trends about 20% to 30% of the time. Consequently, the most significant profits are made when the market enters a trending phase.
- A trader must be patient. Instead of entering a trade on every minor move, one must wait for the moment the market “wakes up”, a term Williams used for the beginning of a strong trend.
- Emotional control is more important than strategy. Fear of loss or greed for more profit often leads to hasty decisions. A successful trader is one who acts based on their system’s rules, not on momentary feelings.
In essence, Williams saw the market not as a battlefield between buyers and sellers, but as an arena where human psychologies collide. To survive in this arena, one must keep their mind more organized than the chart.
The Concept of Order and Chaos (Chaos Theory) in Financial Markets
The philosophical core of Bill Williams’ thinking is Chaos Theory. He imported this theory from physics and mathematics into economics, stating that complex systems, despite their apparent disorder, follow hidden and repetitive patterns.
He believed the market is a non-linear system; this means small changes in trader sentiment can lead to large, unexpected price movements. This is what is known in physics as the “Butterfly Effect,” where the flapping of a butterfly’s wings in one place can create a storm in another.
Based on this perspective, Williams concluded that if the market is truly chaotic, then traditional, linear methods of analysis like moving averages or trend lines are insufficient on their own. Instead, he used indicators that could reveal the hidden order within the chaos.
One direct result of this theory was the introduction of Fractals to market analysis, repeating patterns that are visible across all time frames, from the one-hour chart to the monthly chart. According to Williams, if we can identify these self-repeating structures, we can predict the market’s future behavior with a higher probability.

However complex and unpredictable the market may seem, it has an inner order at its core. But only a trader whose mind is sufficiently calm, organized, and prepared can see it.
Core Components of the Bill Williams Strategy
The Bill Williams strategy consists of several key indicators, each of which analyzes a specific part of market behavior.
| Indicator | Primary Role in the Strategy |
|---|---|
| Alligator Indicator | Identifying the trend's state and direction (market sleeping, waking, or feeding) |
| Awesome Oscillator (AO) | Measuring the trend's acceleration and strength (market momentum) |
| Accelerator/Decelerator (AC) Indicator | Measuring changes in acceleration (early warning for trend strengthening or weakening) |
| Fractal Indicator | Identifying key entry and exit points (clear tops and bottoms) |
The Alligator Indicator for Trend Identification
The Alligator indicator is one of the most famous tools designed by Bill Williams and plays an important role in identifying different market phases. This indicator uses three smoothed moving average lines to help traders understand if the market is “sleeping,” “waking,” or “feeding.” In simpler terms, it shows whether a trend is underway or if the market is in a stationary, ranging condition.
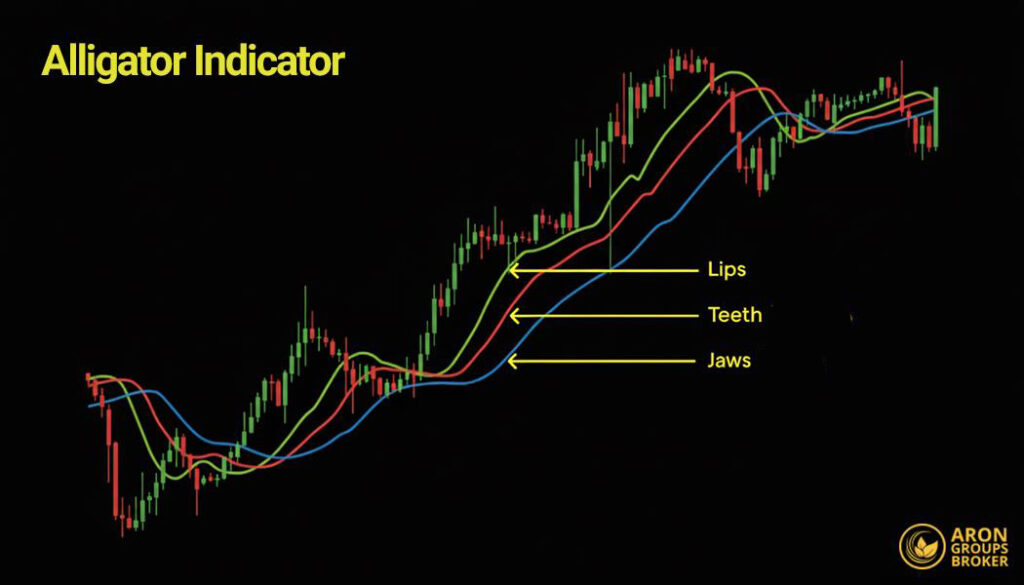
When the Alligator’s lines are intertwined, it indicates the market lacks a clear trend. But when its “mouth” opens, meaning the lines diverge, it signals the start of a new trend. The wider the separation between the lines, the greater the trend’s strength.
The Alligator is, in effect, a visual tool for identifying the right time to enter the market and avoiding aimless trades in ranging conditions. The Alligator tells the trader when the market is truly "alive" and worth entering. Many professional traders only enter the market when the Alligator's mouth is open.
The Awesome Oscillator (AO) for Identifying Market Momentum
The Awesome Oscillator (AO) is used to measure the market’s momentum, or the strength of its movement. This indicator is displayed as a histogram below the chart and shows the trader whether the current market trend is strengthening or weakening.
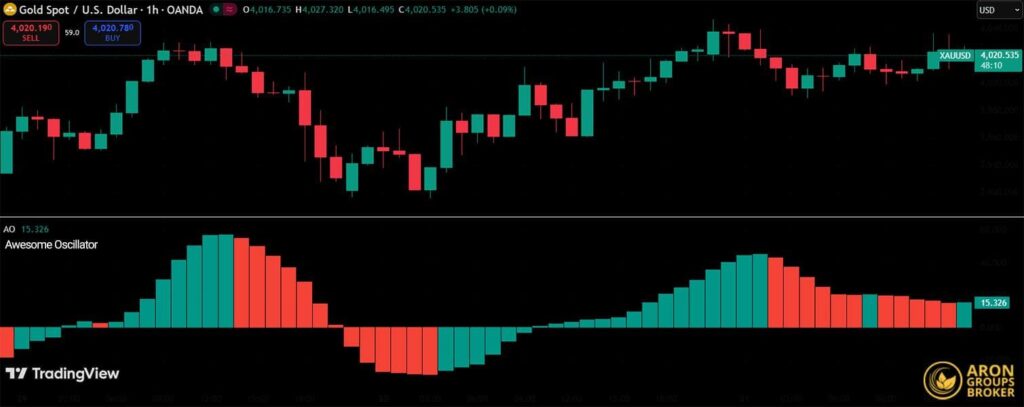
When the AO’s value is positive and the bars are green, it means buyers are in control of the market and upward momentum is present. Conversely, negative values or red bars indicate increasing selling pressure and a loss of upward strength.
In practice, traders use the AO indicator to confirm the trend’s strength, identify divergences, and time their market entries or exits. Combining it with other Bill Williams indicators, such as the Alligator or Fractals, creates more reliable signals.
The AO indicator is like a car's engine. It doesn't tell you where to go, but it shows you how much power you have to reach your destination.
The Accelerator/Decelerator (AC) Indicator for Confirming Price Movement
The AC (Accelerator/Decelerator) indicator is used to detect changes in the market’s acceleration. If the AO shows which direction the market is moving, the AC indicator specifies whether the power or speed of that movement is increasing or decreasing.
In effect, the AC helps the trader identify the early signs of trend weakness or strengthening, often before the price changes direction. Green bars on this indicator usually represent growing buyer strength, while red bars signal a slowdown or an increase in selling pressure.
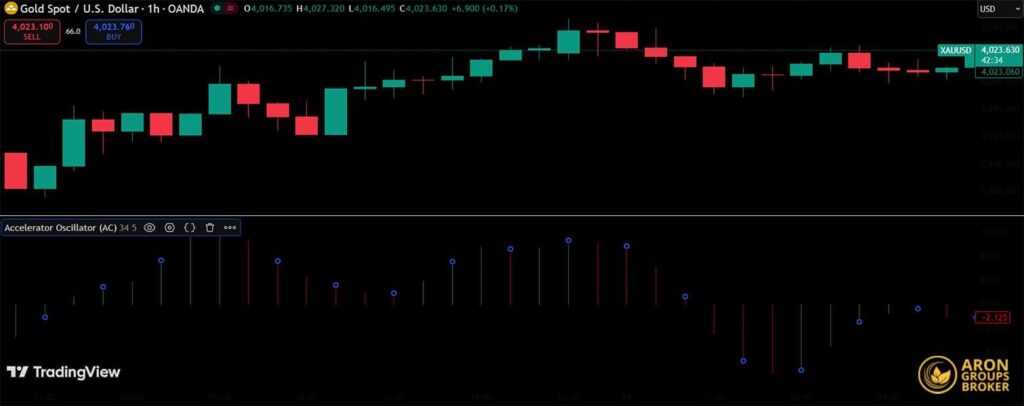
In short, the AC is considered complementary to the AO and is most accurate when used alongside the other indicators in the Bill Williams strategy, such as the Alligator and Fractals.
How to Combine the Indicators for Comprehensive Analysis
The primary strength of the Bill Williams strategy lies in the harmony between its indicators. None of these tools provides a complete picture of the market on its own, but when combined, they offer a coherent and precise view of the market’s trend status and momentum.
In this system, each indicator has a specific role:
- Alligator Indicator: Defines the trend status and the current market phase.
- AO Indicator: Measures the strength and direction of the price movement.
- AC Indicator: Confirms whether market acceleration is increasing or decreasing.
- Fractal Indicator: Reveals precise entry and exit points.
In simple terms, the Alligator shows the path, the AO measures the strength of the move, the AC warns of potential changes, and the Fractals specify the time to act.
If one of these tools is out of sync, it’s like an orchestra with one instrument playing out of rhythm. But when they are all in harmony, the Bill Williams system performs like precise, flowing music, resulting in informed, lower-risk trading decisions.
Here is the translation in a smooth, finance-market-related context:
Practical Application of the Bill Williams Strategy
The Bill Williams strategy acts as a detailed roadmap, helping the trader make systematic, emotion-free decisions from the trend-spotting phase through to the market exit. This system relies not only on chart analysis but also engages the trader’s logic and mental discipline.
Proper implementation involves three main steps:
- Identifying the trend;
- Finding entry and exit points;
- Risk management.
Identifying the Main Trend and Price Corrections
In the first step, you must determine the market’s current state. Is it trending, or is it oscillating within a range?
The primary tool for this diagnosis is the Alligator indicator.
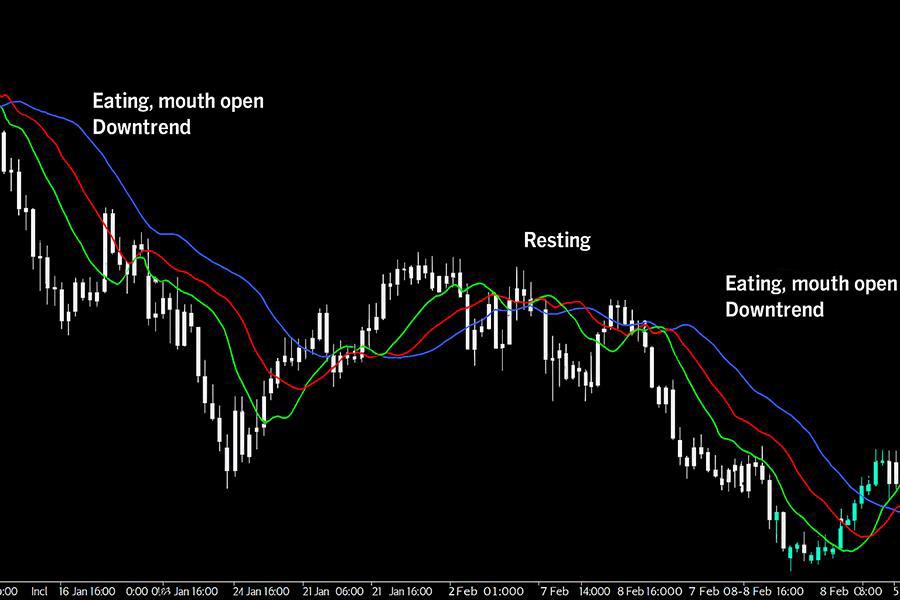
- When its three lines (Jaw, Teeth, and Lips) are close together and nearly horizontal, the market is in a stationary state (or “sleeping”), and entering a trade is generally not favorable.
- However, when the lines diverge, especially if they move in the same direction, it can signal the beginning of a new trend.
To confirm the trend’s direction and strength, the Awesome Oscillator (AO) is used.
- If its value is above the zero line, an uptrend is in progress.
- If it is below zero, a downtrend is confirmed.
- Additionally, changing bar colors and a gradual shift in momentum, or double tops, often signal the beginning of a new move.
Next, the AC (Accelerator/Decelerator) indicator plays a confirmatory role.
- Green bars above the zero line indicate increasing market acceleration.
- Red bars below the zero line signal a weakening trend.
In summary, these three tools, Alligator, AO, and AC, act as three sequential filters. Each one clarifies a part of the picture, ensuring you ultimately enter the market only when a genuine, powerful trend is in progress.
Before entry, ensure the Alligator is "awake" (its mouth is open), the AO and AC are aligned in the same direction, and the market has broken out of its range.
Determining Optimal Entry and Exit Points
The right entry timing is the difference between a profitable trade and a losing position. Bill Williams used the Fractal indicator for this purpose. Fractals are five-bar patterns that identify clear market tops and bottoms.
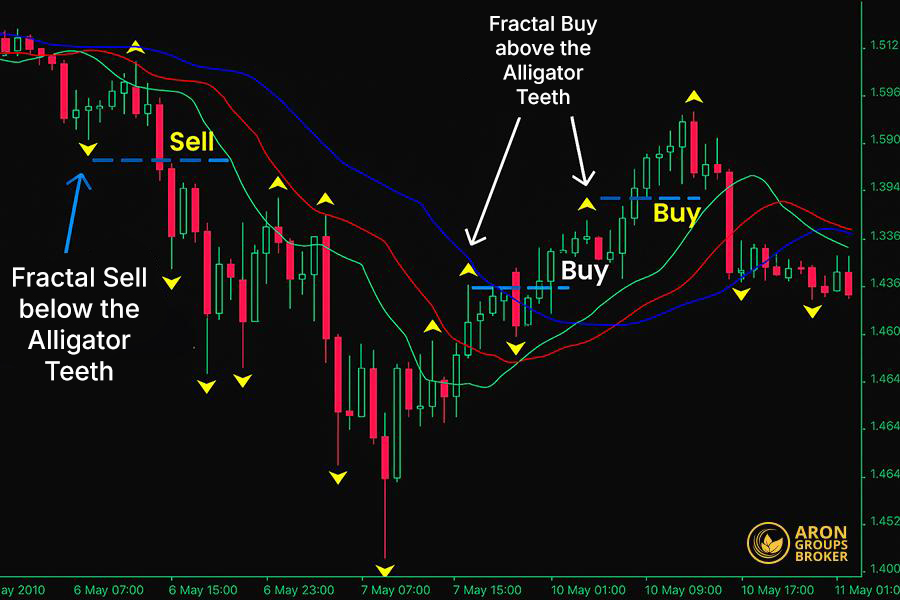
- In an uptrend, an entry is made when the price breaks above a bullish fractal (which should be above the Alligator).
- In a downtrend, an entry is appropriate when the price breaks below a bearish fractal (below the Alligator).
If you want additional confirmation, combining the AO and AC increases entry precision. For example, when both are above the zero line and rising, the probability of a successful long (buy) entry is higher.
For exiting, there are two primary methods:
- Exit using the Alligator: In a long trade, when the green line (Lips) crosses below the red line (Teeth), it can be a sign that the trend is ending.
- Exit using AO and AC: If one of these two indicators changes direction, or if the AO crosses the zero line against the direction of your trade, it is best to exit the market or secure profits.
Risk Management and Position Sizing
No strategy is complete without risk management. Bill Williams emphasized that every trade must, from the outset, have a stop-loss, a take-profit target, and a plan for a gradual exit.
Setting the Stop-Loss
- Using the Alligator: For a long trade, the stop-loss should be placed slightly below the Jaw (blue line).
- Using Fractals: You can place the stop-loss at the level of the opposing fractal, as these points often represent boundaries where the market direction changes.
Position Sizing
The size of your trade must be proportionate to your risk tolerance. The general rule is not to risk more than 1% to 2% of your total capital on any single trade.
A simple formula for calculating position size is:
Position Size = (Allowable Risk % × Total Capital) ÷ (Distance from Entry to Stop-Loss)
Managing Profits and Trailing the Stop-Loss
When the market moves in the direction of your trade, you can lock in profits using a trailing stop (moving stop-loss). The Alligator is a good guide for this; simply move the stop-loss along this indicator’s lines as the trend progresses.
Educational Resources and Books by Bill Williams
A complete understanding of the Bill Williams strategy is not possible without studying his original and official resources. Over his decades-long career, he produced a collection of books and practical training materials that are still recognized as authoritative references among professional traders worldwide.
Bill Williams’ Main Books
- “Trading Chaos: Maximize Profits with Proven Technical Techniques.” This book is Bill Williams’ first and most important work, forming the intellectual foundation of his entire system. In it, he first introduced the theory of “Chaos in financial markets” and explained how the hidden order within seemingly random price movements could be discovered.
- “New Trading Dimensions: How to Profit from Chaos in Stocks, Bonds, and Commodities.” This book continues the intellectual path of the first. In this volume, Williams goes into greater detail regarding the fractal structure of markets and more advanced trading methods. He demonstrates how the concepts of Chaos can be practically applied in various markets, from stocks and bonds to commodities and Forex.
Both books have also been revised and updated by his daughter, Justine Williams, to make the concepts more compatible with today's financial markets.
Online Resources for Learning the Bill Williams Strategy
- TradingView: The TradingView website provides a professional environment to view and use all of the Bill Williams indicators. Users can activate indicators like the Alligator, AO, AC, and Fractals on live charts and analyze market changes in real-time.
- Investopedia: Investopedia is one of the most reputable educational resources in the financial sphere and has published a collection of analytical articles on the Williams indicators. These articles provide conceptual explanations as well as real-world examples of the indicators’ behavior in the market.
- BabyPips: If you are looking for simple, step-by-step learning, BabyPips is an excellent choice. This site explains the concepts related to Bill Williams’ indicators in straightforward language with visual examples.
Conclusion
The Bill Williams strategy is one of the most comprehensive and effective trading systems available. By combining Chaos Theory, market psychology, and technical analysis tools, it offers a coherent framework for trading.
Success with this strategy requires practice, patience, and proper risk management. Traders should first practice this strategy on a demo account and, after gaining sufficient skill, use it in a live account.
Remember that no trading strategy is 100% accurate, and risk is always present in trading. Appropriate risk management and emotional control are the keys to long-term success.


