icon icon Home
icon icon Accounts
icon icon Quick start
icon icon Symbols

A Trader’s Guide to Candlestick Range Theory for Consistent Profits

Author
Abe Cofnas
Abe Cofnas
calendar Last update: 11 April 2026
watch Reading time: 13 min

Candlestick Range Theory (CRT) is a range-based price action model where you mark a higher-timeframe candle’s high/low, watch for a liquidity sweep outside that range, then look for price to re-enter and deliver a clean move (often back through the range) using multi-timeframe analysis. The idea is to avoid false breakouts, but are you defining a real range and waiting for confirmation, or are you forcing CRT onto random candles and calling every wick a setup?

bookmark
Key Takeaways
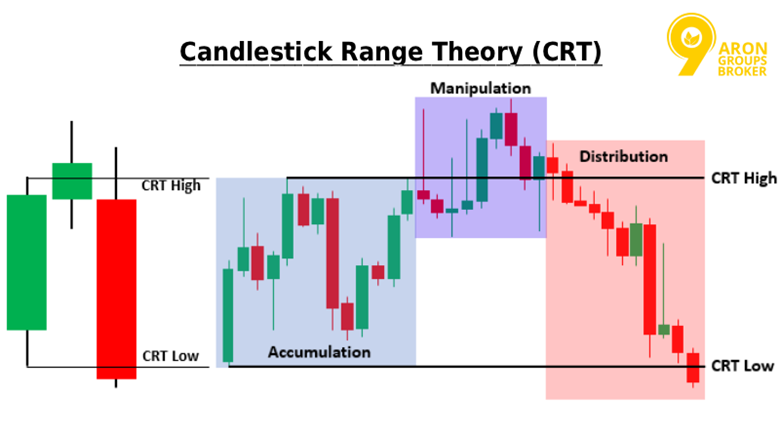
  • CRT is commonly described as trading around a defined candle range, often anchored on a higher timeframe (HTF), then refining entries on a lower timeframe.
  • The logic is range, then sweep (manipulation) , then re-entry, then delivery, which overlaps conceptually with Accumulation–Manipulation–Distribution (AMD) and Power of 3 (PO3) frameworks.
  • CRT is not traded every breakout. The edge is the failed breakout and the re-entry confirmation back inside the range.
  • Use structure filters like market structure shift (MSS) or Change of Character (ChoCh) to reduce low-quality signals (especially in chop).
  • CRT’s biggest failure case is a false range (poorly chosen HTF candle) or shifting boundaries (you keep redefining the range to fit price).
sms-star

Important note: CRT is a method for decision-making. It does not guarantee outcomes. Risk control remains non-negotiable.

Understanding Candlestick Range Theory (CRT)

MQL5 explains that CRT is easiest to understand as a container model. First, you define a valid range. Then you wait for price to grab liquidity outside it. Then you only act once price shows it cannot hold outside the range.

Candlestick Range Theory (CRT)

Core Principles of Candlestick Range Theory

These principles keep CRT practical:

  • Define a clear range first (usually an HTF candle’s high/low).
  • Expect a sweep (liquidity raid) above the high or below the low.
  • Wait for re-entry (price returns back into the range). That’s the key filter against false breakouts.
  • Use a lower timeframe structure to time entries (e.g., MSS/ChoCh, order block reaction).
sms-star

Tip: In CRT, outside the range is not the entry. It’s the trap-building zone.

Structure and Logic Behind the CRT Model

The underlying logic is straightforward:

  1. A range creates obvious highs/lows where stops and breakout orders cluster.
  2. Price often moves outside the range to access that liquidity.
  3. If price fails to accept outside and returns inside, you have information: the breakout attempt did not hold.

That is why CRT naturally pairs with concepts like liquidity sweeps and market structure shifts. You are not predicting. You are waiting for the market to show its hand.

How the CRT Trading Strategy Operates

In forex trading strategies, a CRT trade is best treated as a sequence. If you skip steps, you usually end up trading noise.

Stepwise Mechanics of a CRT Trade

A clean CRT workflow (bullish example) looks like this:

  • Pick an HTF candle and mark high/low as the CRT range.
  • Drop to a lower timeframe and wait for a sweep below the low (liquidity grab).
  • Require re-entry back inside the range (no re-entry = no trade).
  • Look for a structure shift (MSS/ChoCh) confirming that selling pressure has changed.
  • Use a precise entry location (often discussed as an order block/imbalance area in SMC-style CRT writeups) with tight invalidation beyond the sweep extreme.

Bearish CRT is the mirror: sweep above the range high, then re-entry, then structure shift, then sell from a defined zone.

CRT vs Traditional Price Action Approaches

Traditional price action often focuses on patterns (pin bars, engulfing, break-and-retest) without a strict HTF candle-range container.

CRT’s main differences:

  • Range-first discipline: you start with a defined range rather than reacting to any pattern.
  • False breakout focus: the failed acceptance is central, not optional.
  • Multi-timeframe sequencing: HTF defines the box, LTF defines the trigger.

Structural Foundations of CRT

CRT is often taught alongside frameworks that describe how price sets up moves: AMD, PO3, and Wyckoff’s market cycle logic. These aren’t identical systems, but they rhyme.

AMD in Candlestick Range Theory (CRT)

According to FTMO, AMD is a simple narrative: the market builds a range, runs stops, then delivers the real move. FTMO explains AMD as accumulation-manipulation-distribution and frames it as applicable beyond classic Wyckoff investing contexts.

Accumulation

In CRT terms, this is the range-building phase. Price compresses and creates clear boundaries (high/low). That range is where liquidity starts to pool.

  • Practical clue: repeated reactions at similar highs/lows and fewer clean trend legs.

Manipulation

This is the liquidity sweep phase: price runs above highs or below lows to trigger stops and trap breakout traders.

  • CRT clue: a sharp probe outside the range, often followed by failure to hold outside.

Distribution

This is the delivery phase: price moves directionally after the sweep and confirmation, often travelling to the opposite side of liquidity.

  • CRT clue: after re-entry and structure shift, price expands with cleaner momentum.
sms-star

Remember: AMD helps you label the story. CRT tells you where the story is tradable.

Power of 3 (PO3) Within CRT Sequencing

PO3 is commonly described as the same three-stage logic (accumulation, manipulation, distribution), often applied to intraday price delivery. Reliable sources’ PO3 guide explicitly frames PO3 around these phases and the role of false breakouts/manipulation before the directional move.

Power of 3 (PO3) Within CRT Sequencing

How this maps to CRT:

  • CRT range = accumulation container
  • Sweep = manipulation event
  • Move after confirmation = distribution delivery

This is why many traders treat CRT as a practical entry model inside broader AMD/PO3 thinking.

Wyckoff Market Phases Alignment

As noted by Investopedia, Wyckoff describes market behaviour using phases such as accumulation, markup, distribution, and markdown. Investopedia summarises this market cycle framing clearly.

Where CRT aligns conceptually:

  • The CRT range often resembles an accumulation/distribution-style structure.
  • The sweep resembles a shakeout/upthrust-type liquidity event.
  • The delivery resembles markup/markdown after the market reveals direction.
sms-star

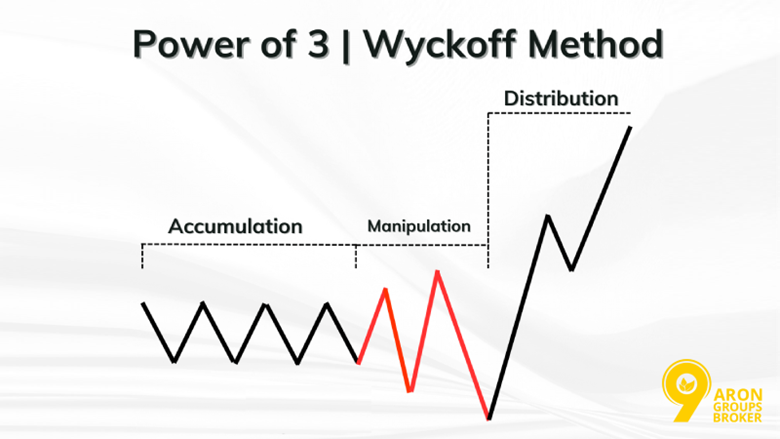
Important note: Don’t force Wyckoff labels onto every CRT range. Use Wyckoff as context, not as decoration.

Range Identification and Validation

CRT works only if your range is real. Most failed CRT trades are actually range-definition errors. You either picked a candle that does not matter, or you kept moving the boundaries until the model looked right.

Determining Highs, Lows, and Wick Structure

In CRT, the range is usually anchored on a higher-timeframe candle’s high and low, including wicks. The wick matters because it often marks where liquidity has already been probed.

A practical range checklist:

  • Choose an HTF candle that is obvious and recent (not random).
  • Mark High and Low from the full candle (wicks included).
  • Avoid micro candles that sit inside the chop; you want a candle that participants actually reacted to.

Quick validation tests:

  • Did price respect these levels more than once?
  • Do the levels align with a visible swing or session structure?
  • If you hide indicators, would another trader mark the same range?

Liquidity Sweeps and Re-Entry Confirmation in CRT

This is the core: sweep first, then re-entry.

A liquidity sweep in CRT is price running:

  • above the range high (taking buy-side liquidity), or
  • below the range low (taking sell-side liquidity),
    Then failing to hold outside.

Re-entry confirmation means:

  • price returns back inside the range, and
  • starts to accept back inside (not just a one-tick touch).

Why this matters:

  • Breakouts fail frequently. CRT trades the failure and the return, not the initial break.
  • No re-entry = you’re trading a breakout, not a CRT model.
sms-star

Tip: If price sweeps and then builds outside the range, treat it as acceptance. That is a different trade idea.

The 3-Candle Rule for Reliable Entries

Different CRT traders define this slightly differently, but the practical idea is consistent: you want a short sequence that shows (1) sweep, (2) re-entry/shift, (3) confirmation before you commit size. (Many CRT explanations describe this as a simple way to avoid premature entries.)

A clean 3-candle sequence you can practise:

  1. Sweep candle: breaks the range high/low (liquidity event).
  2. Re-entry candle: closes back inside the range (failed acceptance).
  3. Confirmation candle: shows follow-through in your intended direction (momentum/structure change).

This does two things:

  • It reduces false signals.
  • It forces patience, especially on lower timeframes.
sms-star

Remember: Three candles are not a rule to memorise. It’s a rule to stop you from entering the trap candle.

Market Structure and Confluence Factors

CRT becomes higher quality when you combine it with market structure logic. The range gives you the location. Structure tells you whether control is actually shifting.

Market Structure Shift (MSS) as a CRT Filter

A market structure shift (MSS) is commonly described as a change in the sequence of swings, price stops making one pattern and starts making the opposite. It’s often used as a confirmation filter after liquidity events.

In CRT, the MSS role is simple:

  • After a sweep and re-entry, wait for a structure break that supports your direction.

Practical examples:

  • Bullish CRT: sweep below range low, then re-enter, then break a recent lower high (shift).
  • Bearish CRT: sweep above range high, then re-enter, then break a recent higher low (shift).

Order Blocks and Change of Character (ChoCh)

A Change of Character (ChoCh) is often explained as an early signal that the market’s behaviour has changed, typically the first break against the prevailing swing direction. ChoCh’s overview frames it as a shift used to spot potential reversals or trend changes.

A Trader’s Guide to Candlestick Range Theory for Consistent Profits

How to use ChoCh and order blocks with CRT:

  • Use the CRT range + sweep + re-entry as your event context.
  • Use ChoCh/MSS as your confirmation.
  • Use an order-block-like zone (last opposing candle before displacement) as your precision entry area.

This pairing helps you avoid the most common CRT mistake: entering because you saw a sweep, without proof that control shifted.

sms-star

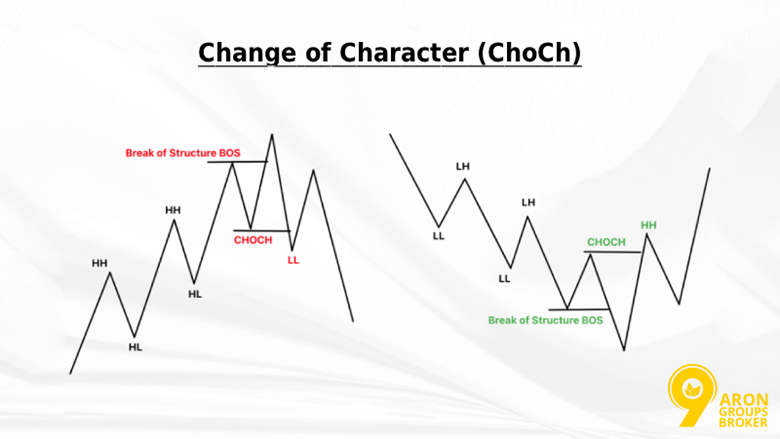
Tip: CRT gives you the setup. MSS/ChoCh tells you whether the setup is real.

Multi-Timeframe Alignment

CRT is naturally multi-timeframe. You need an HTF range to give meaning to the liquidity event, then you use the lower timeframe to execute with precision.

Higher Timeframe (HTF) Bias in CRT

HTF bias in CRT is about direction and destination:

  • Which side of liquidity is likely to be targeted next
  • Whether the bigger structure is bullish, bearish, or balanced

Practical HTF routine:

  • Mark the HTF candle range (high/low).
  • Note where obvious liquidity pools sit relative to that range (recent highs/lows).
  • Decide whether you are looking for a sweep above (sell idea) or sweep below (buy idea) based on the broader structure.

If HTF is unclear:

  • trade smaller
  • Or wait for a clearer structure

Nested and Lower Timeframe Precision Entries

Nested CRT means you use the HTF range as the container, then you find a smaller LTF range or structure inside it to time entries.

A practical nested approach:

  • HTF range defines the important boundaries.
  • LTF shows the sweep + re-entry in real time.
  • You use LTF structure (MSS/ChoCh) to trigger.
  • You enter from a precise zone (order block / imbalance-style area), with invalidation beyond the sweep.

This is how you get CRT to feel mechanical:

  • HTF sets the map
  • LTF executes the plan
sms-star

Important note: If you take LTF signals without the HTF range context, you’re not trading CRT, you’re just trading noise with CRT labels.

Execution and Risk Management

CRT is easy to recognise on hindsight charts. The challenge is execution in real time. Your edge comes from being strict: range first, sweep second, re-entry third, then only execute when structure confirms.

Step-by-Step CRT Trade Execution

Here is a clean CRT execution sequence you can rehearse:

  • Define the HTF CRT range
    Mark the candle’s full high/low (wicks included).
  • Wait for the liquidity sweep
    Price runs above the range high or below the range low. This is the manipulation leg in AMD/PO3-style framing.
  • Require re-entry back inside the range
    No re-entry = no CRT trade. You are not trading a breakout.
  • Confirm with structure (MSS / ChoCh)
    Look for a meaningful shift on the lower timeframe before committing risk. MSS is commonly explained as a change in swing behaviour that confirms a potential shift.
  • Choose a precise entry location
    Use the first clean pullback after displacement or a defined zone (e.g., an order-block-like area) rather than chasing the move.
  • Target the next obvious liquidity pool
    Most CRT moves aim back through the range toward the opposite boundary, or to a nearby swing high/low.

Entry, Stop-Loss, Target Placement, and Position Sizing

A CRT plan should be mechanical. If you can’t define stop and target before entry, you are guessing.

Entry (keep it strict):

  • Enter after re-entry and structure confirmation.
  • Prefer a pullback entry rather than market-chasing.
  • If you enter on impulse, your stop usually becomes irrational.

Stop-loss (logical invalidation):

  • For bullish CRT: stops commonly sit beyond the sweep low (the extreme that should not be revisited if the reversal is real).
  • For bearish CRT: stops commonly sit beyond the sweep high.

This is not about tight stops. It is about stops where the idea is proven wrong.

Targets (liquidity-based, not random):

  • First target: internal liquidity inside the range (nearest swing).
  • Main target: the opposite side of the CRT range (range high/low).
    This aligns with the basic range, then sweep, then delivery logic.

Position sizing (the survival rule):

Position sizing refers to determining the number of units to trade in order to control risk. It is widely regarded as a core element of effective risk management.

Practical sizing rule:

  • Fix a % or a currency amount you risk per trade.
  • Calculate position size from stop distance.
  • If the required stop is too wide, reduce size or skip.

Enhanced CRT Confluences and Market Applications

CRT becomes stronger when you add one or two confluences that improve timing. The key is restraint. Too many confirmations usually mean curve-fitting.

CRT with Fair Value Gaps (FVGs) and Liquidity Zones

Many traders pair CRT with Fair Value Gaps (FVGs) as a precision entry zone after displacement. An FVG is commonly described as a three-candle imbalance area created during a fast move.

How to combine CRT + FVG cleanly:

  • Use CRT for the macro sequence: range, then sweep, then re-entry, then shift.
  • Use FVG for the micro entry: enter on retracement into the FVG created by the displacement leg.

Liquidity zones that pair well with CRT:

  • Prior swing highs/lows
  • Equal highs/lows
  • Session highs/lows
  • The CRT range boundaries themselves
sms-star

Tip: CRT tells you where the trap happened. FVG tells you where the entry can be clean.

Applying CRT Across Forex, Indices, and Commodities

CRT can be applied across asset classes because it is based on universal behaviour: range, liquidity, reaction, and structure.

However, execution differs by market:

  • Forex trading: often smoother intraday ranges, but news spikes and session changes matter.
  • Indices: strong open/close flows; sweeps can be aggressive; slippage can be higher around events.
  • Commodities: can trend hard and gap on news; ranges can break cleanly without returning.

A practical cross-market rule:

  • The noisier the instrument, the stricter your confirmation must be (re-entry + structure shift).
  • The more volatile the session, the smaller your position size should be.
sms-star

Important note: Don’t assume a CRT range behaves the same in gold as it does in a major FX pair. Test it instrument-by-instrument.

Conclusion

Candlestick Range Theory (CRT) is a structured way to trade what most people misread: false breakouts and liquidity sweeps. You define an HTF candle range, wait for a sweep, require re-entry, confirm with structure (MSS/ChoCh), then execute with clear invalidation and liquidity-based targets. Add one precision layer like FVG only if it genuinely improves timing. Keep the model strict, keep risk small, and CRT becomes a repeatable framework rather than a hindsight story.

Continue Reading
not-found
calendar 11 April 2026
Rate this article
Plugin not installed

Leave a Reply

Your email address will not be published. Required fields are marked *

No thanks