


Candlestick patterns are one of the most important tools for analyzing market movements. This article of aron groups explores trading strategies based on candlestick patterns and examines how to use them to optimize trading decisions.

- Candlestick patterns are powerful yet simple tools that help traders identify potential market reversals and trend continuations.
- Combining candlestick patterns with other indicators such as RSI, moving averages, and Bollinger Bands improves signal reliability and trading outcomes.
- Trader psychology plays a crucial role in effectively using candlestick strategies, requiring discipline, patience, and realistic expectations.
- Market volatility and context matter; candlestick patterns are most effective when used in conjunction with other strategies and within key support and resistance zones.
Where Did the Story of Candlestick Patterns Begin?
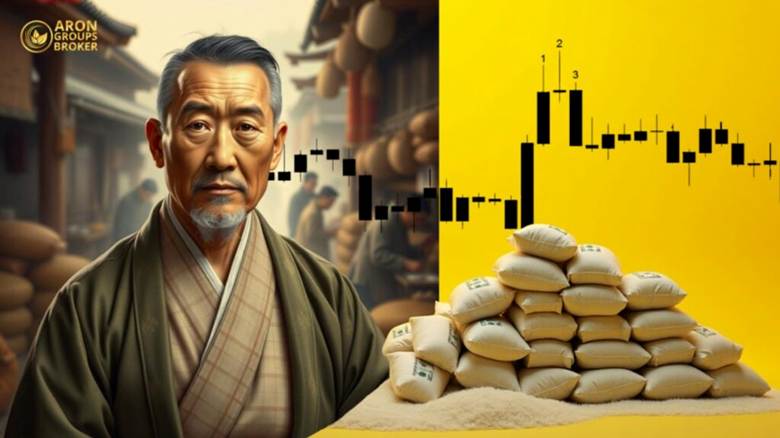
The history of candlestick patterns dates back to the seventeenth century in Japan. This technique was developed by Munehisa Homma, a Japanese rice merchant who used candlesticks to analyze rice prices and predict future price movements. Homma discovered that there was a connection between supply and demand and the emotions of traders. By recording this information, he was able to create a system of technical analysis that over time became known as candlestick charts.
Candlesticks visually present information about the opening price, the highest and lowest prices, and the closing price within a specific time period. These charts not only illustrate price trends but also reflect market sentiment and trader psychology, which are key elements in technical analysis.
In the twentieth century, Steve Nison, a prominent analyst in the United States, introduced this method to the Western world. Through the publication of books such as Japanese Candlestick Charting Techniques in 1991, he helped bring greater recognition to this approach in modern financial analysis.
Candlestick charts quickly became one of the most important tools in technical analysis across global financial markets. Today, they are widely used in the analysis of various markets, including stocks, currencies, and commodities.

According to Investopedia, Candlestick patterns are powerful tools that help clarify market psychology and price activity for traders worldwide. They offer a wealth of information at a glance, aiding traders in making informed decisions.
What Are Bullish and Bearish Candlestick Patterns?
According to Corporate Finance Institute, candlestick patterns are generally divided into two main categories: bullish patterns and bearish patterns. These formations indicate possible changes in the direction of a trend. Candlestick patterns often signal potential reversals in price direction, and when used in key reversal zones, they can offer strong opportunities to capture new trends.
Bullish Candlestick Patterns
Some of the most well-known bullish candlestick patterns include:
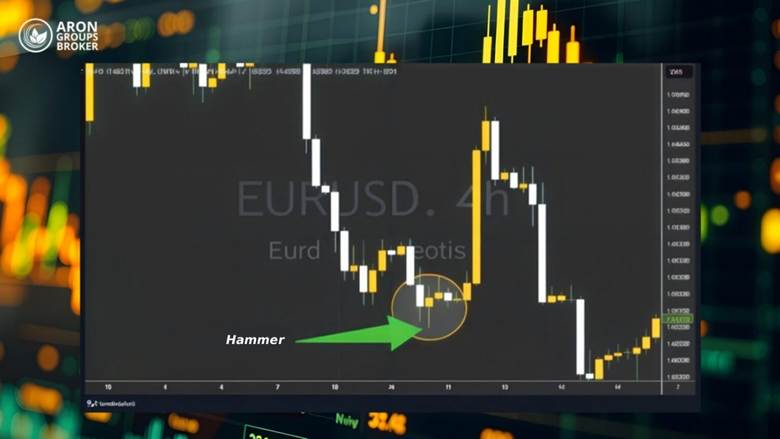
Hammer
The hammer is a bullish pattern that appears at the end of a downtrend. It reflects the sellers’ attempt to push the price lower, followed by strong buying pressure that drives the closing price near the session’s high. The candle has a small real body and a long lower shadow, showing that buyers have regained control.
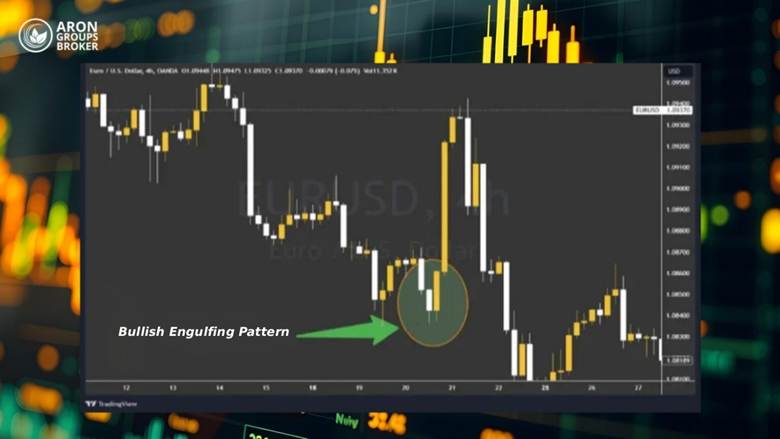
Bullish Engulfing Pattern
This pattern consists of two candlesticks. The first is bearish and the second is bullish, with the body of the second candle completely engulfing the first one. This formation indicates a shift in momentum from sellers to buyers and often marks the beginning of a potential upward move.
Bearish Candlestick Patterns
Some of the most common bearish candlestick patterns include:
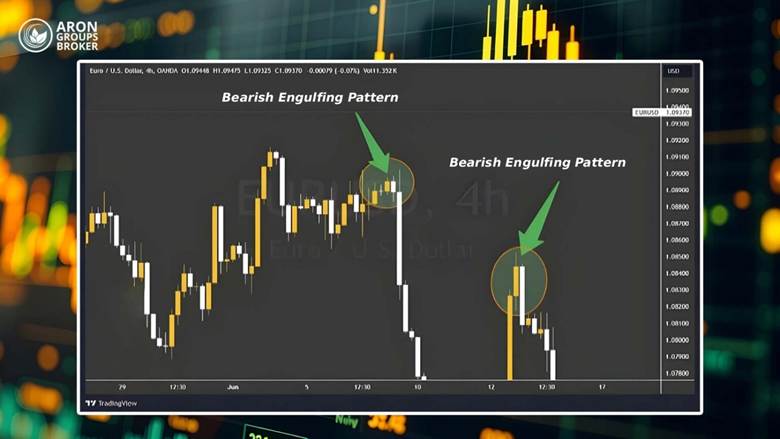
Bearish Engulfing Pattern
This pattern is the opposite of the bullish engulfing formation. The first candle is bullish and the second is bearish, with the body of the bearish candle completely engulfing the previous one. It typically appears during an uptrend and signals a possible reversal to the downside.
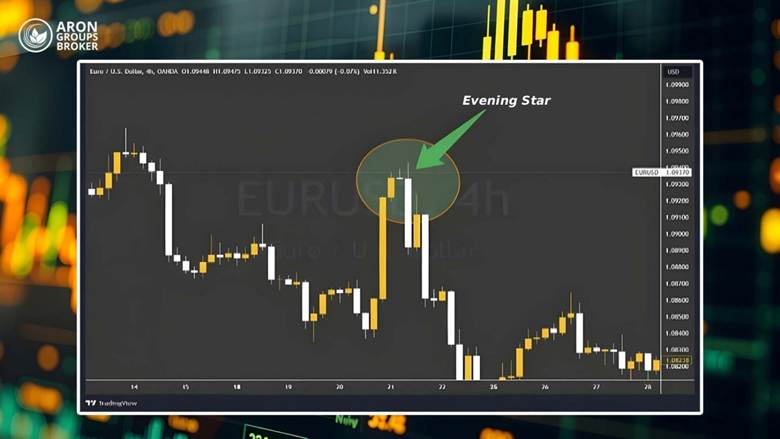
Evening Star
The evening star pattern is made up of three candlesticks: a long bullish candle, a small-bodied candle, and a long bearish candle. This formation suggests that buying pressure is weakening and the market may be preparing for a downward reversal.
Beyond reversal patterns, patterns like the Three White Soldiers (bullish) and Three Black Crows (bearish) are classified as Continuation Patterns, indicating that the current trend is likely to persist strongly.
How to Identify Candlestick Patterns on Charts
Identifying candlestick patterns requires precision and experience. The more charts you study, the more proficient you become at recognizing these formations. John Murphy, in his book The Visual Investor, highlights the importance of observation and intuition in identifying trading patterns, particularly candlestick patterns.
To identify these formations, traders use candlestick charts. Technical analysis platforms such as MetaTrader, TradingView, and NinjaTrader offer powerful tools for displaying candlestick charts and recognizing these patterns.
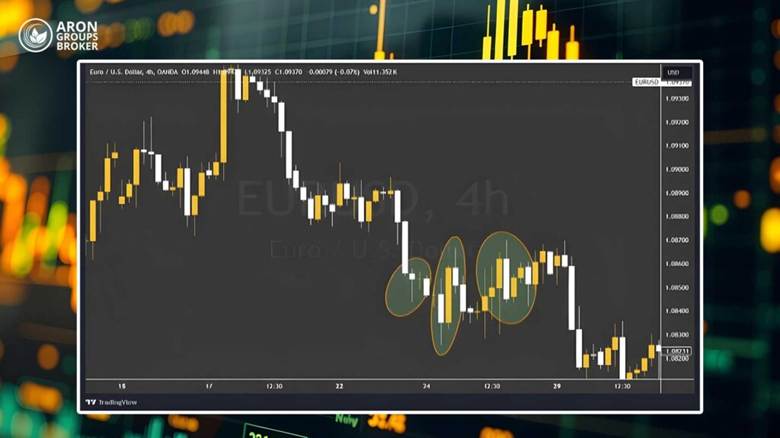
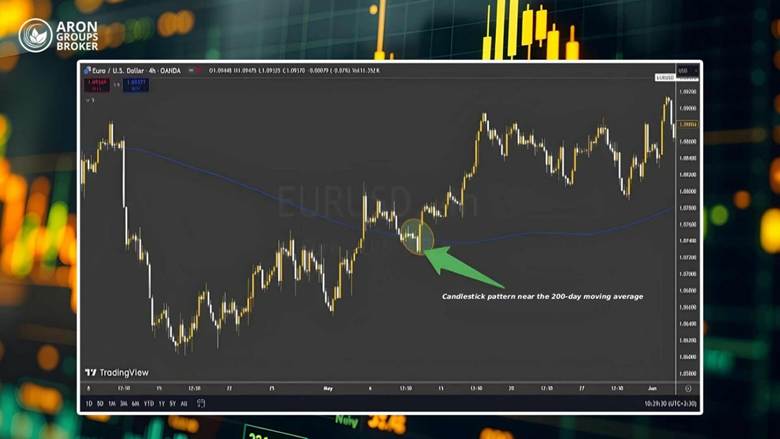
Patterns should appear in key areas of the chart, such as support and resistance zones, points of intersection with trendlines, or around moving averages, to be considered valid. Proper identification of these areas allows traders to determine key entry and exit points with greater confidence.
For example, as you can see in the chart below, candlestick patterns often form during an ongoing trend. However, since these areas are not reversal zones, such patterns may fail to perform effectively and are considered invalid.
How to Combine Candlestick Patterns with Other Tools
Candlestick patterns are powerful on their own, but combining them with other technical analysis tools can generate stronger and more reliable signals, greatly improving trading performance. Some of the most common tools used in combination with candlestick patterns include:
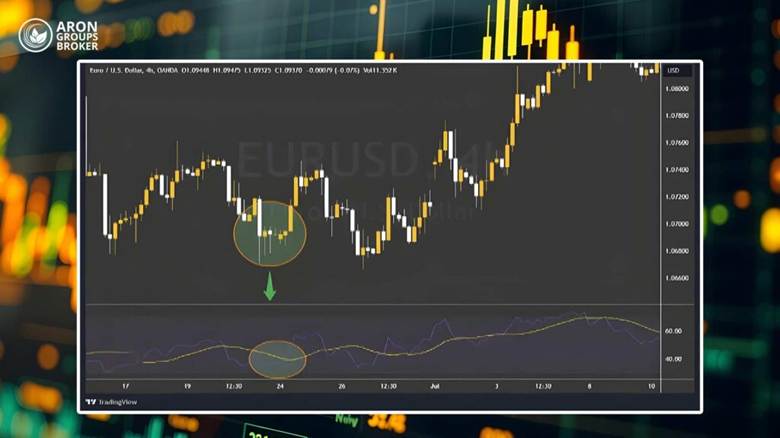
Relative Strength Index (RSI)
The RSI helps traders determine whether the market is in an overbought or oversold condition. For example, combining a hammer candlestick pattern with an RSI reading below 30 can provide a stronger bullish signal.
Moving Averages
Moving averages help identify the overall market trend. When a candlestick pattern forms near a major moving average, such as the 200-period moving average (MA200), it can serve as confirmation of either a trend reversal or a continuation.
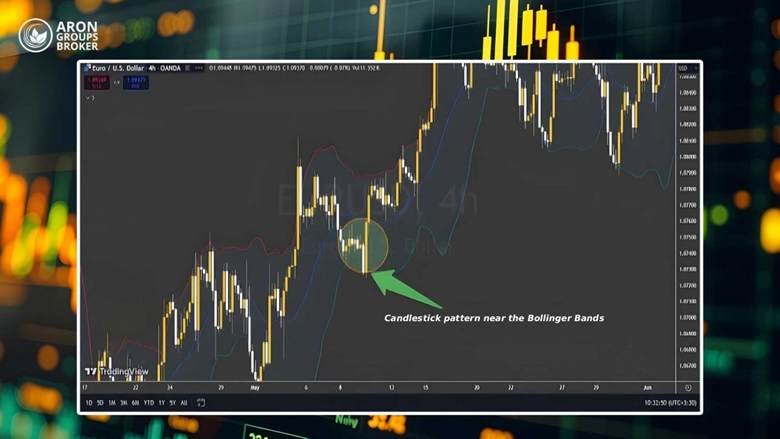
Bollinger Bands
When a candlestick pattern appears near the Bollinger Bands, it can indicate the possibility of the price moving back toward the opposite band, suggesting a potential price reversal or retracement.
How to Manage Risk Using Candlestick Patterns
One of the key advantages of candlestick patterns is their ability to help traders determine precise stop-loss levels. When a trader knows exactly where to place a stop-loss, they can properly implement their risk management strategies. For example, when using reversal patterns such as the hammer or the evening star, stop-loss orders can be placed at the lowest or highest point of the pattern.
In addition, setting take-profit levels based on support and resistance zones, which can be identified using various technical tools, combined with candlestick patterns, can create an effective exit strategy. This approach allows traders to manage risk more efficiently while maximizing potential gains.
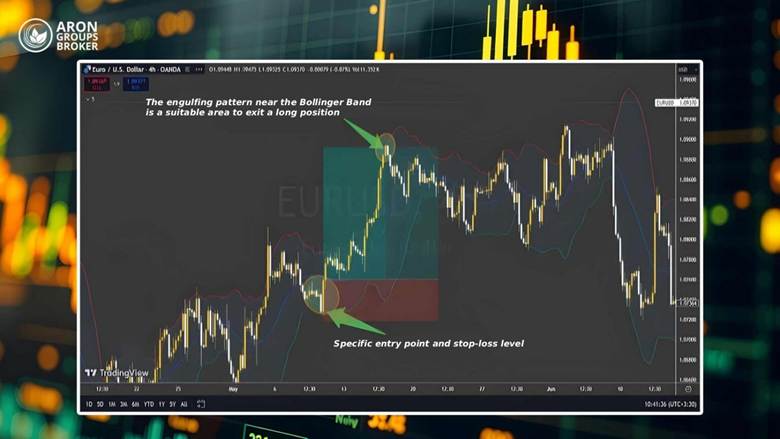
Entry and Exit Techniques Using Candlestick Patterns
Entry and exit techniques based on candlestick patterns help traders execute their trades with greater confidence. Traders typically enter a trade after a candlestick pattern has been confirmed. For example, with a hammer pattern, a trader may enter a position once the bullish candle closes and the pattern is validated.
Exiting trades can be determined by the formation of an opposing pattern or reaching a predefined take-profit level. Additionally, using protective orders such as a trailing stop can help capture more profit in case the market moves quickly in a favorable direction.
Advantages and Disadvantages of Using Candlestick Patterns
According to Investopedia. advantages of Using Candlestick Patterns are:
Simplicity and Clarity
Candlestick patterns are visually very easy to recognize and provide fast and accurate information about market movements. Since these patterns are based on the behavior of supply and demand, they can respond quickly to a trader’s needs.
Wide Applicability
These patterns can be used across all timeframes and financial markets, from forex market to stocks and cryptocurrencies. As mentioned, they can be combined with most trading strategies and are approved by many traders and investors. It is worth noting that the more practical a tool is and the more widely it is used, the more credible it becomes. However, due to their widespread use, smart money can capture significant liquidity. Therefore, when using candlestick patterns, traders need to be aware of smart money and market makers.
Disadvantages of Using Candlestick Patterns are:
Errors in Volatile Markets
In markets with high or low volatility, candlestick patterns may give false signals. In general, the higher the liquidity of an asset, the more analyzable its chart is. In unstable markets, such as when major events like wars or elections cause sharp fluctuations, candlestick patterns often do not provide accurate information, and this should be taken into consideration.
Dependence on Other Tools
Candlestick patterns alone cannot show everything and are better used in combination with other tools. As mentioned, the likelihood of errors is very high if candlestick patterns are used without other supporting tools. Therefore, candlestick patterns, as a practical tool, can be used effectively alongside other trading instruments.
Trader Psychology in Candlestick Strategies
Although candlestick patterns provide traders with clear signals for entering and exiting trades, trader psychology can have a significant impact on how these signals are interpreted and used. Below are several important aspects of trader psychology in relation to candlestick strategies:
Fear and Greed
The two main emotions that often lead traders to make irrational decisions are fear and greed. When a candlestick pattern signals a reversal or trend continuation, a trader may exit a trade too early out of fear of missing further gains, or remain in a trade driven by greed without paying attention to the signals. These emotions can cause traders to ignore reversal signs or miss optimal entry opportunities.
Patience and Discipline
Candlestick patterns can appear quickly, but successfully executing a strategy requires patience and discipline. Traders must wait for the complete formation of a pattern and necessary confirmations, avoiding haste in entering or exiting trades. They also need the ability to follow their trading plan consistently without constantly changing it.
Confidence in Analysis
Traders should trust their analysis and react to candlestick patterns without anxiety or doubt. Many traders, lacking self-confidence, seek additional confirmations or interfere with their trading decisions, which can result in missed profitable opportunities.
Risk Management and Emotion Control
Even with strong signals from candlestick patterns, risk management is crucial. Traders should plan so that losses are minimized if their analysis is incorrect. This helps reduce stress and allows traders to operate with a calmer mindset. Setting stop-loss levels and using appropriate position sizes are key tools in this regard.
Emotional Swings When Facing Losses
When traders encounter losses, they may make emotional decisions rather than logical ones. For instance, after a losing trade, they might attempt to quickly recover losses without considering new signals, often resulting in further losses. The ability to control emotions after losses and maintain the strategy is essential.
Realistic Expectations
Many beginner traders enter the market with unrealistic expectations of quick and large profits. These expectations can lead them to rely too heavily on candlestick patterns and make trades without considering other factors such as market conditions or timeframes. Having realistic expectations and understanding that no strategy is 100 percent successful helps traders make better decisions.
Resisting the Temptation to Change Strategy
When the market does not move in a trader’s favor, there may be a temptation to change strategies or deviate from their trading system. This often stems from insufficient confidence in candlestick patterns or an inability to wait for proper results. Sticking to a proven strategy and avoiding frequent changes is a key factor in long-term success.
Candlestick patterns serve as visual representations of market sentiment, allowing traders to gauge the psychology behind price movements. Various patterns indicate different emotions and market dynamics, providing insights into the collective mindset of market participants.
The Impact of Market Volatility on Candlestick Patterns
Market volatility can significantly affect the accuracy and effectiveness of candlestick patterns. In unstable markets with high fluctuations, false or unreliable patterns may form, potentially misleading traders. In these conditions, traders need to carefully monitor the market and use multiple signals to confirm their trades. For example, using higher timeframes can help filter out market noise. As mentioned earlier, combining candlestick patterns with other trading methods enhances their effectiveness and reliability.
Comparing Candlestick Strategies with Other Strategies
Since understanding candlesticks is a primary way to enter financial markets, most traders tend to rely on candlestick patterns on this journey, which is full of ups and downs. For instance, some traders base their strategy on the hammer pattern in higher timeframes and enter the market accordingly. However, as they progress, they realize that staying successful in the market requires using additional tools and analyses. This is exactly when they begin to combine different trading strategies, which helps increase the win rate and achieve trades with a better risk-to-reward ratio.
Conclusion
Using candlestick patterns, despite their simplicity, requires a deep understanding of market cycles. This article aimed to provide a general introduction to candlestick methods and patterns, helping you become familiar with them so that you can incorporate these techniques effectively alongside your own trading strategy.