


Spotting the beginning or end of a trend at the right time can be the ace up your sleeve that transforms your trading results. To do that, you need tools that go beyond simple price analysis. One of these tools is the CCI indicator, which helps you view market behavior with greater precision and identify trend movements earlier than others.
If you want to know exactly how the CCI works and how to use it to uncover golden opportunities in the market, keep reading this guide from Aron Groups Broker.

- The CCI (Commodity Channel Index) is a technical analysis tool that measures how far the current price deviates from its historical average to identify optimal buying and selling points.
- It’s widely used across markets, including forex, cryptocurrencies, and stocks, and tends to perform best on short- and medium-term timeframes.
- A CCI line crossing above +100 often signals a buying opportunity, while a drop below -100 typically signals a selling opportunity.
- Combining CCI with RSI (Relative Strength Index) can help confirm trading signals and provide more accurate market trend analysis.
What Is the CCI Indicator and How Does It Work?
The Commodity Channel Index (CCI) is one of the most popular technical oscillators for measuring the strength and direction of a price trend. It compares the current price to its average over a specific period, showing traders whether an asset is trading above or below its typical level.
The CCI was developed in 1980 by Donald Lambert, originally to analyze commodity markets. However, it is now applied widely across stocks, forex, and cryptocurrencies.
Because the CCI is highly sensitive to price fluctuations, it’s often used to identify the start or end of a trend, spot divergences, and confirm entry or exit signals. Unlike many traditional indicators that work only in trending markets, the CCI can also be a valuable tool in range-bound (sideways) markets. For this reason, professional traders often use it in combination with other indicators for deeper analysis.

The CCI indicator is particularly effective on short-term (e.g., hourly) and medium-term (e.g., daily) charts, where it provides more precise and actionable trading signals.
How Is the CCI Indicator Calculated?
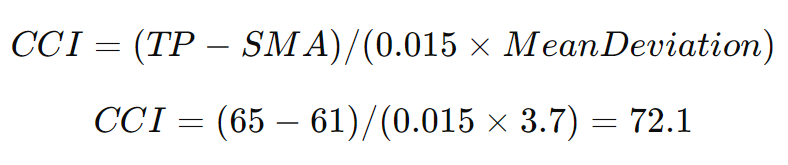
The main formula for the Commodity Channel Index (CCI) is as follows:

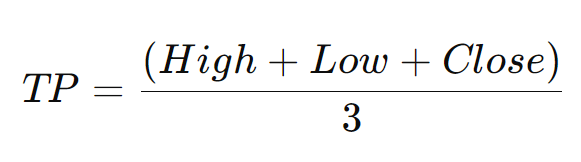
- Typical Price (TP): The average of the high, low, and closing prices of a single candlestick. Formula:
- Simple Moving Average (SMA): The average of the typical prices (TP) over a specific time period. The period can vary depending on the chosen timeframe, but most trading platforms
- use 20 periods as the default. Traders can adjust this setting based on their trading strategy.
- Mean Deviation (Standard Deviation): This measures the distance of each typical price (TP) from the average over the selected period. It plays a crucial role in determining the volatility of the CCI value.
- 0.015: A constant multiplier used in the CCI formula to ensure that most CCI readings fall between +100 and -100.
- Highest price: $70
- Lowest price: $60
- Closing price: $65
- Typical Price (TP):
TP= (70+60+65)/3= 65
- Simple Moving Average (SMA): Assume the average TP for the previous 20 days is 61.
- Mean Deviation: Assume the mean deviation for these 20 days is 3.7.
Interpretation:
A CCI value of +72.1 indicates that Apple’s current price is above its 20-day average but has not yet reached the overbought zone. This suggests that the price increase may continue.
However, it is recommended to use additional technical indicators to confirm the trend before making trading decisions.
How to Generate Buy and Sell Signals Using the CCI Indicator
To identify buy and sell signals with the Commodity Channel Index (CCI), traders should pay attention to how the indicator crosses its key levels. Since CCI measures how far the current price deviates from its statistical average, it helps pinpoint optimal entry and exit points in the market. According to the general guidelines outlined on the Groww website, CCI signals can be interpreted as follows:
When the CCI moves upward from negative territory and crosses above the zero line, it marks the first sign of renewed buying strength and a potential start of an uptrend.
If the CCI rises above +100, it is typically interpreted as a buy signal.
Conversely, when the CCI drops below zero and then falls under -100, it suggests increasing selling pressure and a possible beginning of a downtrend.
If the CCI moves back down from above +100 or rebounds upward after dropping below -100, this may indicate trend exhaustion or reversal, signaling a potential exit point.
Combining CCI signals with other technical tools, such as support and resistance levels or price patterns, allows traders to make more precise decisions and reduce trading risk.
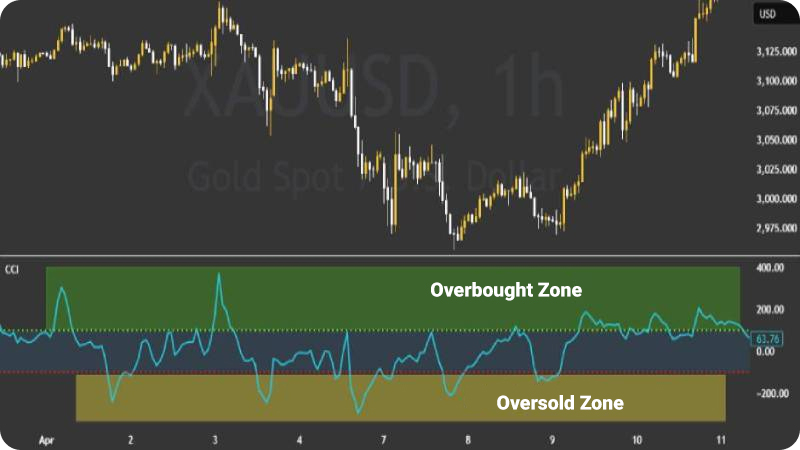
Overbought and Oversold Zones in the CCI Indicator
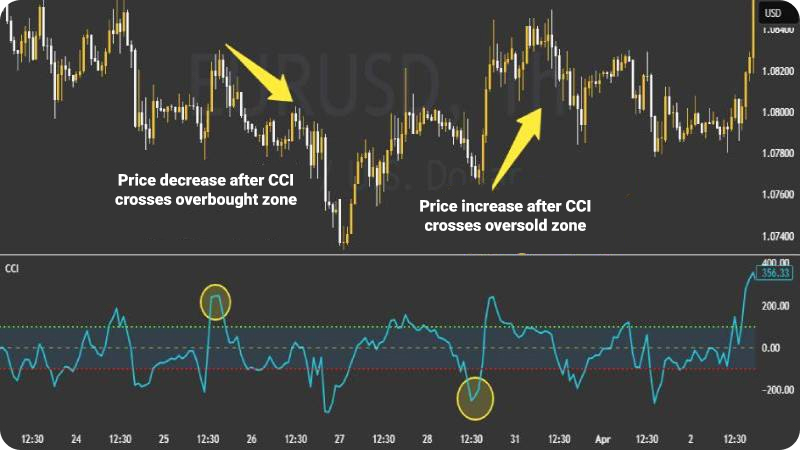
Another key feature of the CCI indicator is its ability to detect overbought and oversold conditions, which often reflect abnormal market behavior and may serve as an early warning of trend reversals.
- Overbought Zone:
When the CCI rises above +100, the market enters an overbought area, meaning prices have increased excessively, and buying pressure may soon weaken. This increases the likelihood of a price pullback.
Oversold Zone:
When the CCI drops below -100, the market is considered oversold, indicating that prices have fallen too sharply. This can be a sign of a potential upward reversal, as selling pressure begins to fade.
The further the CCI moves away from these thresholds, reaching +200 or -200, for example, the stronger the overbought or oversold condition. However, in strong trends, these extreme readings may persist for extended periods.
To confirm a signal, traders should also analyze price behavior, such as candlestick patterns, or use momentum indicators for additional validation.
In range-bound markets, reversals from overbought or oversold zones tend to be more reliable, whereas in trending markets, traders should be cautious of false signals.
Divergence in the CCI Indicator
One of the most powerful features of the CCI indicator is its ability to detect divergence between price movement and the indicator’s behavior. Such divergences often serve as reliable warnings of weakening momentum and possible trend reversals.
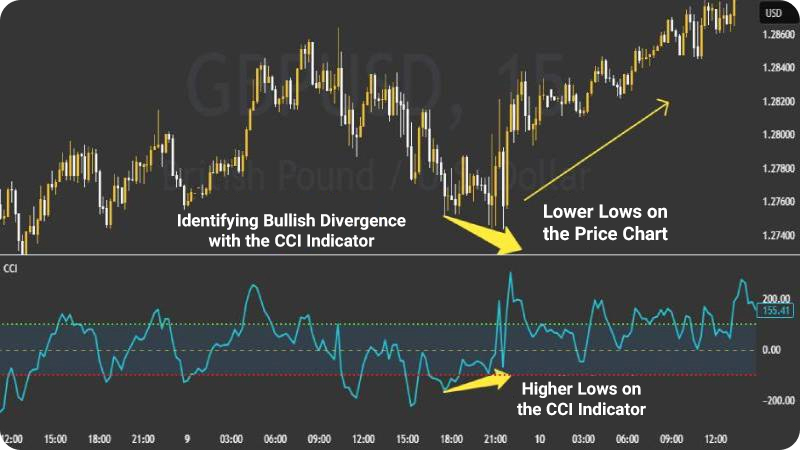
- Bullish Divergence:
Occurs when the price chart forms lower lows, but the CCI forms higher lows. This discrepancy suggests that selling momentum is fading, signaling a potential upward reversal in the near future.
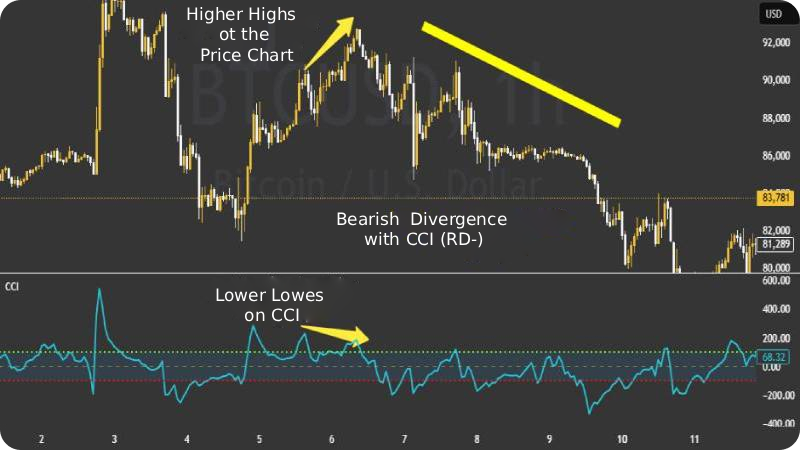
- Bearish Divergence:
Occurs when the price chart forms higher highs, while the CCI forms lower highs at the same time. This pattern often warns that buying pressure is weakening and a downtrend may soon begin.
Best Settings for the CCI Indicator
To use the Commodity Channel Index (CCI) effectively, there must be consistency between the period length and the chart timeframe. The choice of these two factors depends on your trading style and can significantly impact the accuracy of the signals generated. Below are some of the most common configurations.
Short-Term Trading (Scalping or Quick Trades)
- Recommended Timeframe: 1–15 minutes
- Ideal Period: 5 or 10
In these shorter intervals, the CCI reacts quickly to price movements, making it useful for capturing short-term volatility. However, because lower timeframes tend to produce more market noise, it’s advisable to pair the CCI with confirming indicators such as the RSI (Relative Strength Index) or Moving Averages.
Medium-Term Trading (Day or Swing Trading)
- Recommended Timeframe: 1–4 hours
- Ideal Period: 14
This combination, commonly used by traders and originally recommended by Donald Lambert, the creator of the CCI offers a balanced approach between sensitivity to price fluctuations and filtering out false signals.
Long-Term Trading (Position Trading or Investing)
- Recommended Timeframe: Daily or Weekly
- Ideal Period: 20 or 50
These settings are better suited for identifying strong market trends and major reversal points. If your goal is to analyze long-term market movements while ignoring minor fluctuations, this setup is the most appropriate.
Note: In the context of the CCI, the term “period” refers to the number of candlesticks used in the indicator’s calculation. For example, a 14-period CCI on a 1-hour chart analyzes the past 14 hours, whereas on a daily chart, it analyzes the past 14 days.
Reference Levels in the CCI
By default, the +100 and –100 levels are used as the standard thresholds for identifying overbought and oversold conditions.
However, some professional traders use +200 and –200 levels to detect stronger signals and capture high-probability trend reversals.
Enabling the CCI Indicator in TradingView and MetaTrader
Understanding and applying the Commodity Channel Index (CCI) is a fundamental step in technical analysis. Activating this indicator in both TradingView and MetaTrader platforms is straightforward and can be done in just a few steps. Below is a step-by-step guide for each platform.
Activating the CCI Indicator in TradingView
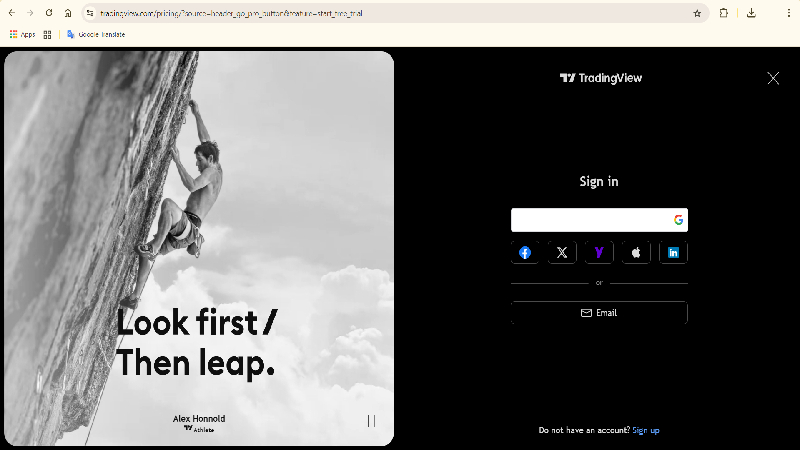
1. Log in to your account:
Go to the TradingView website and log in using your username and password.
If you don’t have an account yet, you can sign up for free.
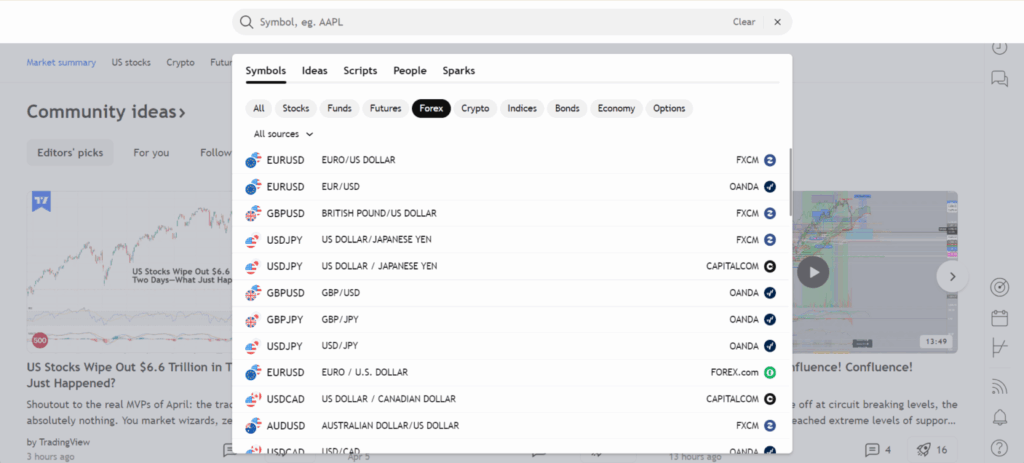
2. Select a trading instrument:
After logging in, select your preferred trading symbol using the search bar at the top of the page. (For example, we’ll use the EUR/USD currency pair in this guide.)
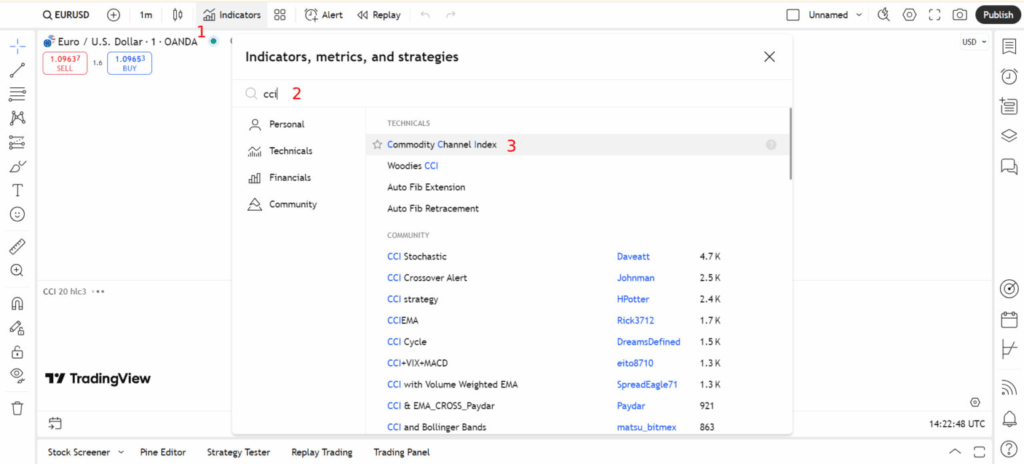
3. Add the CCI indicator:
- Click on the “Indicators” button at the top of the chart.
- In the search box that appears, type “CCI”.
- From the displayed results, select “Commodity Channel Index”.
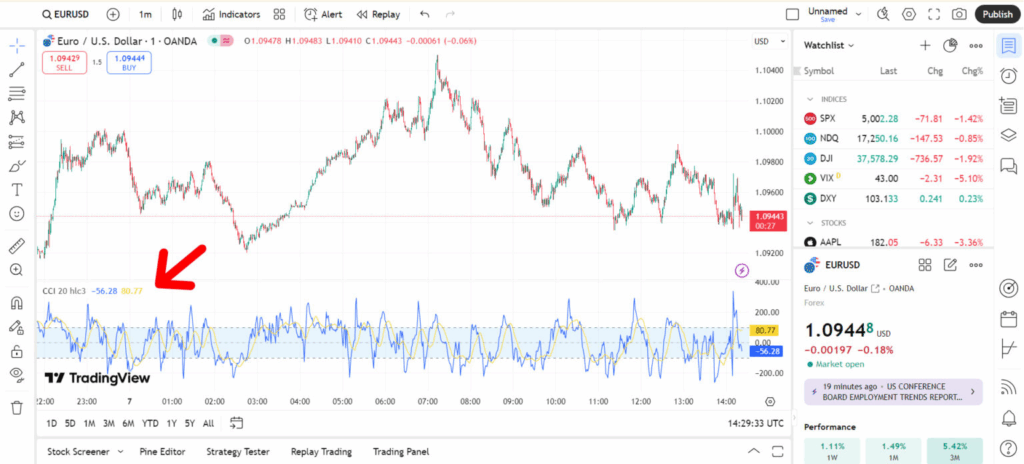
Once selected, the CCI indicator will be added to your chart automatically.
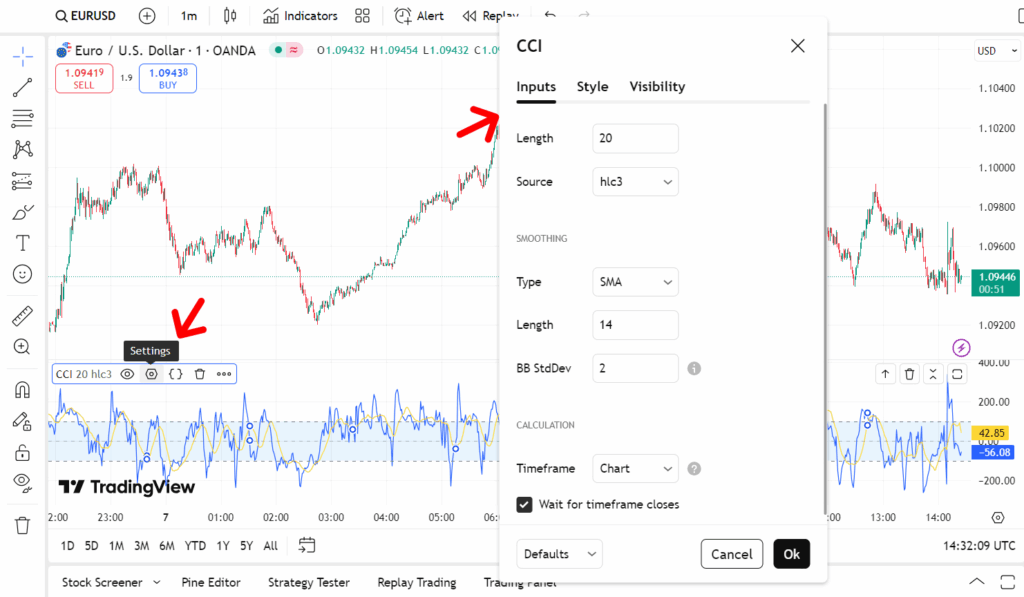
4. Adjust the indicator settings:
Hover your mouse over the indicator’s name at the top of the chart and click on the gear (settings) icon.
In the settings window, you can modify the period length and other parameters according to your trading strategy.
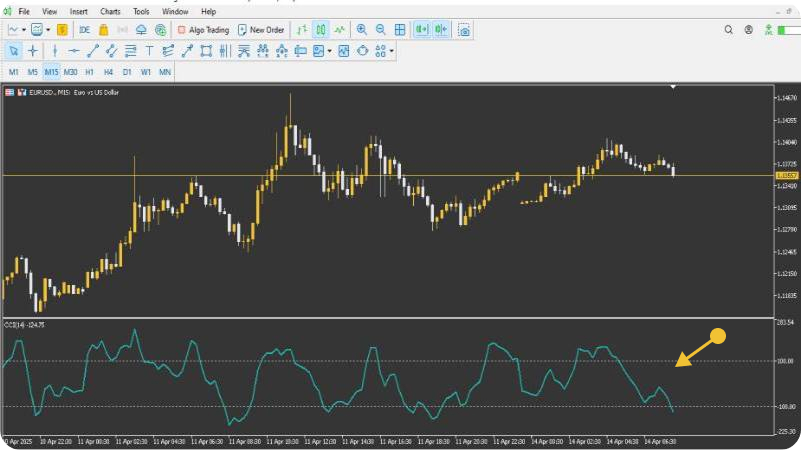
Enabling the CCI Indicator in MetaTrader 5
- Launch MetaTrader 5:
Open the MT5 platform and log in to your trading account.
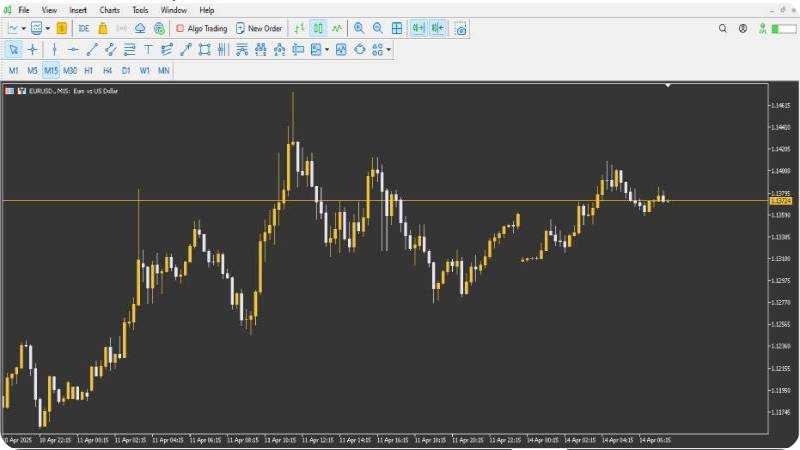
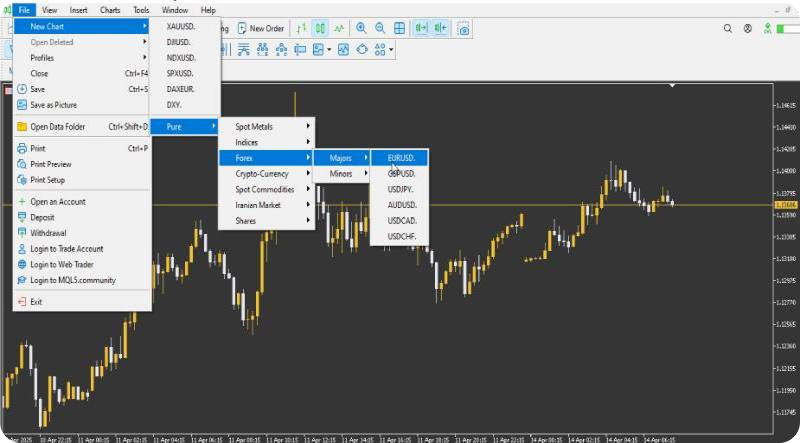
- Open the chart for your desired trading instrument:
From the “File” menu, select “New Chart” and choose the instrument you want to analyze. (For example, in this guide, we’ll use the EUR/USD currency pair.)
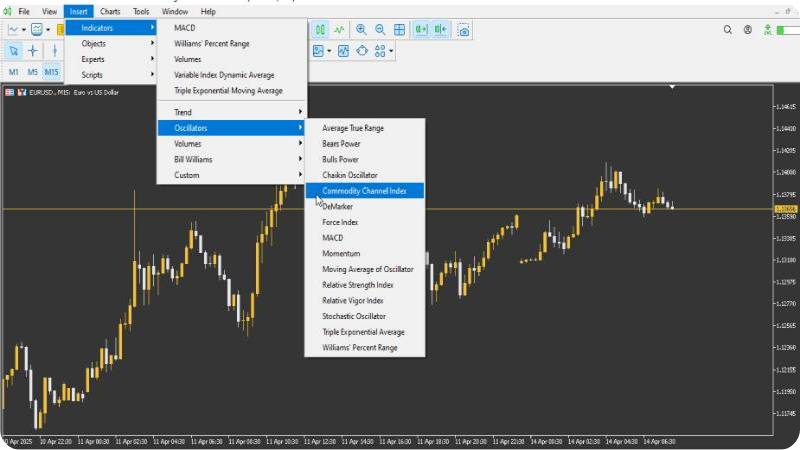
- Add the CCI indicator:
From the top menu, click on “Insert”, then navigate to: Indicators → Oscillators → Commodity Channel Index.
- A window will appear with the indicator’s default settings. If needed, adjust the period and other parameters according to your trading strategy, then click “OK.”
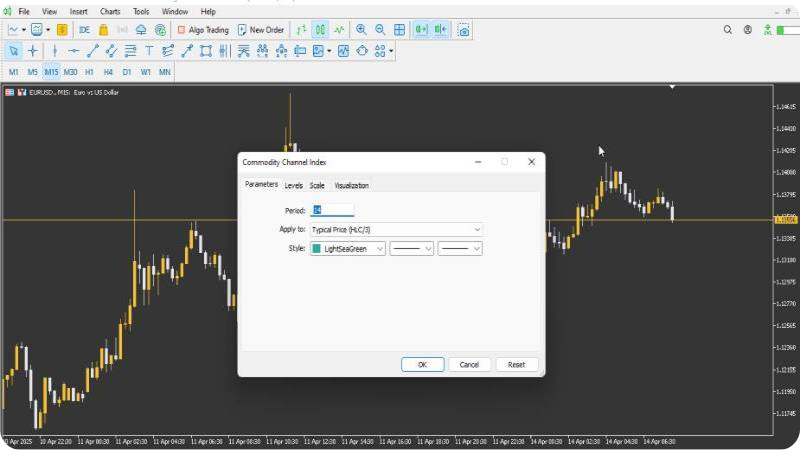
- The Commodity Channel Index (CCI) will now appear on your chart, ready for use in market trend analysis.
Advantages and Disadvantages of the CCI Indicator
Before using the Commodity Channel Index (CCI) in trading, it’s essential to understand its advantages and limitations, as this knowledge plays a crucial role in improving decision-making and reducing risk. Below is an overview of both sides of the indicator.
Advantages of the CCI Indicator
- Identifies precise entry and exit points during overbought and oversold conditions.
- Suitable for short-term analysis and scalping strategies.
- Can be combined with other indicators to filter out false signals.
- Applicable across multiple markets, including forex, stocks, and cryptocurrencies.
Disadvantages of the CCI Indicator
- May produce false signals in sideways (non-trending) markets.
- Requires careful period adjustment to minimize noise.
- May show a lag in signal generation.
- Highly sensitive to sharp price movements.
- Strongly dependent on the selected timeframe and overall market conditions.
Combining CCI and RSI for Trend Confirmation
Using the CCI alongside the Relative Strength Index (RSI) is an effective strategy for confirming buy and sell signals and improving trend accuracy. When used together, these two indicators complement each other, helping traders identify more reliable entry and exit points.
How the Combination Works:
- The RSI is primarily used to detect overbought (above 70) and oversold (below 30) conditions.
- The CCI, which uses thresholds of +100 and –100, provides similar insights but focuses more on trend strength.
Example:
- Buy Signal: When the RSI moves upward from below 30, and the CCI simultaneously crosses above –100, this combination strongly confirms the beginning of a potential uptrend.
- Sell Signal: When the RSI drops below 70, and the CCI turns downward from above +100, it serves as a warning of a possible downtrend.
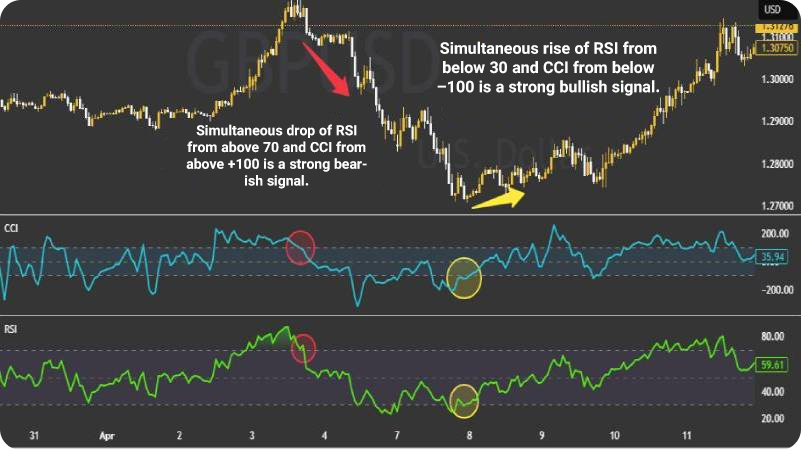
This combined approach enhances signal accuracy and contributes to better trading decisions.
Summary Table: Combined Signals from CCI and RSI
| RSI Status | CCI Status | Final Signal | Explanation |
|---|---|---|---|
| RSI crossing upward from below 30 | CCI crossing upward from below –100 | Strong Buy Signal | The market is exiting oversold territory; a bullish reversal may be starting. |
| RSI crossing downward from above 70 | CCI crossing downward from above +100 | Strong Sell Signal | The market is leaving the overbought zone; prices may soon decline. |
| RSI hovering near 50 without breakouts | CCI fluctuating between +100 and –100 | No Clear Signal | The market is range-bound; wait for stronger confirmations. |
| RSI and CCI both overbought/oversold, but in opposite directions | - | Conflicting Signal Needs Review | Best to confirm using a third tool, such as price action or candlestick analysis. |
Combining the CCI Indicator with Price Action
Using the Commodity Channel Index (CCI) alongside price action means the analyst doesn’t rely solely on the indicator’s numerical signals, but also interprets them in conjunction with the actual price behavior on the chart. This approach allows traders to make decisions based on more accurate and reliable data.
Below are three common methods for combining these two analytical tools:
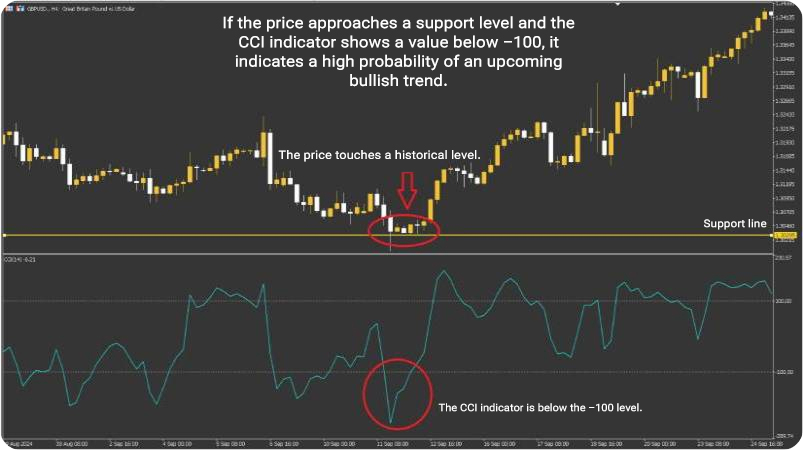
Using Support and Resistance Levels with CCI
First, identify key price zones on the chart where the market typically reacts; these are support and resistance levels. Then, observe the current reading of the CCI indicator at those levels:
- If the price approaches a support level and the CCI falls below –100, it may indicate that the market has entered an oversold zone. In this scenario, a potential bullish reversal is likely, making it a favorable point to consider a buy position.
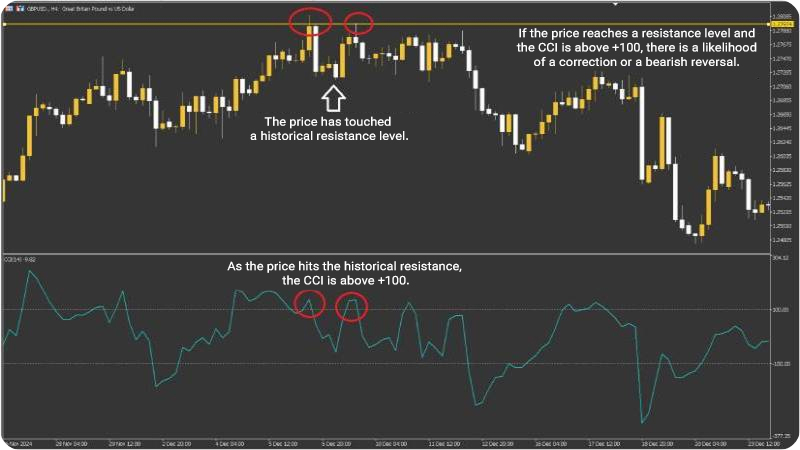
- Conversely, if the price reaches a resistance level and the CCI is above +100, it suggests that a correction or bearish reversal could be imminent.
Combining Candlestick Patterns with the CCI Indicator
Candlestick formations such as Pin Bar, Engulfing, or Doji patterns are fundamental elements of price action analysis. When these patterns appear at key market levels and are accompanied by reversal signals from the CCI indicator, the resulting signal becomes more reliable.
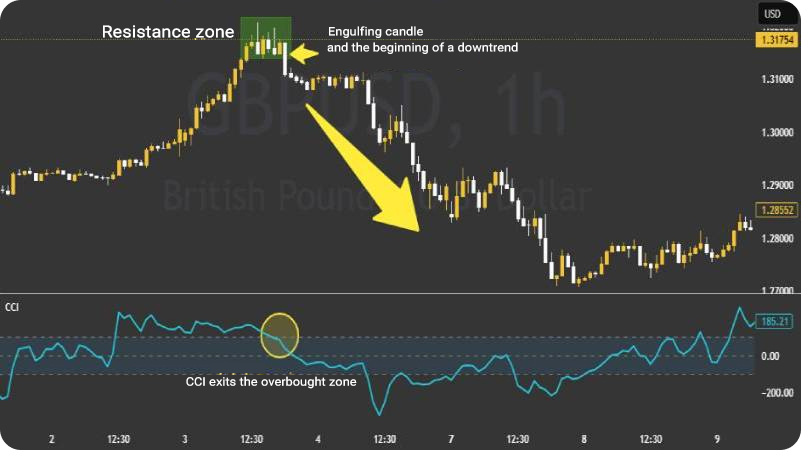
For example, if a bearish engulfing candle forms near a resistance level while the CCI exits the overbought zone, this combination serves as a strong sell signal.
Using Classic Price Action with CCI
In classical price action trading, traders focus on breakouts, pullbacks, and the overall market trend. Here’s how the CCI can complement that analysis:
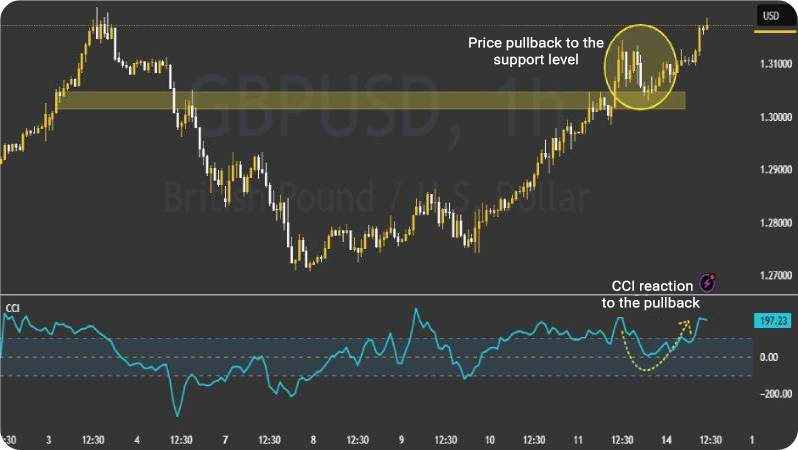
- If the price breaks above a resistance level, then pulls back to retest it, and the CCI remains in the overbought area, it may signal weak upward momentum, warning traders that entering at this point could be risky.
- However, if during the pullback the CCI exits the overbought zone and then returns to it again, it strengthens the likelihood of the uptrend continuation.
This combination of CCI and price action provides traders with a clearer picture of market sentiment and enhances the precision of both entry and exit strategies.
Why Traders in Smart Money Concepts (SMC) and ICT Strategies Use the CCI Indicator
Traders who follow Smart Money Concepts (SMC) or ICT-style trading believe that institutional players, such as banks and large financial institutions, largely drive major market movements. Their approach focuses on identifying these players’ entry and exit points by analyzing price behavior alongside liquidity zones and order blocks.
Within this framework, the Commodity Channel Index (CCI) serves as a supporting or filtering tool that helps confirm the strength or weakness of price movements:
- When the price reaches a liquidity zone and the CCI shows divergence, it can indicate a potential market reversal.
- If the CCI enters the overbought area within a supply zone (where price is expected to decline), it increases the probability of a price drop.
Combining CCI and MACD Indicators
Integrating the CCI (Commodity Channel Index) with the MACD (Moving Average Convergence Divergence) provides traders with a powerful strategy for identifying divergences, evaluating trend strength, and timing market entries and exits more effectively. This combination also helps define take-profit and stop-loss levels with greater precision.
In this strategy:
- The CCI identifies overbought and oversold conditions, while
- The MACD highlights divergences and crossovers, confirming trend direction and momentum.
Example of buy signal:
When a bullish divergence appears between price and the MACD, and simultaneously, the CCI exits the oversold zone, this can be interpreted as a buy entry signal.
Example of sell signal:
When a bearish divergence appears alongside the CCI exiting the overbought zone, it serves as a warning for a potential sell opportunity or exit signal.
For stop-loss placement, traders can:
- Set it slightly below the recent low in long positions, or
- Slightly above the recent high in short positions.
Take-profit levels can be set using resistance zones or risk-to-reward ratios.
This combined strategy improves analysis accuracy and enhances risk control, particularly in volatile markets.
Common Mistakes When Using the CCI Indicator
The CCI is a powerful technical analysis tool, but improper use can lead to costly mistakes. Below are the most frequent errors traders make and how to avoid them:1. Over-reliance on +100 and –100 levels
- Mistake: Many traders assume that crossing +100 means “sell” and crossing –100 means “buy.”
- Why it’s wrong: These levels only indicate potential overbought or oversold conditions, not a guaranteed reversal. Prices can continue rising after +100 or falling after –100.
- Solution: Don’t rely solely on these numbers. Confirm signals with price behavior, candlestick patterns, or support/resistance zones.
2. Using CCI in Range-Bound Markets
- Mistake: In sideways markets, the CCI often produces false signals.
- Why it’s wrong: The CCI is designed to measure trend strength, not sideways movement. In a range, crossing +100 or –100 often reflects normal fluctuations, not real trend shifts.
- Solution: Use tools like Moving Averages or Bollinger Bands to check whether the market is trending before applying the CCI. In range conditions, reduce your reliance on it.
3. Ignoring CCI Signals
- Mistake: Some traders add the CCI to their charts but ignore its signals, relying instead on intuition.
- Why it’s wrong: That’s like having a map and driving without looking at it. The CCI provides valuable insight into market conditions.
- Solution: Pay attention to major shifts, especially entries into overbought or oversold areas, and combine those signals with your own analysis.
4. Using the CCI Alone
- Mistake: Some believe the CCI alone is sufficient for trading decisions.
- Why it’s wrong: No single indicator is perfect. The CCI may generate signals, but without confirmation from other tools, they may lack reliability.
- Solution: Combine the CCI with trendlines, key levels (support/resistance), or even fundamental factors for more accurate trading decisions.
5. Poor Risk Management
- Mistake: Many traders focus solely on CCI signals and forget that every trade involves risk.
- Why it’s wrong: The CCI cannot always predict market direction. Without proper risk management, one mistake can wipe out your capital.
- Solution: Always use stop-loss orders and position sizes that align with your risk tolerance. Never risk more than you can afford to lose.
The Role of the CCI Indicator in Risk Management
According to a report on Picture Perfect Portfolios, the CCI indicator is not only useful for detecting overbought and oversold levels, but it can also serve as a filter to confirm or reject potential trade entries. Filtering signals with the CCI reduces uncertain trades and enhances the consistency of a trading strategy.
This is why many professional traders use the CCI not just for identifying entry opportunities but also for risk control and capital preservation.
However, it’s important to remember that the CCI should not be used as a standalone trading system. When combined with support and resistance levels or confirmed by other technical tools, it helps define stop-loss and take-profit levels more precisely and improves the risk-to-reward ratio.
Conclusion
A deep understanding of the Commodity Channel Index (CCI) provides traders with a more professional and predictive perspective on market movements, one that allows them to anticipate trends intelligently rather than merely react to price fluctuations.
If you’re looking for a tool that not only confirms trends but also helps pinpoint optimal entry and exit timing with high precision, the CCI indicator is an effective and reliable addition to your trading toolkit.


