


Pinpointing the exact end of a trend and the beginning of a reversal is one of the most challenging, yet profitable, skills in technical analysis. Many reversal signals can be ambiguous or deceptive, often catching traders in market traps. Among these, the Counterattack candlestick pattern gains special importance as a clear signal of a sudden shift in power between buyers and sellers.
This article analyzes the structure, market psychology, and trading strategies associated with this pattern to determine when a “counterattack” is a valid sign of a trend reversal and when it might be nothing more than a deception.

- Compared to the Engulfing pattern, the Counterattack pattern is considered a weaker reversal signal.
- This pattern can sometimes signal the beginning of a consolidation period or a sideways market, rather than a full trend reversal.
- It is preferable for the second candle (the counterattack candle) to cover at least 80% of the first candle's body.
- In low-liquidity markets, the likelihood of this pattern generating a false signal increases due to the higher frequency of price gaps.
What is the Counterattack Pattern?
According to Elearnmarkets, the Counterattack Pattern is a two-candlestick reversal pattern in technical analysis. This pattern illustrates a sudden and intense battle between buyers and sellers, where the group that was losing control of the market surprisingly regains power with a swift move, halting the prevailing trend.
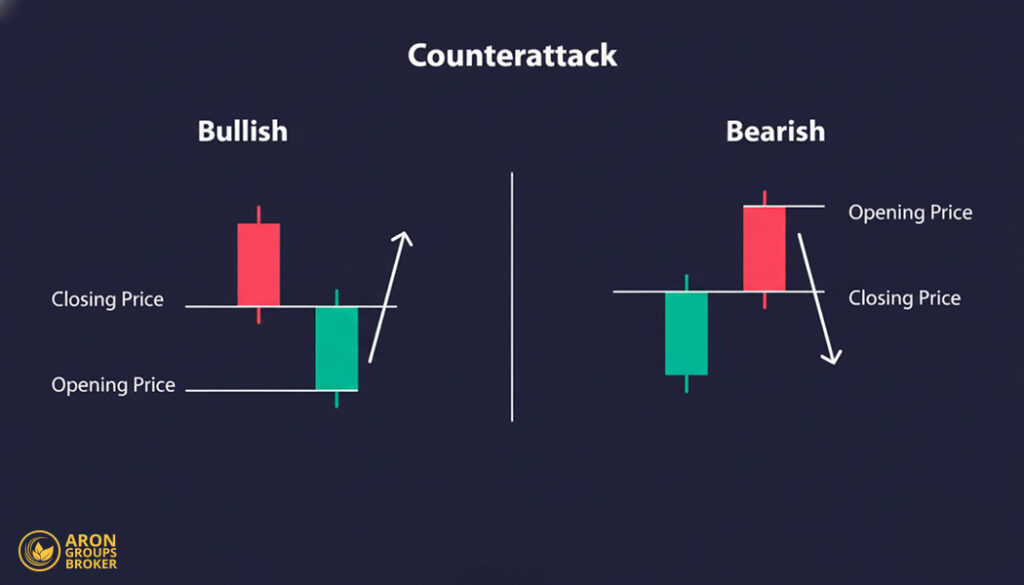
The key characteristic of this pattern is that it consists of two long candles of opposite colors whose closing prices are nearly identical. This parity in closing prices signifies a complete stalemate, indicating that all the ground gained by the first candle was neutralized entirely by the second.
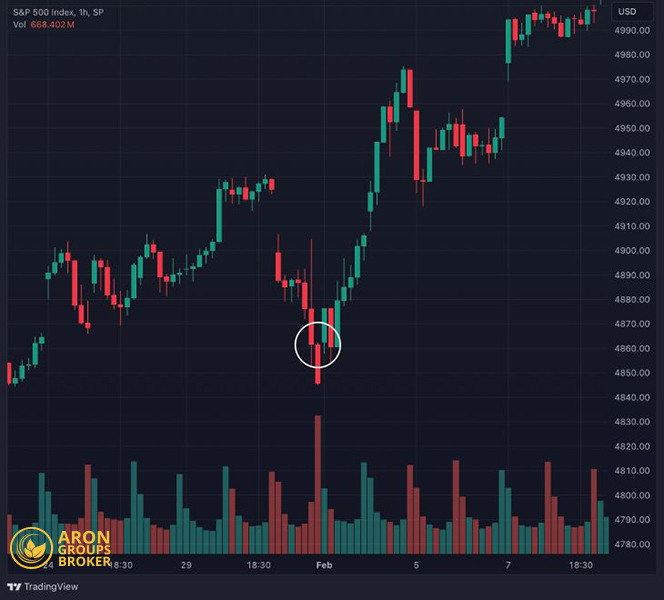
Example: Imagine the price of a cryptocurrency is in a strong downtrend, and sellers have been pushing the price down for several consecutive days.
- First Candle: On Monday, a very strong red (bearish) candle forms, signaling peak selling pressure. The price closes at its lowest point, and everyone expects the decline to continue.
- Second Candle (The Counterattack): On Tuesday, the market opens with a price gap downwards (the opening price is lower than yesterday’s close). However, immediately after the open, buyers enter the market in full force, driving the price up throughout the day. By the end of the day, the candle closes as a strong green (bullish) candle, with its closing price being almost identical to the close of yesterday’s red candle.
This move is a full-fledged “counterattack” by the buyers against the sellers. Although the day began with pessimism, by its end, all of the previous day’s selling pressure had been neutralized. This pattern provides a strong signal that the sellers’ power is likely exhausted, and the trend may soon turn bullish.
Candlestick Structure and Precise Methods for Identifying the Counterattack Pattern
Accurately identifying the Counterattack pattern depends on spotting two consecutive candles with specific characteristics. In the following sections, we will break down the details of each candle and the conditions necessary for the pattern’s validity.
Features of the First Candle
The first candle in the Counterattack pattern represents the peak of power and confidence for the dominant market group (buyers or sellers). This candle always aligns with the current trend in both color and direction and has the following features:
- Long and Strong Body: This candle typically has a long real body, indicating decisive buying or selling pressure during that period.
- Aligned with the Trend:
- In an uptrend, the first candle is a long green (bullish) candle.
- In a downtrend, the first candle is a long red (bearish) candle.
By itself, this candle appears to be a continuation signal, convincing traders that the trend will forcefully proceed on its course.

The reliability of this pattern depends on the ratio between the body’s range and its shadows. Symmetrical bodies with longer-than-average shadows usually indicate smart money distribution or accumulation.
Specifications of the Second Candle (The Counterattack Candle)
The counterattack candle is the star of this pattern and the element that catches the market by surprise. It acts in the exact opposite manner of the first candle, neutralizing all its momentum. Its key specifications are:
- Opening with a Gap: The candle opens with a price gap in the direction of the previous trend. (A positive gap in a bearish counterattack and a negative gap in a bullish counterattack).
- Opposite Color: The color of this candle is always the opposite of the first candle.
- Powerful Reversal Move: After opening, the price moves strongly against the trend, completely filling the price gap.
- Equal Closing Price: The most crucial feature is that its closing price is very close or identical to the closing price of the first candle. This indicates that a new force has entered the market and has completely neutralized the power of the previous group.
The Impact of Trading Volume on the Pattern’s Validity
Trading volume is one of the most critical confirmation tools for the Counterattack pattern. A pattern that isn’t supported by volume can be a trap or a weak signal. To assess the pattern’s validity using volume, consider the following points:
- Increased Volume on the Second Candle: A valid Counterattack pattern should be accompanied by high trading volume (higher than the first candle and recent average volume).
- Psychological Interpretation: High volume on the second candle suggests that “smart money” and major market players are behind the reversal. This high volume lends credibility to the counterattack and significantly increases the pattern’s probability of success.
- How to Evaluate: Activate the Volume indicator on your trading platform. If the volume bar corresponding to the second candle is visibly taller than the preceding bars, the signal is stronger.
Optimal Timeframes and Market Conditions for Using the Counterattack Pattern
The effectiveness of the Counterattack pattern is highly dependent on the market context and conditions. Using it in unsuitable situations can lead to false signals.
- Best Timeframes: The pattern is much more reliable on higher timeframes, such as the daily (D) and weekly (W) charts. On these timeframes, price movements reflect more fundamental shifts in overall market sentiment and have less market noise. On lower timeframes (like the 1-hour or 15-minute), the pattern appears more frequently, but the probability of failure is also higher.
- Best Market Conditions: The Counterattack is a reversal pattern, so it should be used at the end of a strong, well-defined trend. Look for this pattern after a prolonged uptrend or downtrend. Its formation in a sideways or ranging market lacks analytical validity and should not be used as a basis for a trade.
Sometimes, the counter-attack pattern is part of a liquidity grab setup. In this case, the first candle sweeps liquidity from the market, and the counter-attack candle serves as the final confirmation of that liquidity collection.
Types of Counterattack Patterns
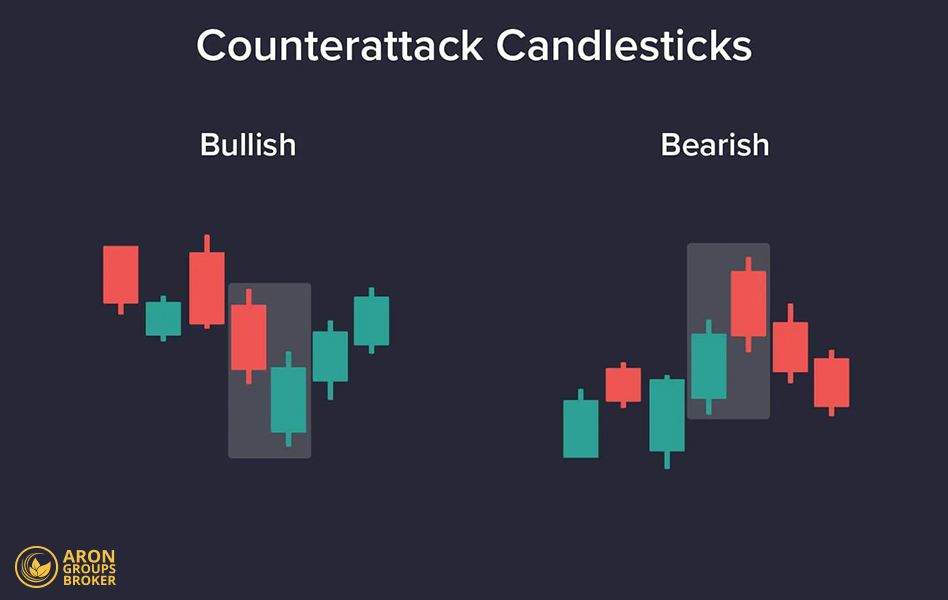
This pattern appears on charts in two forms: bullish and bearish.
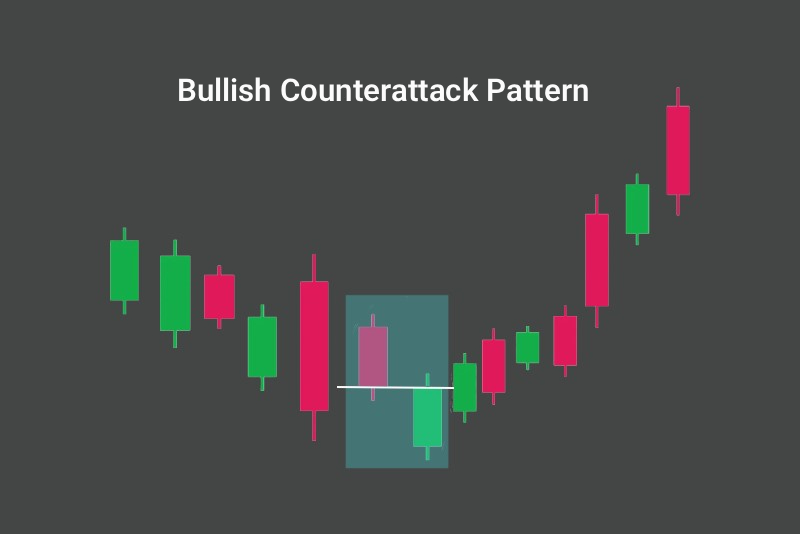
Bullish Counterattack Pattern
This pattern forms at the end of a downtrend and signals a potential end to selling pressure and the beginning of a bullish move.
- First Candle: A long red (bearish) candle.
- Second Candle: The market opens with a price gap downwards, but buyers enter forcefully, driving the price up. The candle closes as a green (bullish) candle, near the closing price of the first candle.
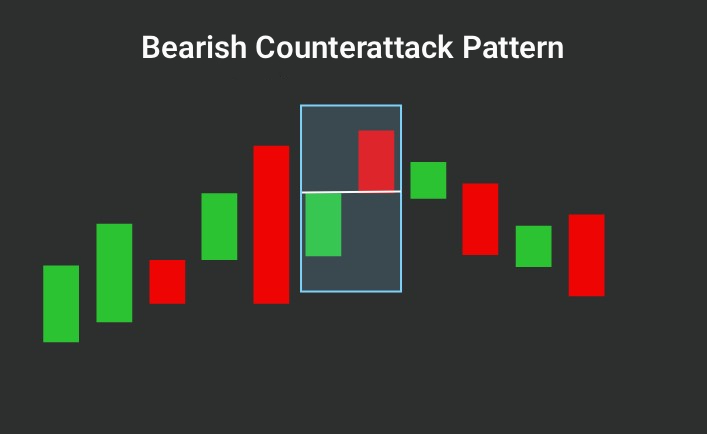
Bearish Counterattack Pattern
This pattern appears at the end of an uptrend and can signal the exhaustion of buying power and the start of a bearish move.
- First Candle: A long green (bullish) candle.
- Second Candle: The market opens with a price gap upwards, but sellers take control of the market and push the price down. The candle closes as a red (bearish) candle, near the closing price of the first candle.
Market Psychology Behind the Counterattack Pattern
The Counterattack pattern tells a clear story of a sudden shift in market sentiment.
What Causes the Market to Launch a Counterattack?
At the end of a trend, the leading group (e.g., buyers in an uptrend) may experience exhaustion or reach significant resistance levels. At the same time, an unexpected news release, the price reaching a key level, or simply an overextended move can trigger the opposing group to launch a surprise counterattack.
The Role of Key Market Players in Forming the Pattern
The high volume on the second candle indicates that major players (financial institutions) have entered the market. They often wait for market excitement to peak and then forcefully trade in the opposite direction. This heavy volume of orders acts like a dam against the trend’s momentum, causing the price to reverse rapidly and form the Counterattack pattern.
How to Interpret the Price Action After the Pattern Forms
The fact that the second candle’s close is nearly identical to the first’s shows that all the gains achieved by the leading group in the first candle were wiped out in the next. This represents a significant psychological defeat for the leading group and a decisive victory for the attackers, setting the stage for a new move in the opposite direction.
How to Trade the Counterattack Pattern in Forex and Crypto
Trading the Counterattack pattern in volatile markets like Forex and Crypto requires a precise strategy and strict risk management. Simply spotting the pattern is not enough to enter a trade; it should be treated as an initial signal. Traders must then use confirmations to define the entry point, stop-loss, and take-profit levels.
A successful trading strategy based on this pattern includes three key components:
- Entry Point: Identifying the precise moment when the probability of a successful trade is highest.
- Stop-Loss: Determining a price level at which the pattern analysis is invalidated, requiring an exit from the trade with a minimal loss.
- Take-Profit: Setting a logical price target to close the trade and realize profits.
In the following sections, we will examine each of these components in detail, along with methods for combining the pattern with other indicators.
How to Determine Entry Points for the Counterattack Pattern
Entering a trade prematurely is one of the biggest mistakes when using candlestick patterns. The best approach is to wait for confirmation of the reversal move.
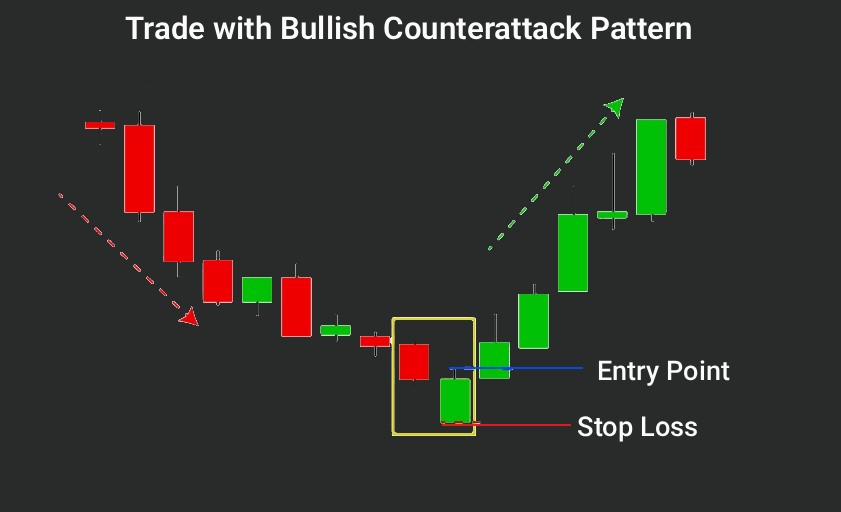
- For a Bullish Counterattack: Never enter a buy order immediately after the second (green) candle closes. Wait for the price to break above the high of the second candle and for a new candle to open above it. This breakout confirms that buyers are still in control and that the bullish momentum is continuing. Your entry point should be slightly above the high of the second candle.
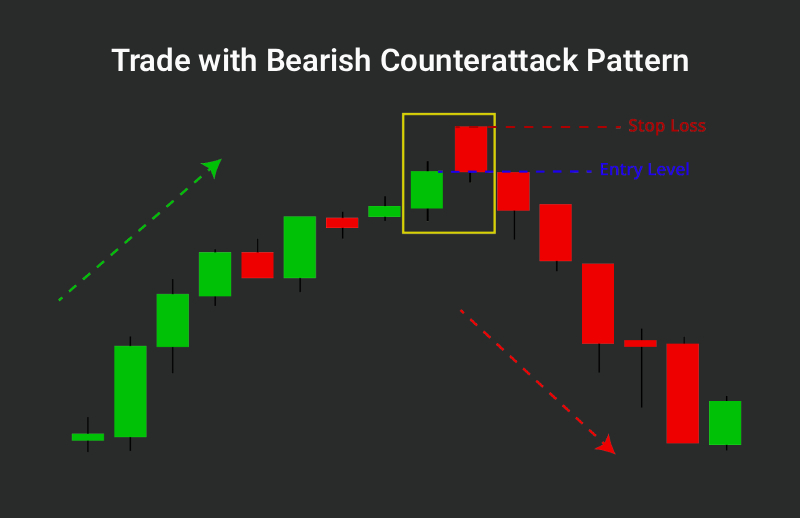
- For a Bearish Counterattack: After spotting the pattern, do not rush to enter a sell order. Wait for the price to break below the low of the second (red) candle. This action indicates that selling pressure has overcome buying power. Your entry point should be slightly below the low of the second candle.
This conservative strategy significantly reduces the risk of entering on a false signal.
How to Set Stop-Loss and Take-Profit Levels
Risk management is the most critical part of any trading strategy.
Setting the Stop-Loss
- For a Bullish Counterattack: The stop-loss should be placed slightly below the low of the second (counterattack) candle. If the price returns to this level, the pattern’s logic is violated, and the buyers’ momentum has faded.
- For a Bearish Counterattack: The stop-loss should be set slightly above the high of the second candle. A price move above this level signifies that the bearish pattern has failed.
Setting the Take-Profit
You can use several methods to determine your take-profit target:
- Risk/Reward Ratio: The simplest method is to set a logical ratio, such as 1:2 or 1:3. This means if the distance from your entry to your stop-loss is 100 pips, your take-profit target would be 200 or 300 pips away.
- Support and Resistance Levels: Identify key resistance levels (for buy trades) or support levels (for sell trades) on higher timeframes and set your take-profit target just before the price reaches them.
- Fibonacci Tools: You can use Fibonacci retracement or projection levels to forecast potential price targets.
Combining the Counterattack Pattern with the RSI
The Relative Strength Index (RSI) is an excellent tool for confirming the validity of the Counterattack pattern by measuring market momentum.
- Bullish Confirmation: A Bullish Counterattack pattern becomes highly reliable when the RSI is in the oversold region (typically below 30). This condition indicates that selling pressure is exhausted, and the market is poised for a bullish move. An even stronger signal is the presence of bullish divergence between the price and the RSI.
- Bearish Confirmation: The credibility of a Bearish Counterattack pattern increases when the RSI is in the overbought region (typically above 70). This suggests buyer exhaustion and a high probability of a bearish move. The presence of bearish divergence is also a very powerful confirmation.
Combining the Counterattack Pattern with Moving Averages
Moving Averages (MAs) act as dynamic support and resistance levels and help in understanding the overall market trend.
- Bullish Counterattack at Support: If a Bullish Counterattack pattern forms directly on a significant moving average (such as the 50, 100, or 200 MA), it is a very strong buy signal. This indicates that the price is supported not only by the pattern but also by a key support level. This strategy is particularly useful for finding entry points during pullbacks in an uptrend (buying the dip).
- Bearish Counterattack at Resistance: Similarly, if a Bearish Counterattack pattern appears below a key moving average that is acting as resistance, the validity of the sell signal increases significantly. This combination suggests that the uptrend has hit a major barrier and is likely to reverse.
If a counterattack candle is accompanied by a sudden surge in volume but closes within the 50% range of the previous candle, it is a sign of liquidity absorption and a trend trap, not a confirmed reversal.
Risks, Limitations, and Common Mistakes When Using the Counterattack Pattern
Like any other tool in technical analysis, the Counterattack pattern is not flawless, and its improper use can lead to losses. Being aware of this pattern’s weaknesses will help you use it with a more realistic perspective.
Key Risks
- False Signals: The biggest risk is that the pattern does not signal a true reversal but merely a temporary pause in the trend. In this scenario, the price resumes its original direction after the pattern forms, placing traders in a losing position. This is why waiting for a confirmation candle is essential.
- High Volatility from News Events: In markets like Forex and Crypto, the release of important economic news or an unexpected event can easily invalidate a technical pattern. The pattern might form correctly, but a sudden news event could change the market’s direction and trigger your stop-loss.
Pattern Limitations
- Ineffectiveness in Ranging Markets: This is a reversal pattern, meaning it is only valid and meaningful at the end of a well-defined trend (either uptrend or downtrend). Using it in a market that is consolidating or moving sideways is ineffective and produces misleading signals.
- Need for Additional Confirmation: The Counterattack pattern is not a complete trading strategy on its own. Its validity heavily depends on other factors, such as trading volume, confirmation from indicators (like the RSI), and its formation near key support and resistance levels. Without confirmation, the pattern has low predictive power.
Common Trader Mistakes
- Entering the Trade Too Early: The most common mistake is entering a trade immediately after the second candle closes. A professional trader waits for the price to break above the high (in a bullish counterattack) or below the low (in a bearish counterattack) of the second candle to receive the necessary confirmation for entry.
- Ignoring Trading Volume: A Counterattack pattern accompanied by low trading volume (especially on the second candle) is not valid. It indicates insufficient support from major market players for the price reversal. Trading based on such a pattern carries a high risk.
- Trading Without a Stop-Loss: Due to the pattern’s powerful appearance, some traders neglect to set a stop-loss. This is a critical mistake. Any pattern can fail, and not having a stop-loss can lead to significant losses.
- Ignoring the Broader Context: A trader might spot a perfect Bullish Counterattack pattern but fail to notice that it has formed just below a major resistance level on a higher timeframe. Always analyze the overall market context and key levels before entering a trade.
Automated Tools and Methods for Identifying the Counterattack Pattern
Manually scanning charts to find a specific pattern can be time-consuming and tedious. Fortunately, modern trading platforms offer tools to automate this process. Using these tools helps you quickly identify trading opportunities across various markets and avoid emotion-based analysis.
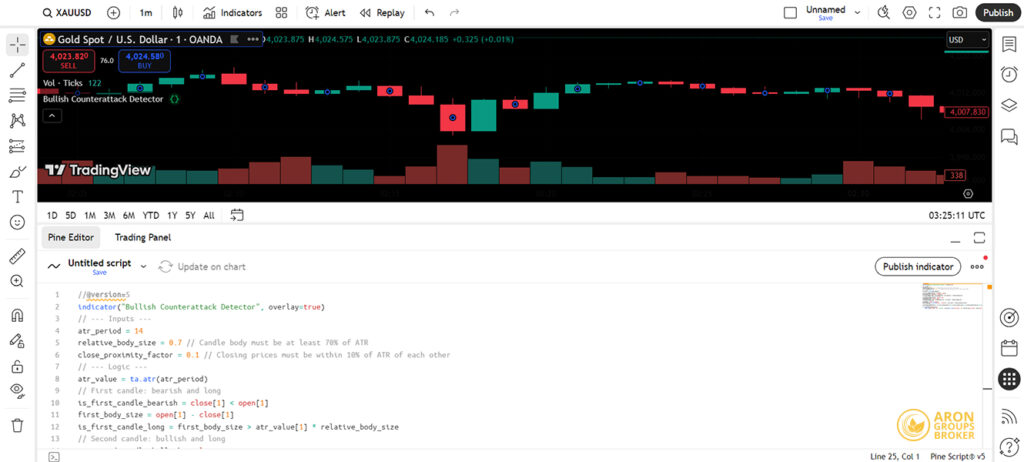
Using Pine Script for Automated Identification of the Counterattack Pattern
For traders seeking greater flexibility and customization, the Pine Script programming language in TradingView is the best option. You can use it to build a custom indicator that identifies the Counterattack pattern based on your specific rules (e.g., combining it with volume or RSI) and marks it on the chart.
Example: Code for Identifying the Bullish Counterattack Pattern
The code below is a simple example for identifying this pattern. You can copy it directly into the Pine Editor in TradingView and add it to your chart.
Pine Script
//@version=5
indicator(“Bullish Counterattack Detector”, overlay=true)
// — Inputs —
atr_period = 14
relative_body_size = 0.7 // Candle body must be at least 70% of ATR
close_proximity_factor = 0.1 // Closing prices must be within 10% of ATR of each other
// — Logic —
atr_value = ta.atr(atr_period)
// First candle: bearish and long
is_first_candle_bearish = close[1] < open[1]
first_body_size = open[1] – close[1]
is_first_candle_long = first_body_size > atr_value[1] * relative_body_size
// Second candle: bullish and long
is_second_candle_bullish = close > open
second_body_size = close – open
is_second_candle_long = second_body_size > atr_value * relative_body_size
// Pattern conditions
is_gap_down = open < close[1]
are_closes_near = math.abs(close – close[1]) < (atr_value * close_proximity_factor)
// — Detection —
is_bullish_counterattack = is_first_candle_bearish and is_first_candle_long and is_second_candle_bullish and is_second_candle_long and is_gap_down and are_closes_near
// — Plotting —
if is_bullish_counterattack
label.new(bar_index, low, “↑\nB-CA”, color=color.new(color.green, 70), textcolor=color.white, style=label.style_label_up)
How to Use the Code:
- In TradingView, click on the Pine Editor tab at the bottom of the screen.
- Delete any existing code and paste the code above.
- Click the “Add to Chart” button.
Now, whenever a Bullish Counterattack pattern forms on your chart according to the rules defined in the code, a green label (↑ B-CA) will appear below that candle.
Conclusion
The Counterattack pattern is a powerful signal of a sudden shift of power in the market. This pattern indicates that the group that was in control moments before has been caught off guard and forced to retreat. However, smart traders know that this pattern is not sufficient on its own.
Success in using the Counterattack pattern depends on waiting for confirmation, combining it with other analytical tools, and adhering to proper risk management principles. By deeply understanding the psychology behind this pattern and practicing its identification, you can turn it into an effective tool in your trading arsenal.
Source: thetradinganalyst


