


Understanding price movement and market trends has always been a key concern for traders. Sometimes, predicting the next market direction isn’t straightforward, and analytical tools can significantly aid in making better decisions. One such tool that many professional traders pay close attention to is the DMI (Directional Movement Index). This tool helps you not only better understand the market’s direction but also assess its strength. If you’re curious about how the DMI Indicator works, when to use it, and how to generate entry and exit signals with it, keep reading this article.

- The DMI Indicator helps identify both the direction and strength of price movement, enabling smarter trading decisions.
- An ADX value above 25 indicates a higher chance of a strong, sustainable trend.
- For better accuracy, combine the DMI Indicator with tools like RSI or moving averages to reduce false signals.
What is the DMI Indicator (Directional Movement Index)?
Traders use the DMI Indicator to assess price trend direction and strength more effectively.The tool, officially called the Directional Movement Index, was created by Welles Wilder in 1978.
DMI has two core lines: +DI shows buying pressure, while -DI reflects selling pressure. Comparing these lines helps traders identify whether the market favors an uptrend or a downtrend.
Adding ADX (Average Directional Index) enables traders to measure trend strength alongside direction. This combination makes DMI popular on platforms like TradingView for daily market analysis.

According to Investopedia, this tool "allows traders to maintain focus on the prevailing trend without getting caught up in short-term fluctuations," emphasizing the importance of correct usage.
How to Calculate the DMI Indicator (Directional Movement Index)
In technical analysis, when discussing the DMI (Directional Movement Index), traders are often curious about how it measures both the direction and strength of a trend. Simply put, the DMI Indicator uses the high and low price data over a given time period (usually a 14-period), where two directional values are defined:
- +DM, which represents the strength of the upward movement,
- -DM, which represents the strength of the downward movement.
Next, using a concept called True Range (TR), which examines the most extensive price range, the +DM and -DM values are normalised using the Wilder Smoothing technique.
In summary:
Formula for DMI Calculation:
- +DI = (Smoothed +DM / TR) × 100
- -DI = (Smoothed -DM / TR) × 100
While the calculations may seem complex at first glance, there’s no need to worry. Trading platforms like TradingView automatically perform these calculations for you. You only need to understand the concept to analyze the market trend effectively using the DMI Indicator, along with other trend-following indicators.
Main Components of the DMI Indicator
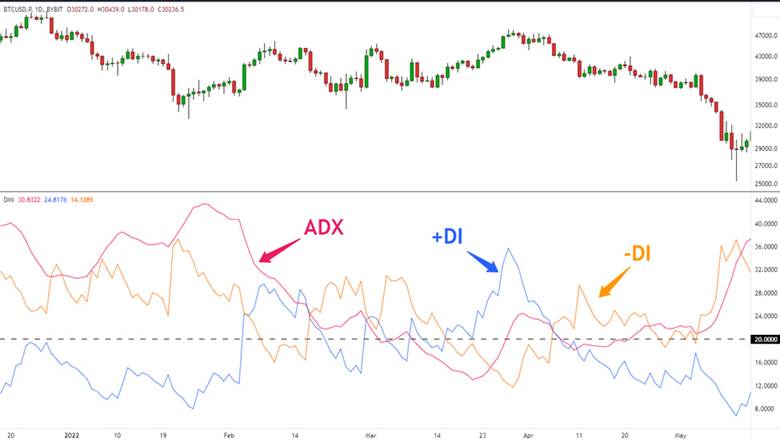
The DMI Indicator (Directional Movement Index) consists of three main components, each playing a vital role in trend analysis:
- +DI (Positive Directional Indicator): This part of the DMI Indicator shows an uptrend and increases when the current prices are higher than previous prices, indicating buying pressure.
- -DI (Negative Directional Indicator): This component of the Directional Movement Index measures a downtrend and rises when current prices are lower than past prices, indicating selling pressure.
- ADX (Average Directional Index): The ADX Indicator measures the overall strength of the trend, regardless of its direction. Values above 25 suggest a strong trend, while values below 20 indicate a market without a clear trend.
Together, these three components of the DMI Indicator provide traders with valuable insights into both the direction and strength of market trends. For more detailed information on the ADX Indicator, you can refer to the related article.
How to Identify Market Trends with the DMI Indicator
To identify market conditions using the DMI Indicator (Directional Movement Index), simply observe the position of the +DI and -DI lines on the chart.
- If the +DI is higher than the -DI, it typically signals more buying pressure, indicating that the market is in an uptrend.
- Conversely, when the -DI is positioned above the +DI, the likelihood of a downtrend increases.
However, to confirm whether the trend is truly strong, it’s essential to also check the ADX Indicator. If the ADX value is above 25, it indicates a strong trend. If it’s below 20, the market is likely neutral or directionless.
In general, the DMI Indicator is most effective when you closely observe the crossover of the DI lines and the ADX level. For a more advanced analysis, combining this with other trend-related tools can significantly improve the accuracy of your market predictions.
According to TrendSpider, when the +DI and -DI remain close to each other and the ADX is low, the market is likely in a neutral, non-trending state.
How to Identify Entry and Exit Points with the DMI Indicator
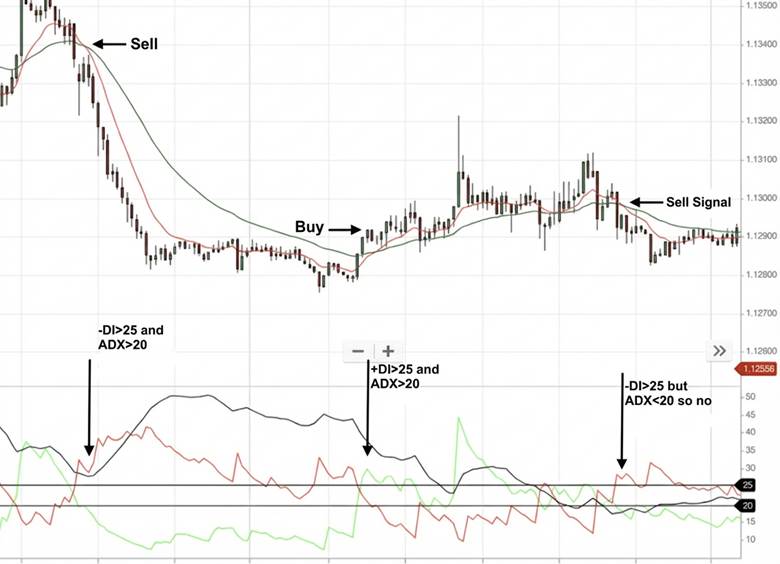
To identify entry and exit points using the DMI Indicator (Directional Movement Index), traders focus on the crossover of the +DI and -DI lines. This method is part of the DMI Indicator strategy for recognizing potential buy and sell signals.
Entry Signal: When to Buy
When the +DI line crosses above the -DI line, it produces a buy signal, indicating the potential start of an uptrend. This shows that buying pressure is stronger than selling pressure. Understanding how to use the DMI Indicator in this way is crucial for traders looking to enter a position at the right moment.
Exit Signal: When to Sell
On the other hand, when the -DI crosses above the +DI, it triggers a sell signal, pointing to a possible downtrend. This indicates that selling pressure is dominating the market. Knowing when to use the DMI Indicator for exits is just as important as recognizing entry points.
Confirming the Trend with the ADX Indicator
For more accurate signals, it’s essential to also check the ADX (Average Directional Index), which measures the strength of the trend. If the ADX value is above 25, it suggests that the trend is strong, making the buy or sell signal more reliable. This is where understanding DMI vs ADX becomes important for traders to distinguish between strong and weak trends.
Q: What is the ideal ADX value to confirm a trend’s strength when using the DMI Indicator?
A: An ADX value above 25 indicates a strong trend, while a value below 20 suggests a neutral or non-trending market.
To reduce potential losses, traders should apply risk management strategies. For example, set stop-loss orders below the lowest price for a buy signal or above the highest price for a sell signal.
Combining the DMI Indicator with the ADX Indicator
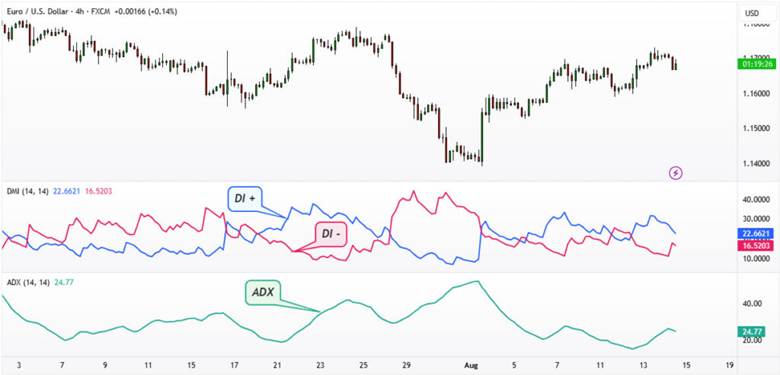
Combining the DMI Indicator with the ADX Indicator helps analysts examine the market with greater accuracy. While the DMI Indicator with its +DI and -DI lines shows the direction of price movement (upward or downward), the ADX Indicator measures the strength of the trend.
For example, if the +DI crosses above the -DI and the ADX is above 25, it indicates a strong uptrend, making it a more reliable signal for entering a trade. This combination significantly reduces the likelihood of false signals.
For even better results, it’s recommended to use the DMI Indicator alongside other tools, such as momentum indicators like the RSI Indicator, to optimize entry and exit points.
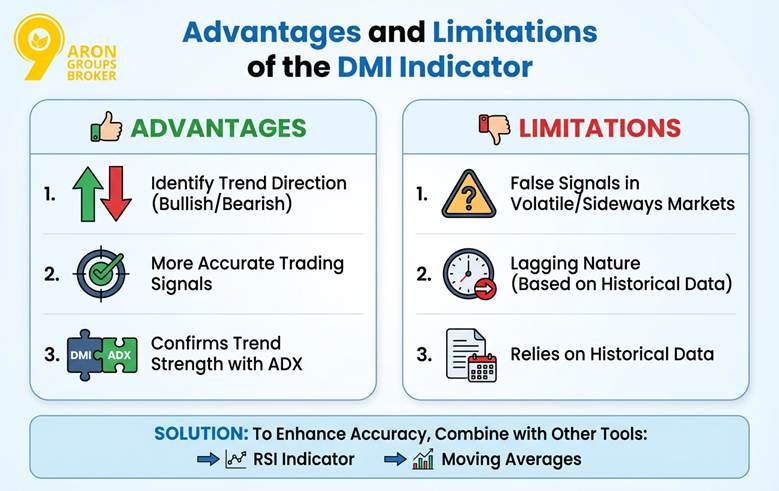
Advantages and Limitations of the DMI Indicator
The DMI Indicator (Directional Movement Index) is a powerful tool for identifying both the direction and strength of trends in financial markets. It helps traders detect bullish or bearish trends and receive more accurate trading signals. When combined with the ADX Indicator, it also provides confirmation of trend strength.
However, the DMI Indicator may generate false signals in volatile or sideways markets because it relies on historical data and can sometimes have a lag. To enhance accuracy, it’s recommended to combine the DMI Indicator with other tools such as the RSI Indicator or moving averages to reduce the likelihood of errors and make the analysis more reliable.
Q: Can the DMI Indicator generate false signals, and how can traders reduce this risk?
A: Yes, in volatile or sideways markets, the DMI may produce false signals. Combining it with ADX, RSI, or moving averages improves reliability.
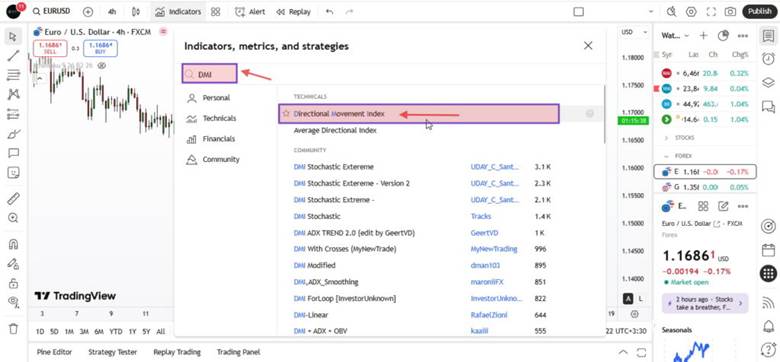
How to Activate and Set Up the DMI Indicator in TradingView
To activate the DMI Indicator in TradingView, open a chart and click on the “Indicators” icon. Then, type “DMI” or Directional Movement Index in the search bar and select the Directional Movement Index from the list.
By default, the DMI Indicator settings use a 14-period, which works for most markets. However, for more volatile markets, you may want to adjust the period to 10 to increase sensitivity.
Once added, the +DI (upward movement), -DI (downward movement), and ADX (trend strength) lines will appear on the chart. The +DI and -DI lines show the trend direction, while the ADX Indicator confirms trend strength. If the ADX is above 25, it indicates a strong trend.
You can customize the line colors for better readability. For a more effective DMI crossover strategy, watch for when the +DI crosses above the -DI for a buy signal, or when the -DI crosses above the +DI for a sell signal.
Q: How can traders adjust the DMI Indicator settings in TradingView for more sensitive analysis?
A: Traders can shorten the default period from 14 to 10 for volatile markets. Adjusting line colors improves chart readability.
Conclusion
Accurate market analysis isn’t achieved just by looking at charts; it requires a deeper understanding of price behaviour and the strength of its movements. The DMI Indicator allows traders to evaluate market trends not only in direction but also in strength. However, it is the skill in interpreting data correctly that makes the real difference.
When the Directional Movement Index is used within a cohesive analytical approach, it can lead to more precise decision-making. Consistent use of this tool, along with practice, reviewing past market data, and developing an analytical perspective, will pave the way for real growth for every trader.


