


In technical analysis, one of the popular methods for assessing price volatility and identifying optimal entry and exit points in the market is using the Donchian Channel. This tool provides a clear picture of price behavior by showing the highest and lowest prices within a specified time period. It helps traders better understand the market’s trend and make more informed decisions. By combining data from the Donchian Channel indicator with other analytical tools, traders can enhance their decision-making accuracy and play a significant role in effective risk management.
If you’re looking to learn practical and actionable methods for using this indicator, stay with us until the end of the article.

- The Donchian Channel offers a clear view of price fluctuations by plotting the highest and lowest prices within selected periods.
- The Donchian Channel is effective for breakout trades in trending markets and less so in low-volatility conditions.
- Combining the Donchian Channel with indicators like RSI or MACD enhances trend confirmation and reduces false signals.
- Using the Donchian Channel in a demo account helps assess performance and refine strategies with minimal risk.
What is the Donchian Channel and How is it Used?
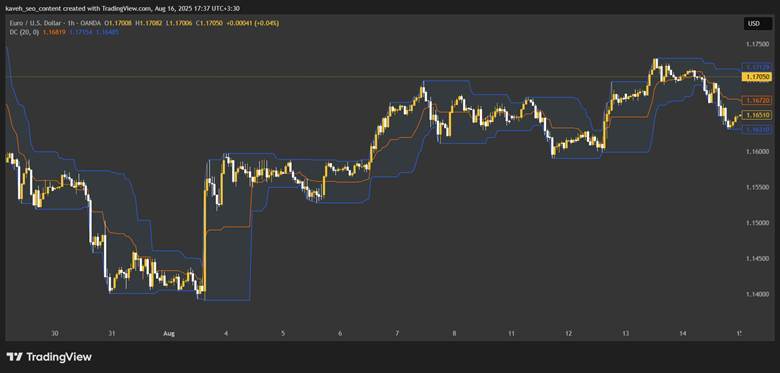
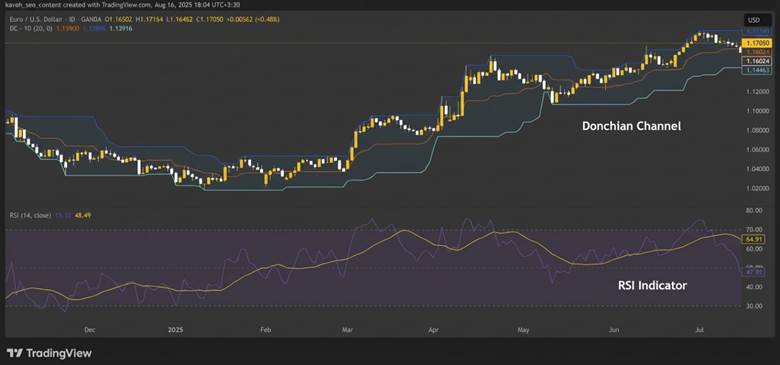
The Donchian Channel is a technical indicator developed by Richard Donchian, known as the father of trend-following trading, in the 1940s. This tool identifies trends and breakout points (price breakouts) by plotting the highest high and lowest low over a specified period (typically 20 days). Due to its simplicity, the Donchian Channel indicator is widely used in financial markets like Forex and cryptocurrency.
By displaying upper, lower, and middle bands, the Donchian Channel shows market volatility and helps traders identify potential entry or exit opportunities. For example, in Forex, a breakout above the upper line can signal a buying opportunity, while in the cryptocurrency market, it helps identify sharp price movements.
Components of the Donchian Channel and How It’s Calculated
The Donchian Channel consists of three main components, calculated over a specified time period, typically N (usually 20 periods). This simple yet effective tool helps identify price volatility and market trends. It provides a clear structure for analyzing price behavior, and many traders use it alongside other trend indicators for more accurate decision-making.
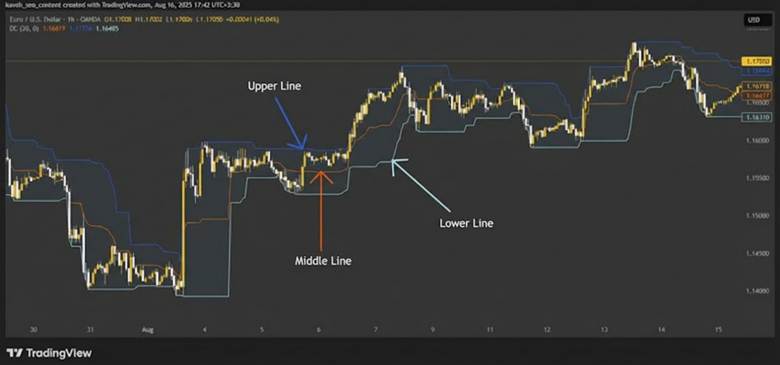
Upper Line and Its Calculation
The upper line of the Donchian Channel represents the highest price over the past N periods. This line serves as a dynamic resistance level. For example, in a Forex candlestick chart, if the price touches the upper line, it may signal strong resistance or a potential breakout to the upside.
Lower Line and Its Calculation
The lower line of the Donchian Channel shows the lowest price over the past N periods, acting as a dynamic support level. A breakout below this line, particularly in volatile markets like cryptocurrency, can indicate selling pressure and signal a potential downtrend.
Middle Line and Its Role in Analysis
The middle line of the Donchian Channel is the average of the upper and lower lines. It helps identify mean reversion or trend continuation points. For instance, in a ranging market, price near the middle line may suggest equilibrium or signal preparation for the next price movement.
Quick Overview
- Upper Line: Represents the highest price in N periods and acts as dynamic resistance.
- Lower Line: Represents the lowest price in N periods and acts as dynamic support.
- Middle Line: The average of the upper and lower lines, helping identify market equilibrium or trend direction.
Identifying Trading Opportunities with the Donchian Channel
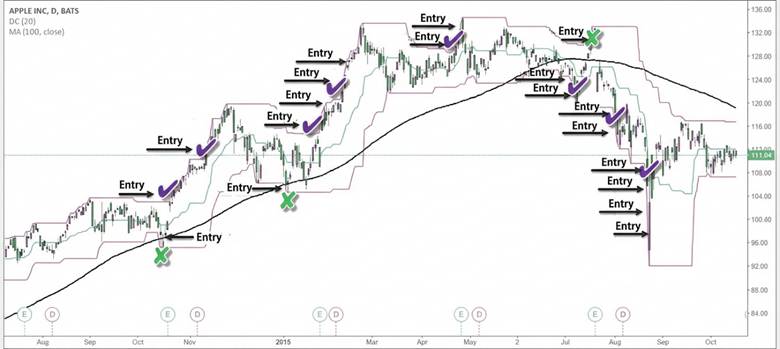
One of the main uses of the Donchian Channel indicator is helping traders spot potential trading opportunities. By showing the highest and lowest price within a set period, the tool makes it easier to define entry, exit, stop-loss levels, and price targets. In fast-moving markets like Forex or cryptocurrency, the Donchian Channel is especially useful for swing trading.
How to Identify Entry and Exit Points with the Donchian Channel
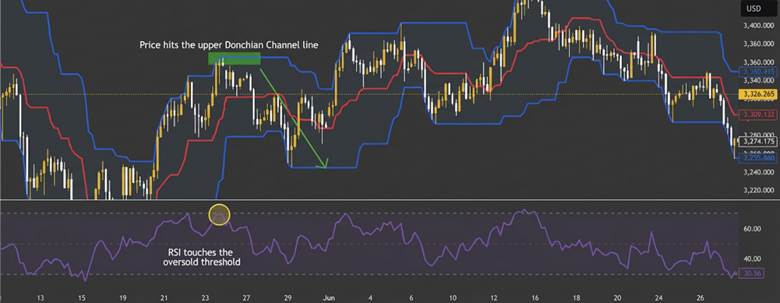
A buy signal occurs when the price reaches the highest level in the chosen period. This causes the upper band of the Donchian Channel to move upward. This indicates a strong upward trend and suggests the price will likely continue higher. Conversely, a sell signal is triggered when the price forms a new low, causing the lower band to move downward. This signals a possible downtrend.
For example, in a currency pair chart, if the price hits a new 20-day high, it suggests bullish momentum. If the price creates a new 20-day low, it indicates bearish pressure and a higher chance of a downtrend.
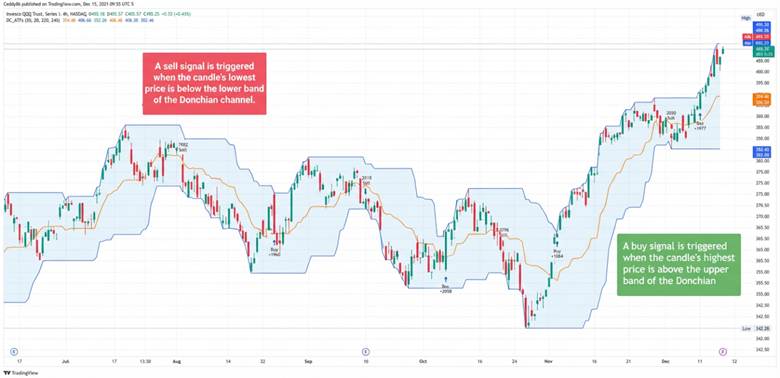
Example Source: Investopedia
Setting Stop-Loss and Take-Profit Levels with the Donchian Channel
For buy trades, the stop-loss is typically placed just below the lower band of the Donchian Channel. This helps protect against false price fluctuations. In sell trades, the stop-loss is placed above the upper band. Take-profit levels can be set at the opposite band or using a risk-to-reward ratio (e.g., 1:2).
How to Filter Out False Signals When Using the Donchian Channel
To reduce errors, use multiple timeframes and complementary indicators like volume or the RSI (Relative Strength Index). This improves the reliability of the Donchian Channel signals and reduces false entries.

According to TradingView: To ensure the reliability of a breakout signal, look for secondary confirmation through internal price highs or lows (minor retracements) before entering. This secondary confirmation increases the validity of the signal.
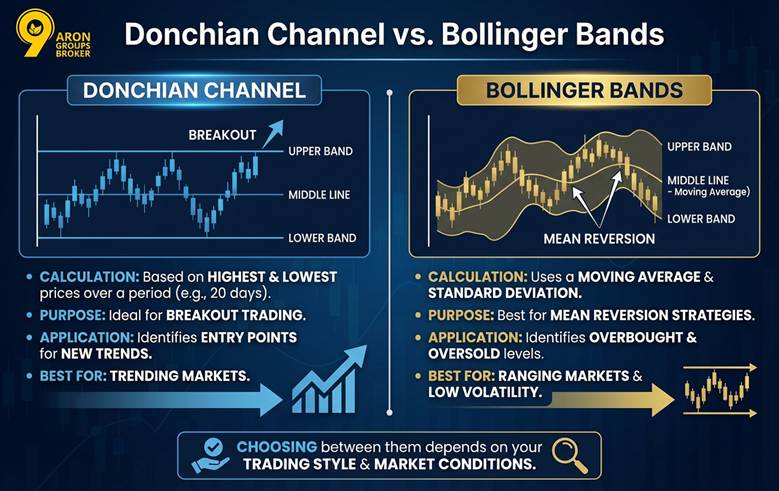
Donchian Channel vs Bollinger Bands
The Donchian Channel and Bollinger Bands are both trend-following indicators used to identify market trends and volatility. However, they differ in calculation and use.
The Donchian Channel is calculated by using the highest and lowest prices over a set period, typically 20 days. It works well with the Donchian Channel breakout strategy, highlighting entry points for new trends.
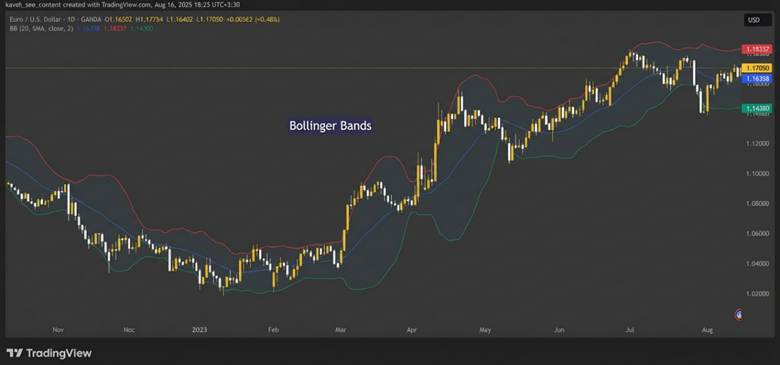
In contrast, Bollinger Bands use a moving average and standard deviation. They are ideal for mean reversion strategies, especially in range-bound markets. The Donchian Channel indicator excels in trending markets, while Bollinger Bands perform better in low-volatility conditions and identify overbought or oversold levels.
The choice between the Donchian Channel strategy and Bollinger Bands depends on trading style and market conditions. For trending markets, use the Donchian Channel MT4 or Donchian Channel TradingView. Bollinger Bands are more effective for sideways markets.
Donchian Channel vs Keltner Channel
At first glance, the Donchian Channel and Keltner Channel may seem similar, but they differ in their calculations.
The Donchian Channel only shows the highest and lowest prices over a specified period. It is ideal for identifying breakouts and large market moves, making it a perfect tool for Donchian Channel breakout strategies.
In contrast, the Keltner Channel uses a moving average and the ATR (Average True Range) indicator, creating smoother and more flexible lines. This makes it a better choice in calmer, lower-volatility markets.
Traders typically use the Donchian Channel indicator in strong, trending markets, while the Keltner Channel is more suitable for quieter conditions with less volatility.
Choosing between the Donchian Channel strategy and the Keltner Channel depends on market conditions and your trading style.
In flat trend market conditions, the Keltner Channel, based on ATR volatility, performs better in filtering noise and reducing false signals compared to the Donchian Channel.
Donchian Channel Trading Strategies
For many traders, the Donchian Channel indicator provides a simple yet powerful way to identify market direction and long-term trends. Using this tool, traders can implement three main strategies more effectively: breakout strategy, trend-following strategy, and mean reversion strategy.
Breakout Strategy
In this strategy, the trader enters the market when the price creates a new high or low compared to the recent period:
- A new high (i.e., close at the upper band) signals a buy.
- A new low (i.e., close at the lower band) signals a sell.
To reduce false signals, it’s recommended to wait for confirmation with one or two consecutive candlesticks closing at the same level. This strategy works well when the market begins a strong move, and the trader aims to capture a new trend using the Donchian Channel breakout.
Trend-Following Strategy
In this approach, the trader focuses on staying with the dominant market trend. When the price makes a new high or low, instead of exiting, the trader remains in the direction of the trend to maximize gains:
- If the price moves near the upper band and continues to make new highs, it indicates a strong uptrend. The trader can stay in the buy position.
- If the price fluctuates near the lower band and makes new lows, a continuation of the downtrend is more likely, and holding or adding to the sell position is reasonable.
This strategy helps the trader capitalize on long-term, powerful market moves rather than short-term trades, using the Donchian Channel indicator.
Mean Reversion Strategy
To implement the mean reversion strategy with the Donchian Channel, the trader buys when the price is near the lower band and sells near the upper band. This method relies on the price returning to the mean and works well in range-bound market conditions.
Breakout traders can reduce risk by confirming the breakout direction with the long-term moving average direction (e.g., EMA 200). This method aligns better with the long-term trend.
Combining the Donchian Channel with MACD and RSI
To enhance the accuracy of the Donchian Channel indicator, combining it with MACD indicator and RSI is a smart approach. RSI helps identify overbought or oversold conditions. For example, when the price breaks out of the Donchian Channel and RSI is in the extreme zones (above 70 or below 30), the likelihood of a price reversal increases.
On the other hand, MACD serves as a trend confirmation tool. If the price moves above the upper band of the Donchian Channel and MACD is bullish (e.g., positive histogram or above zero), the upward movement is more likely to continue.
This combination of tools helps reduce false signals and aids traders in making more precise decisions. By integrating the Donchian Channel strategy with MACD and RSI, traders can improve their market analysis and decision-making process.
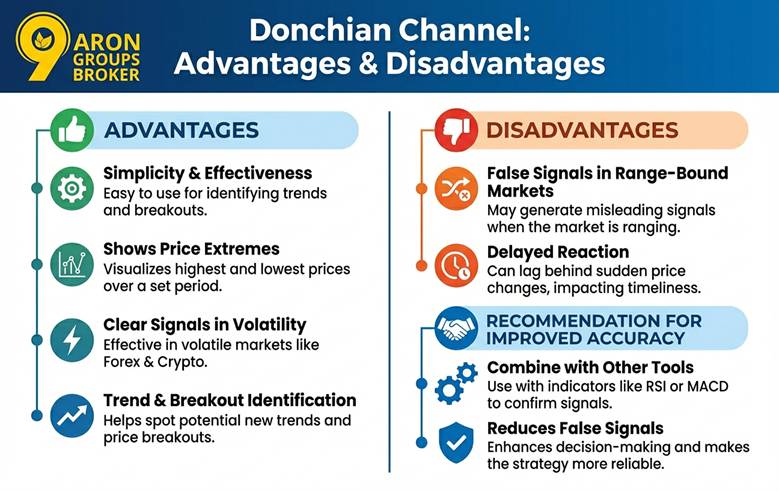
Advantages and Disadvantages of Using the Donchian Channel
The Donchian Channel is a popular tool in technical analysis because of its simplicity and effectiveness in identifying trends and breakouts. It shows the highest and lowest prices over a set period, helping traders receive clear signals in volatile markets like Forex and cryptocurrency.
However, in range-bound markets, the Donchian Channel may generate false signals due to its delayed reaction to price changes. To improve accuracy, combining the Donchian Channel indicator with tools like RSI or MACD is recommended. This reduces false signals and enhances decision-making, making the Donchian Channel strategy more reliable.
Installing and Setting Up the Donchian Channel in MetaTrader and TradingView
To install the Donchian Channel indicator in MetaTrader 4 or 5:
- download the indicator file (e.g., donchian_channel.mq4/mq5) from a trusted source.
- Open MetaTrader, go to the File menu, and select Open Data Folder.
- Copy the file to the MQL4/5 > Indicators folder and restart the software.
- Then, go to the Insert > Indicators > Custom menu to add the Donchian Channel to the chart.
In TradingView:
- Search for “Donchian Channel” in the Indicators section and apply it to your chart.
Recommended settings include a 20-period for medium-term trends and enabling price display for clearer visibility. These settings work well for both Forex and cryptocurrency trading.
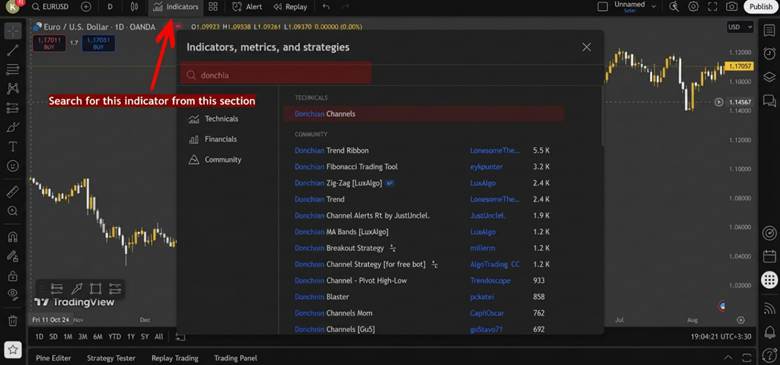
By following these simple steps, you can set up the Donchian Channel TradingView and Donchian Channel MT4 indicators efficiently for your trading needs.
Conclusion
What truly defines the value of the Donchian Channel is its role as a bridge between simplicity and precision in analysis. This tool can show traders when the market is ready for a new move. However, success comes when these signals are combined with a deeper understanding of price behavior and other indicators.
Using the Donchian Channel indicator offers an opportunity for continuous learning and skill development. It’s not just a technical tool, but also a method for organizing decision-making, providing clarity for traders in dynamic markets.


