The Double Exponential Moving Average (DEMA) is a technical indicator that reduces lag and gives faster signals than traditional moving averages. This indicator is particularly useful for short-term traders, especially scalpers, and those seeking to identify trend reversals more quickly.
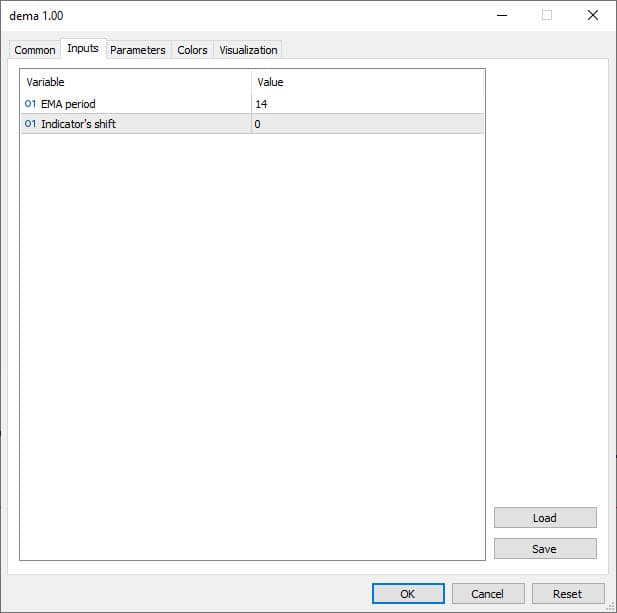
- Selecting a shorter period (such as 9) increases the speed and sensitivity of the Double Exponential Moving Average (DEMA) indicator, while longer periods (such as 50 or 100) produce less noise, but the signals appear more slowly.
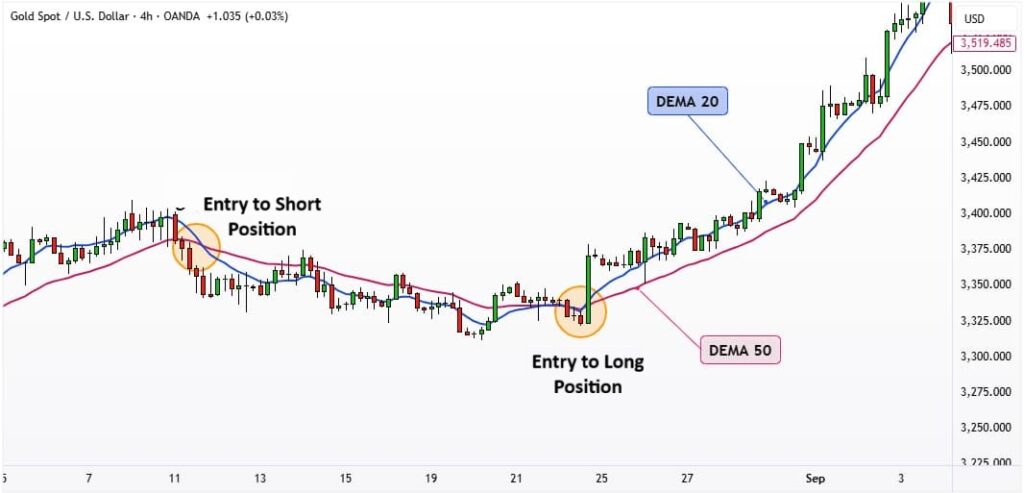
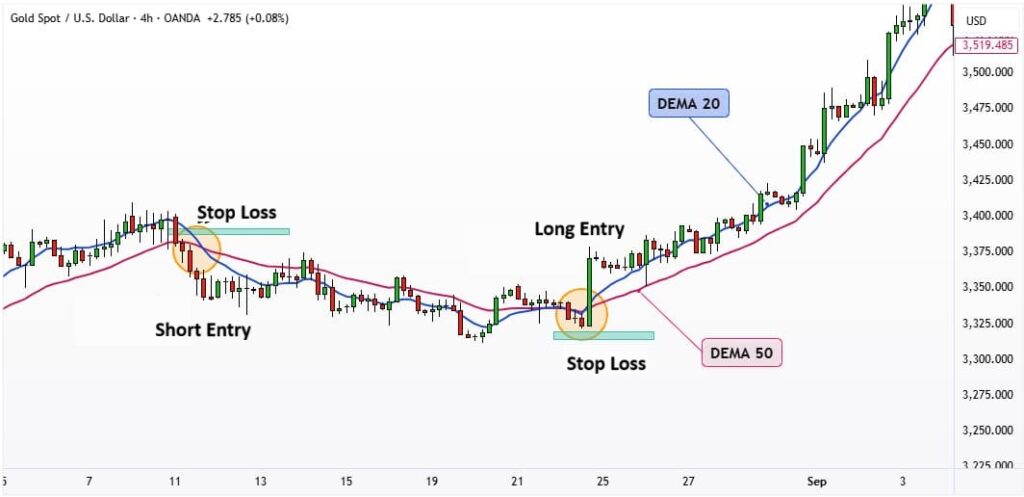
- Professional traders often use the DEMA indicator on smaller timeframes for entry signals and on larger timeframes to confirm trends.
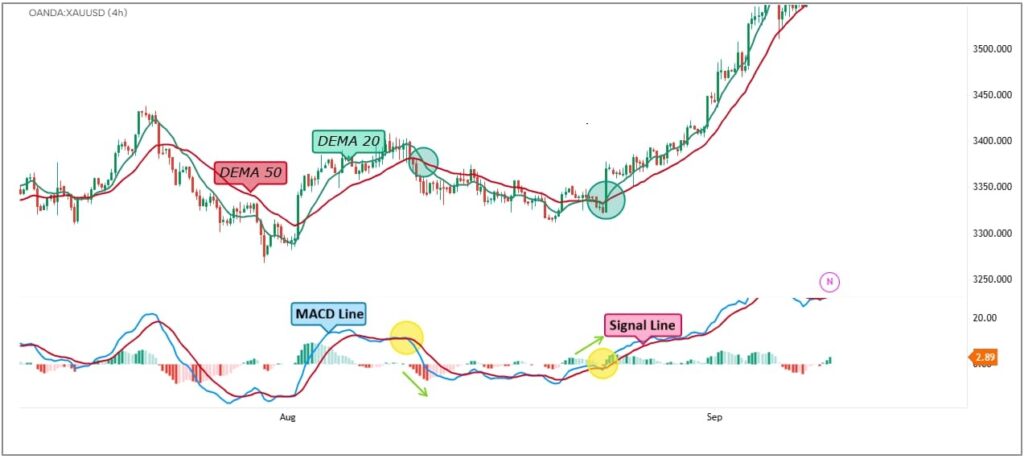
- Using the DEMA indicator alongside a volume indicator can provide more reliable signals, as trend changes accompanied by higher volume generally have greater strength.
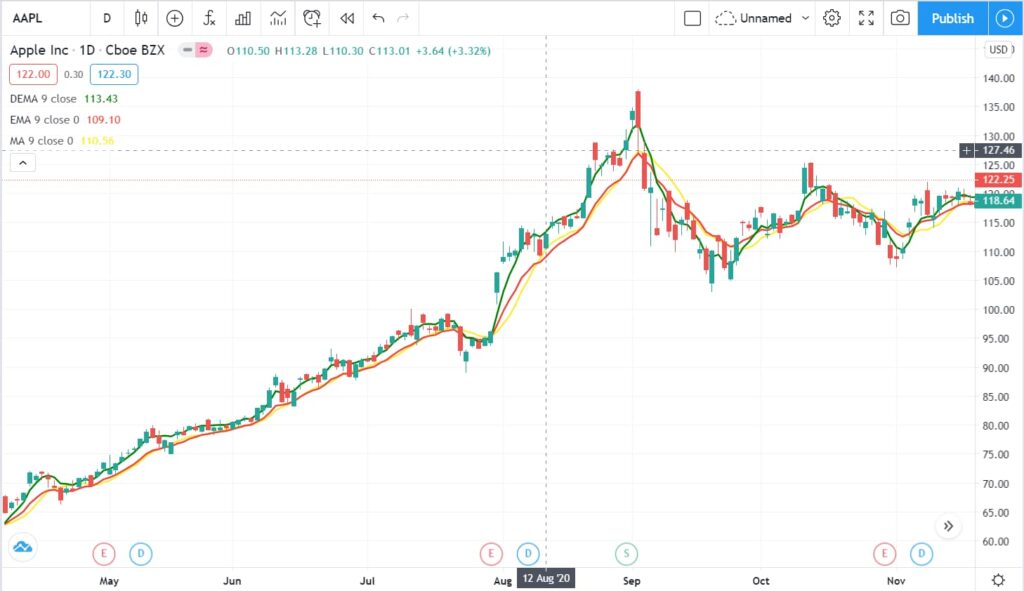
- The DEMA indicator is not limited to Forex or stocks; it also performs well in other markets such as cryptocurrencies, commodities (like gold and oil), and even indices.
What is the Double Exponential Moving Average (DEMA) Indicator?
The Double Exponential Moving Average (DEMA) is a technical indicator designed to address the lag problem inherent in traditional moving averages. Unlike the standard Exponential Moving Average (EMA), which reflects price changes with some delay, the DEMA indicator uses a combination of a simplified EMA and a recalculated EMA. This combination allows the resulting line to remain smooth while moving much closer to the price candles, providing a quicker response to market changes.
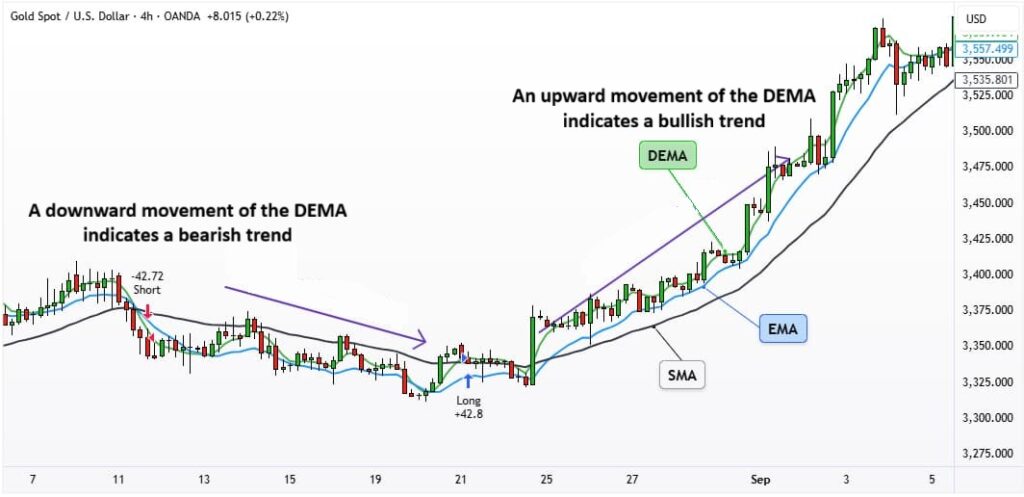
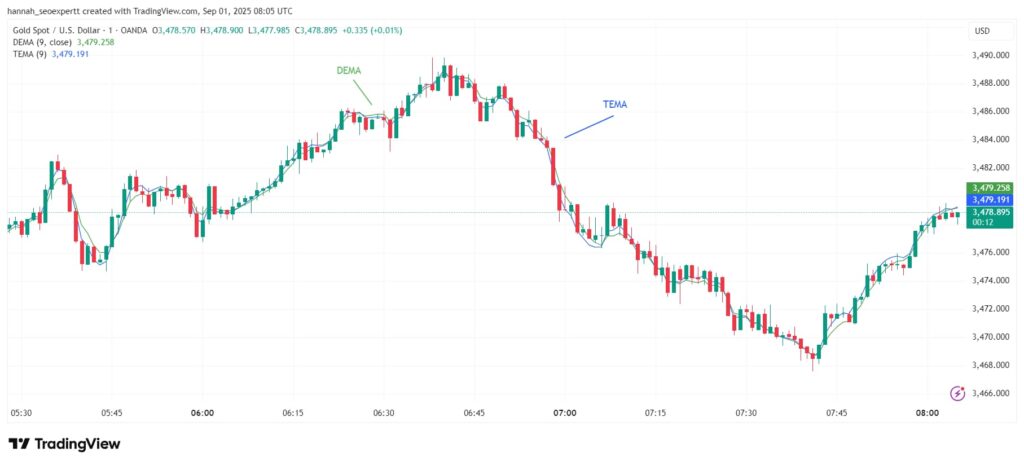
Wondering how DEMA compares to the traditional EMA? DEMA reacts faster, which means you can spot market trends quicker!
The Double Exponential Moving Average (DEMA) indicator was first introduced in January 1994 by Patrick Mulvey in the Technical Analysis of Stocks & Commodities magazine. It quickly became one of the most popular tools for analysing short-term trends.
In simple terms, the DEMA can be seen as a faster and more optimised version of the Exponential Moving Average (EMA), with the primary goal of reducing the gap between the actual price and the moving average line.
Formula for Calculating the Double Exponential Moving Average (DEMA) and How It Works
According to Investopedia, the Double Exponential Moving Average formula is as follows:
DEMA = (2 × EMA1) – EMA2
- EMA1: Single-Smoothed Exponential Moving Average of the price.
- EMA2: Exponential Moving Average of EMA1, also known as Double-Smoothed EMA.
In this method, EMA1 is first calculated using price data. Then, a second EMA is derived from EMA1, which is referred to as EMA2. Finally, using the formula above, a line is obtained that has less lag compared to the standard EMA and moves much closer to the actual price movement.
In low-liquidity or thin markets, the DEMA indicator sometimes exhibits reverse behaviour and generates misleading signals.
Example:
Let’s assume the closing prices of a stock over the past few days are as follows:
- Day 1 = 10,
- Day 2 = 12,
- Day 3 = 11,
- Day 4 = 13,
- Day 5 = 15.
Step 1: Calculating EMA1 (Initial Exponential Moving Average)
To keep the example simple and easy to understand, instead of performing all the complex EMA calculations with precise weighted formulas, we assume that the final EMA result for Day 5 (using a 3-day period) is 12.5.
Step 2: Calculating EMA2 (Exponential Moving Average of EMA1)
Now, we apply another EMA on the EMA1 values. We assume the EMA2 value on Day 5 is 12.
Step 3: Calculating DEMA
Using the formula above, the final value will be:
DEMA = (2 × 12.5) – 12 = 13
- Actual price on Day 5: 15
- EMA1: The value of 12.5 shows that it is still slightly behind the actual price.
- DEMA: The value of 13 indicates that it is much closer to 15 and has reacted more quickly than the EMA.
The Application of the Double Exponential Moving Average (DEMA) Indicator in Technical Analysis
The DEMA indicator is one of the most widely used tools in technical analysis, helping traders identify market changes more quickly and accurately. Its key applications include:
- Identifying Uptrends and Downtrends
Since DEMA reacts faster than other moving averages, it signals price direction changes earlier.
1. When the DEMA line moves upward, it typically indicates the start of an uptrend.
2. Whereas a downward movement can signal the beginning of a downtrend.
- Generating Buy and Sell Signals Based on Crossovers
One of the most commonly used methods is observing the crossover points. For instance:
1. If the short-term DEMA crosses above the long-term DEMA, a buy signal is generated.
2. Conversely, a downward crossover can be a signal to sell.
Q: How can you use DEMA to spot trend changes early?
A: Watch for sharp moves in the DEMA line. If it starts to point upwards or downwards, it could indicate a shift in market direction.
- The Role of Dynamic Support and Resistance
The DEMA line often acts like a dynamic support or resistance level, moving along with the price. For this reason, traders use it to identify potential reversal points or to confirm the continuation of a trend. - Combining with Other Indicators to Reduce False Signals
On its own, DEMA may generate false signals, especially in highly volatile markets. For this reason, it is often used in conjunction with indicators such as the MACD or RSI to filter and enhance the reliability of the signals. For instance:
If a bullish crossover of the DEMA occurs simultaneously with the RSI exiting the oversold region, the likelihood of a successful trade increases.
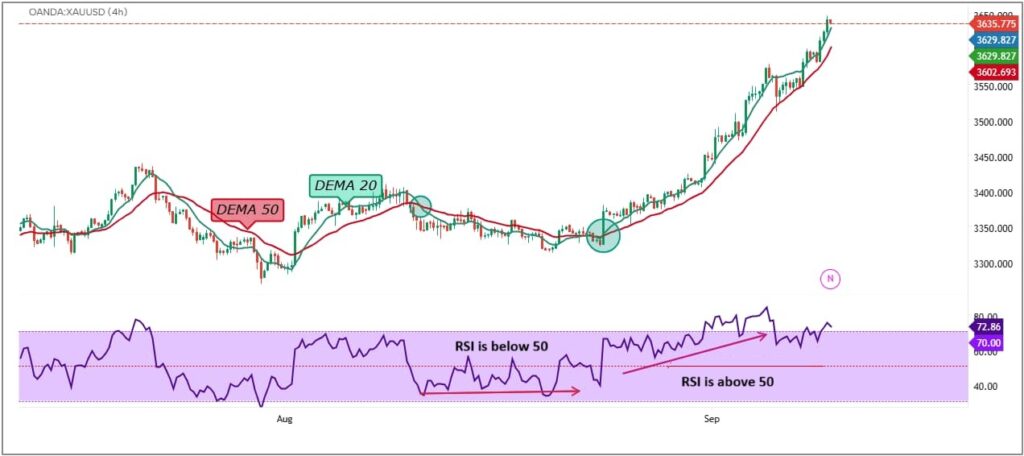
Looking for stronger confirmation? Combine DEMA with RSI for a more robust signal!
Difference Between the Double Exponential Moving Average (DEMA) and Simple Moving Average (SMA)
The Simple Moving Average (SMA) treats all past data points equally when calculating the average, which results in a slower reaction to price changes. As a result, it often lags behind in showing market trends.
In contrast, the Double Exponential Moving Average (DEMA) is constructed by combining multiple stages of the Exponential Moving Average (EMA), allowing it to have less lag compared to the SMA.
In the chart above (XAU/USD – 1M timeframe):
- Blue line = SMA (9)
- Green line = DEMA (9)
You can observe that the green line (DEMA) consistently moves ahead of the blue line (SMA) and reacts more swiftly.
The Difference Between the Double Exponential Moving Average (DEMA) and the Exponential Moving Average (EMA)
The Exponential Moving Average (EMA) gives more weight to recent prices and reacts more quickly than the Simple Moving Average (SMA).
However, it still has a delay and sometimes signals market changes later than they actually occur.
In contrast, the Double Exponential Moving Average (DEMA) combines multiple stages of the Exponential Moving Average (EMA). This allows DEMA to have less lag compared to the Simple Moving Average (SMA).
The Difference Between the Double Exponential Moving Average (DEMA) and the Triple Exponential Moving Average (TEMA)
Both the DEMA and TEMA indicators are designed to reduce the lag in moving averages, but their calculation methods and reaction speeds differ:
- Double Exponential Moving Average (DEMA)
- Constructed by combining an initial EMA with a recalculated EMA.
- Primarily used for short-term trading and identifying trend changes early.
- Constructed by combining an initial EMA with a recalculated EMA.
- Triple Exponential Moving Average (TEMA)
- A combination of three EMAs (an initial EMA, a recalculated EMA, and a triple-re-calculated EMA).
- Offers less delay compared to DEMA and is more competitive in terms of price.
- However, due to its faster reaction, it may generate more noise in volatile markets.
- A combination of three EMAs (an initial EMA, a recalculated EMA, and a triple-re-calculated EMA).
Q: Which indicator is better for fast market conditions: DEMA or TEMA?
A: If you need a quicker response and can tolerate more noise, TEMA might be a better option. However, for less volatile market conditions, DEMA works well.
As Seen in the Example:
- In an uptrend (around 06:20 to 06:40), the blue line (TEMA) moved upward faster than the green line (DEMA) and confirmed the uptrend sooner.
- In a Downtrend (from around 07:00 onwards), TEMA again started declining earlier than DEMA and moved closer to the price candles.
Using the DEMA Indicator on Renko Charts yields more accurate trend-following results compared to classic candlestick charts.
Comparison table between SMA, EMA, DEMA, and TEMA
| Indicator | Calculation Method | Response Speed | Lag | Usage | Best For | Key Advantage | Key Limitation |
|---|---|---|---|---|---|---|---|
| Simple Moving Average (SMA) | Average of a set number of past data points, treating all points equally | Slow | High lag | Long-term trend analysis, smoothing out noise | Long-term trend analysis and simple calculations | Simplicity, easy to calculate and understand | Lags behind market trends, slower response to price changes |
| Exponential Moving Average (EMA) | Gives more weight to recent prices, calculated using a weighted formula | Faster than SMA | Moderate lag | Trend-following strategies, reacting to recent price changes | Short-term trend-following strategies, fast-moving markets | Faster than SMA, more sensitive to recent price action | Still has delay and can react after market change |
| Double Exponential Moving Average (DEMA) | Combines two EMAs to reduce lag and improve responsiveness to price changes | Faster than EMA | Reduced lag | Short-term trading, identifying early trend changes | Short-term trading, faster reaction to market changes | Less lag than EMA, quick response to trend changes | More noise in volatile markets compared to SMA |
| Triple Exponential Moving Average (TEMA) | Combines three EMAs (initial, recalculated, and triple-re-calculated EMA) | Very fast | Least lag | Very short-term trading, quick trend identification | Very fast market conditions, reacting to sudden price moves | Quickest response, minimal lag, best for fast market conditions | Can generate more noise in volatile markets |
How to Trade with the Double Exponential Moving Average (DEMA) Indicator
The DEMA indicator is a fast and efficient tool for identifying trends, as well as entry and exit points. Below, we explain how to trade using the Double Exponential Moving Average (DEMA) indicator.
How to Determine Entry and Exit Points Using the DEMA Indicator
To trade with the Double Exponential Moving Average (DEMA), you must first apply two lines with different periods on the chart. Typically, a short-term DEMA, such as a 20-period DEMA, and a long-term DEMA, such as a 50 or 100-period DEMA, are used.
- Entry Point for a Buy: A buy signal is generated when the short-term DEMA crosses above the long-term DEMA, and the price stabilises above both lines.
- Entry Point for a Sell: A sell signal is triggered when the short-term DEMA crosses below the long-term DEMA, and the price falls below both lines.
- Exit from the Trade: To exit the trade, the reverse crossover can be used. In a buy trade, when the short-term line crosses below the long-term line, it’s time to close the position. In a sell trade, a bullish crossover serves as an exit signal.
How to Set Stop-Loss Using the DEMA Indicator
Setting a stop-loss is crucial when using the DEMA indicator, as it helps manage risk and protect profits.
- For buy trades, the stop-loss is usually placed just below the most recent price low or below the long-term DEMA line. This ensures that larger losses are avoided if the price moves against the trade.
- For Sell Trades: Similarly, the stop-loss is set above the most recent price high or above the long-term DEMA line to minimise losses if the price rises unexpectedly.
Due to the likelihood of false signals in ranging markets, the use of a dynamic stop-loss and proper risk management is essential.
Additionally, combining the Double Exponential Moving Average (DEMA) indicator with other indicators, such as the RSI or MACD, can enhance the reliability of signals and provide traders with more confident entry and exit points.
Disadvantages and Limitations of the Double Exponential Moving Average (DEMA) Indicator
Despite its numerous advantages, the DEMA indicator has limitations that traders must consider before using it:
- Excessive Sensitivity to Short-Term Fluctuations
Due to its quick response to price changes, the DEMA indicator can generate many false signals in highly volatile markets. - Unsuitability for Long-Term Timeframes
On longer timeframes, the DEMA reacts too quickly, which may cause traders to misinterpret small market changes as a trend reversal. - Requires Combination with Other Indicators
Using the DEMA indicator alone is not sufficient. To reduce errors, it should be used in conjunction with other tools such as the MACD or RSI. - Computational Complexity Compared to SMA and EMA
Unlike the Simple Moving Average (SMA) or even the Exponential Moving Average (EMA), the DEMA’s calculations are more complex, and understanding its formula can be challenging for beginners. - Risk of Early Exit from the Trend
Because the DEMA indicator changes direction quickly, it can sometimes signal a reversal before the main trend has ended, leading to premature exits by traders.
In the cryptocurrency market, particularly with assets exhibiting high volatility, the DEMA indicator, due to its fast reaction time, can be useful for detecting stop hunting and market manipulation by market makers.
Combining the Double Exponential Moving Average (DEMA) Indicator with the MACD
Combining the Double Exponential Moving Average (DEMA) with the MACD indicator is a powerful method for identifying more precise entry and exit points in the market. These two tools complement each other. The combination of DEMA and MACD typically works as follows:
- Use DEMA (e.g., 20 and 50) to identify crossovers and trend direction, while using MACD as a confirmation filter.
- When the short-term DEMA crosses above the long-term DEMA, it signals a potential buy, and this signal becomes stronger if the MACD histogram is positive or the MACD line is above the signal line (for a sell signal, the opposite applies).
- The MACD can help refine exit timing. A decline in the histogram or the MACD line crossing the signal line indicates a weakening trend.
According to Trendspider, although the DEMA indicator generates entry and exit signals quickly, it is recommended to combine it with other indicators for making final entry and exit decisions.
Combining the Double Exponential Moving Average (DEMA) Indicator with the RSI
The combination of the Double Exponential Moving Average (DEMA) with the Relative Strength Index (RSI) is a popular approach in technical analysis, enabling traders to more effectively identify both the direction and strength of a trend. In fact, the integration of the DEMA and RSI indicators provides a powerful tool for filtering out false signals. Here’s how it works:
- When the short-term DEMA (e.g., 20) is above the long-term DEMA (e.g., 50) and the RSI is above 50, the buy signal is strengthened.
- Conversely, when the short-term DEMA (e.g., 20) is below the long-term DEMA (e.g., 50) and the RSI is below 50, it confirms the sell signal.
- A quicker entry is signalled by a crossover confirmed by the RSI, and exits are typically made using a reverse crossover or a shift in the RSI direction.
- If the RSI enters the overbought zone (greater than 70) or the oversold zone (less than 30), traders should anticipate a potential correction or reversal.
How to Activate and Set Up the Double Exponential Moving Average (DEMA) Indicator in MetaTrader and TradingView
To use the DEMA indicator effectively, it’s important to first understand how to activate it on different platforms and then configure its key settings. Below are the steps for activating and setting up DEMA in both MetaTrader and TradingView.
Activating the Double Exponential Moving Average (DEMA) Indicator in TradingView
- Click on the Indicators section at the top of the chart page in TradingView.
- Enter “DEMA” or “Double EMA” in the search box.
- Select the indicator to add it to the chart.
Once added, you can open the settings by double-clicking on its name.
- Length (Period Length): The default is set to 9, but you can adjust it to 20, 50, or any other number based on your strategy.
- Source: The data type (Close, Open, High, Low). It is usually set to Close.
- Style: Line colour and thickness.
Activating the Double Exponential Moving Average (DEMA) Indicator in MetaTrader (MT4/MT5)
The DEMA indicator is not available by default in MetaTrader and must be downloaded and installed manually.
- Download the DEMA indicator file with the extension .ex4 or .mq4 (for MT4) or .ex5 (for MT5).
- Open MetaTrader and select File → Open Data Folder from the top menu.
- Navigate to the MQL4 or MQL5 folder, then proceed to the Indicators folder.
- Copy the DEMA indicator file into this folder.
- Close and reopen MetaTrader.
- In the Navigator panel, go to Indicators → Custom Indicators, then double-click on DEMA to add it to the chart.
In the settings section, under the “Input” tab, you will find the DEMA indicator inputs, which can be adjusted based on your strategy:
- EMA period: This refers to the time frame used to calculate the Exponential Moving Average (EMA) indicator.
- Indicator shift: This shifts the indicator forward or backward by a certain number of periods (n), with the default setting being zero.
Conclusion
The Double Exponential Moving Average (DEMA) indicator is a powerful tool for short-term traders seeking quick and precise signals. Compared to the Simple Moving Average (SMA) and the Exponential Moving Average (EMA), DEMA reacts more swiftly to price changes, making it an effective complement when used alongside indicators like MACD and RSI to create more robust trading strategies. However, due to its high sensitivity to market fluctuations, it is advisable to always use DEMA in conjunction with other technical analysis tools.