


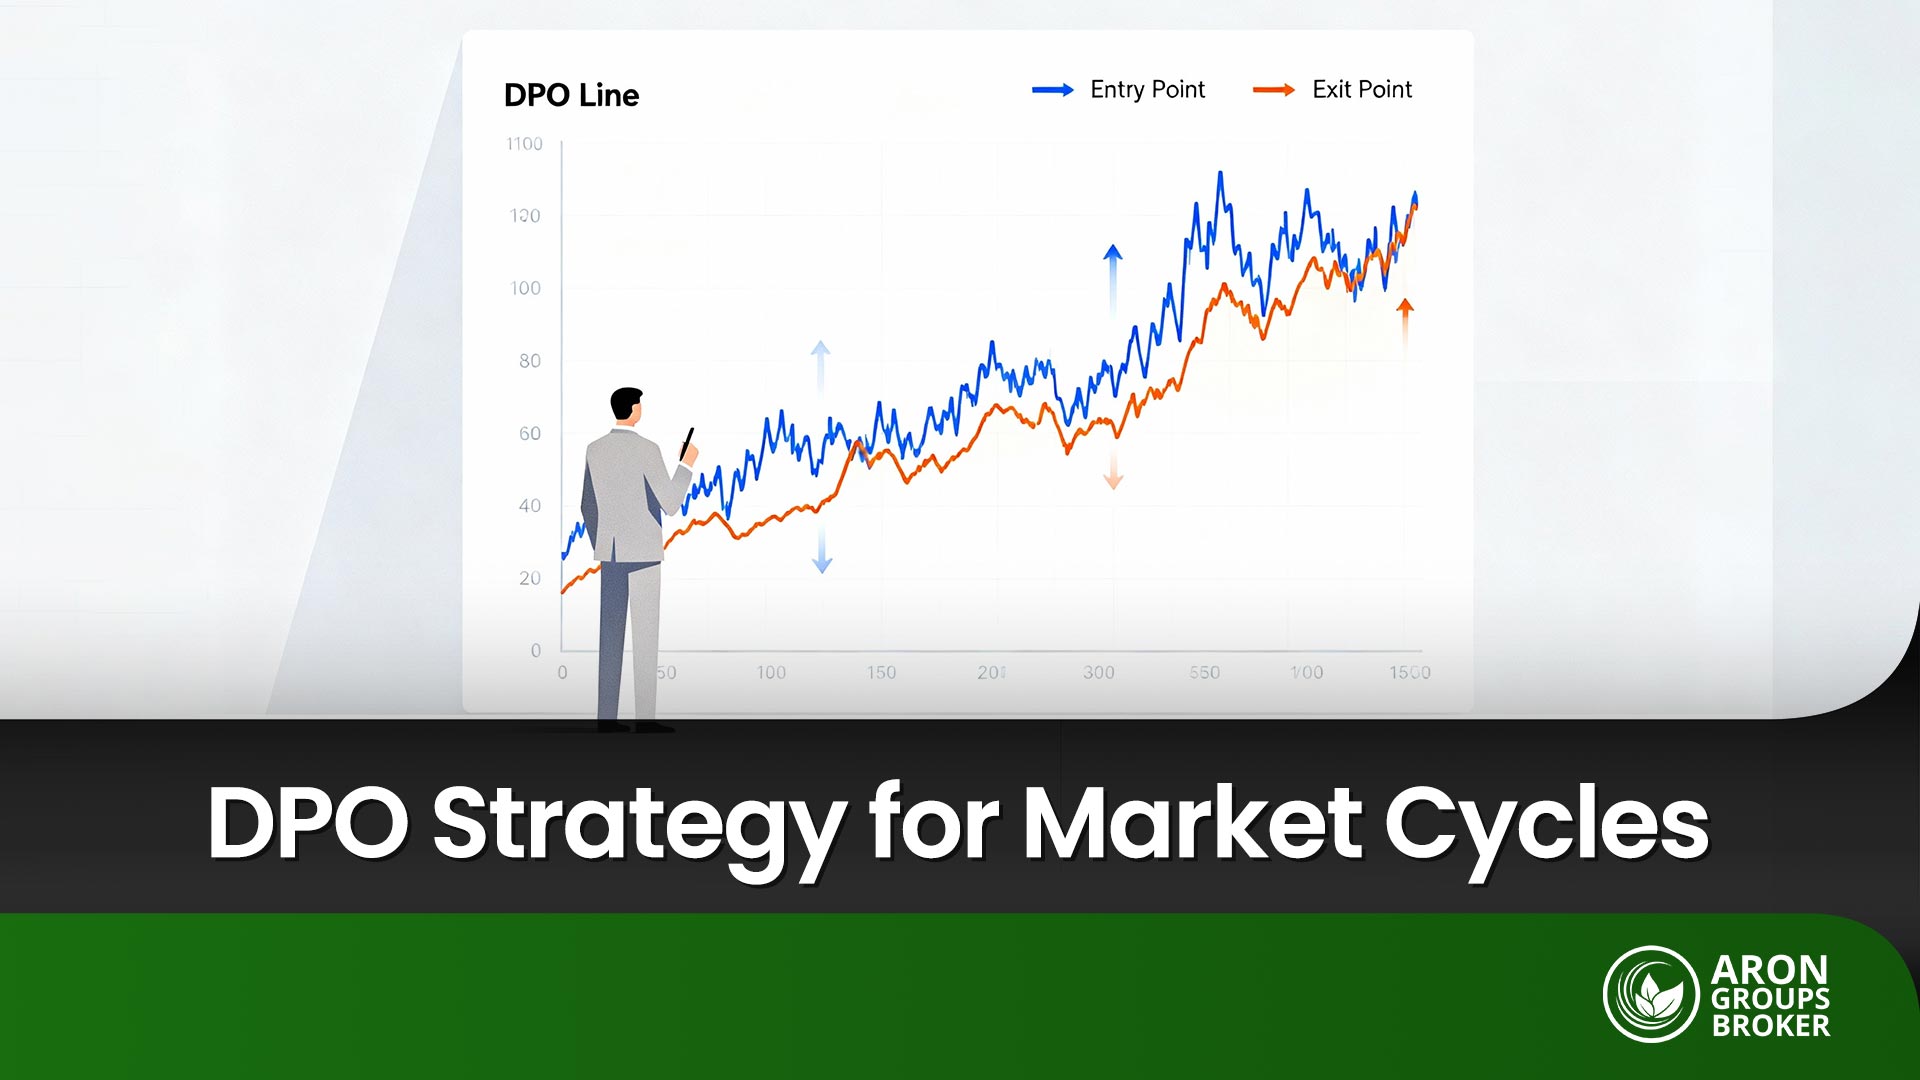


For many traders, short-term market swings create opportunities for quick profits, but spotting them requires tools that filter long-term trends. One specialised tool is the DPO, or Detrended Price Oscillator (DPO).
It is designed to remove the broader trend effect, helping you identify swing highs and swing lows more accurately.

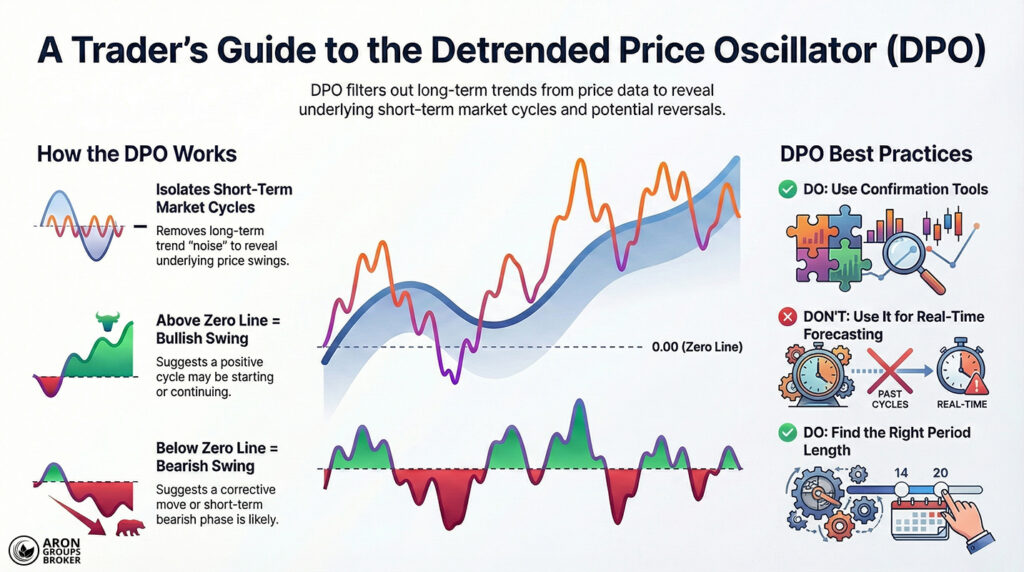
- The DPO indicator aims to reveal the overall and hidden cycles inside price movements.
- When DPO stays above the zero line, some traders treat it as bullish and may open a long position.
- When DPO drops below the zero line, it is often read as bearish, and some traders may open a short position.
What is the DPO indicator?
According to BabyPips, the DPO indicator is a technical analysis tool that removes the impact of the overall price trend from the chart. This helps analysts identify short-term price cycles more clearly, without long-term movement masking the pattern.
Unlike many oscillators, DPO does not focus on momentum or trend direction, but on isolating swing structure.
In practice, DPO tries to strip “trend noise” from price data. That is why it is usually plotted shifted left on the chart, so peaks and troughs align with price turns. This feature can make repeating market time cycles easier to detect and compare across periods.
Put simply, DPO helps you see a sharper picture of short-term behaviour without long-term trends distorting your judgement.

Key Insight:
Because DPO does not rely on the latest price bars, it will not reach the far-right edge of the chart. That is not a flaw, because its job is not forecasting, but mapping past swing zones to guide future analysis.
How to calculate the DPO indicator
As explained in Chartschool, DPO is calculated using a simple but precise idea: remove the long-term trend to focus on short-term swings.
This calculation uses a Simple Moving Average (SMA) based on past closing prices, not the current close, which removes trend bias.
DPO = Close (n/2 + 1 periods ago) − SMA(n)
In this formula:
- n: the number of periods you choose for analysis (for example, 20 days).
- Close (n/2 + 1 periods ago): the closing price from (n/2 + 1) candles before the current candle.
- SMA(n): the n-period Simple Moving Average of prices.
Example
Assume you want to calculate DPO using a 20-day period:
- First, divide the period by two and add one: 20 / 2 + 1 = 11.
- Next, take the closing price from 11 days earlier, and assume it was $125.
- Then calculate the 20-day Simple Moving Average (SMA20), and assume it equals $120.
- Now the DPO value will be:
DPO = 125 − 120 = +5
A value of +5 means the price at that point was 5 units above its 20-day average in a bullish swing phase.
This insight is obtained without the influence of the market’s long-term trend, which is the core purpose of DPO.
Uses of the DPO indicator in swing analysis
Below, we review two important uses of DPO separately.
Identifying short-term trends with DPO
By removing long-term fluctuations, DPO allows a more precise view of local trends in shorter time windows. When DPO stays consistently positive or consistently negative, it can help identify short-term price direction and bias.
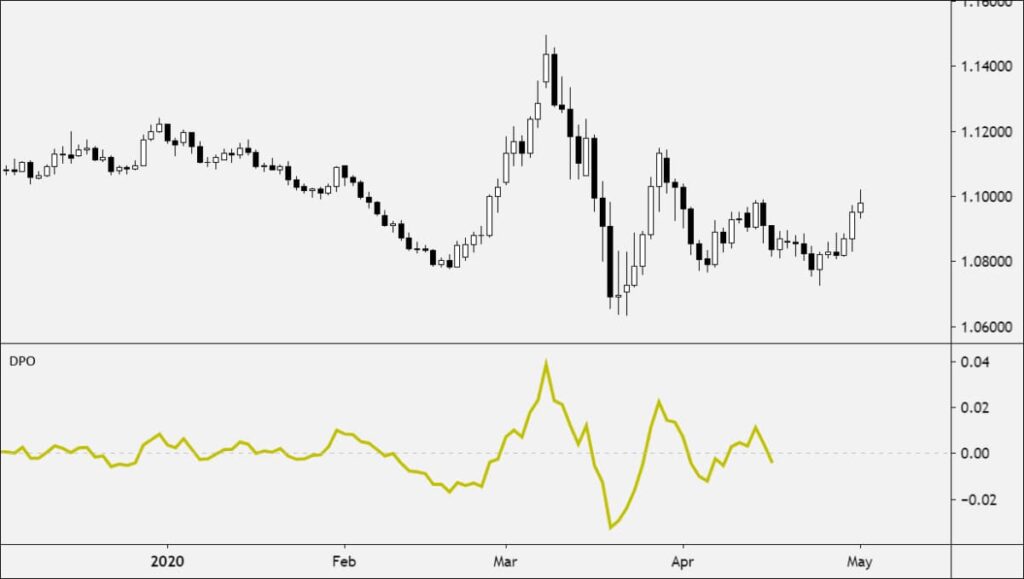
Example:
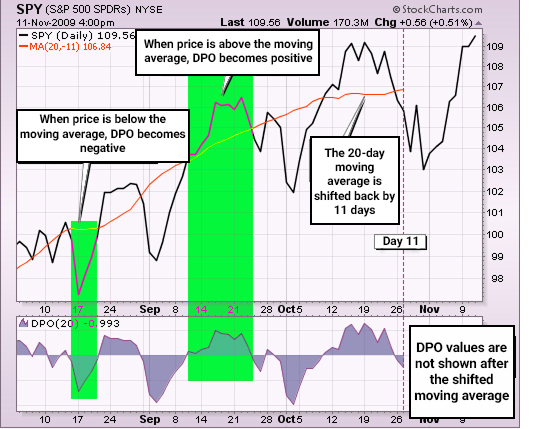
On an S&P 500 index ETF chart with DPO(20), the indicator’s troughs repeat roughly every 20 days from September to December.
This repeating pattern suggests the price is moving in cycles with an approximate 20-day cycle.
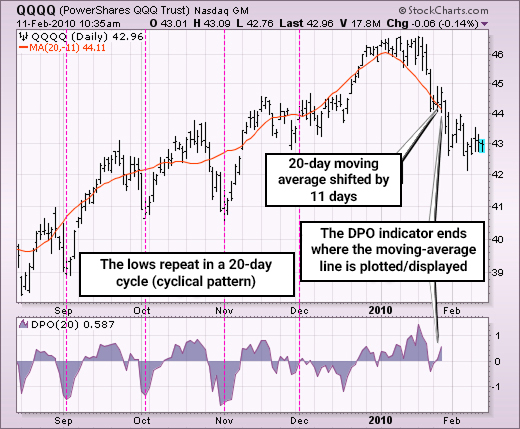
When DPO oscillates in the positive zone, it can signal a short-term bullish move. In contrast, staying in the negative zone often signals a short-term bearish phase within a limited range.
Spotting price reversal points
Another key use of DPO is identifying swing highs and swing lows, meaning short-term trend reversal points. When DPO reaches a clear peak or trough and then changes direction, it can warn that the current swing phase is ending.
Example:
In this chart, DPO moves into positive territory, then turns negative as the price drops below the central moving average. This shift suggests the start of a correction phase or a broader short-term bearish move.
How to interpret DPO indicator signals
Core rules for reading DPO signals:
- When DPO crosses above the zero line, the price is above the displaced moving average (Displaced SMA).
Interpretation: A bullish swing may continue, or a positive cycle may be starting.
- When DPO crosses below zero, the price is below the displaced moving average.
Interpretation: A short-term bearish phase or a corrective move becomes more likely.
- When DPO prints a new peak or trough and then turns back, it can mark the end of a cycle and the start of a new one.
Interpretation: This is stronger when you also see repeating patterns, which can support reversal signals.
Example
In Chart 2, which shows the S&P 500 index ETF, the relationship becomes clearer:
- When DPO is positive, the price sits above the displaced average (the pink line).
- When the price drops below that average, the DPO value turns negative as well.
This DPO phase change aligns with price tops and bottoms, not with small moment-to-moment moves.
The best software and platforms for using the DPO indicator
The DPO indicator is a widely used technical analysis tool, and it is available on many trading platforms and charting programs.
In this section, we review two popular platforms, MetaTrader and TradingView, which global traders widely use.
How to add and set up the DPO indicator in MetaTrader
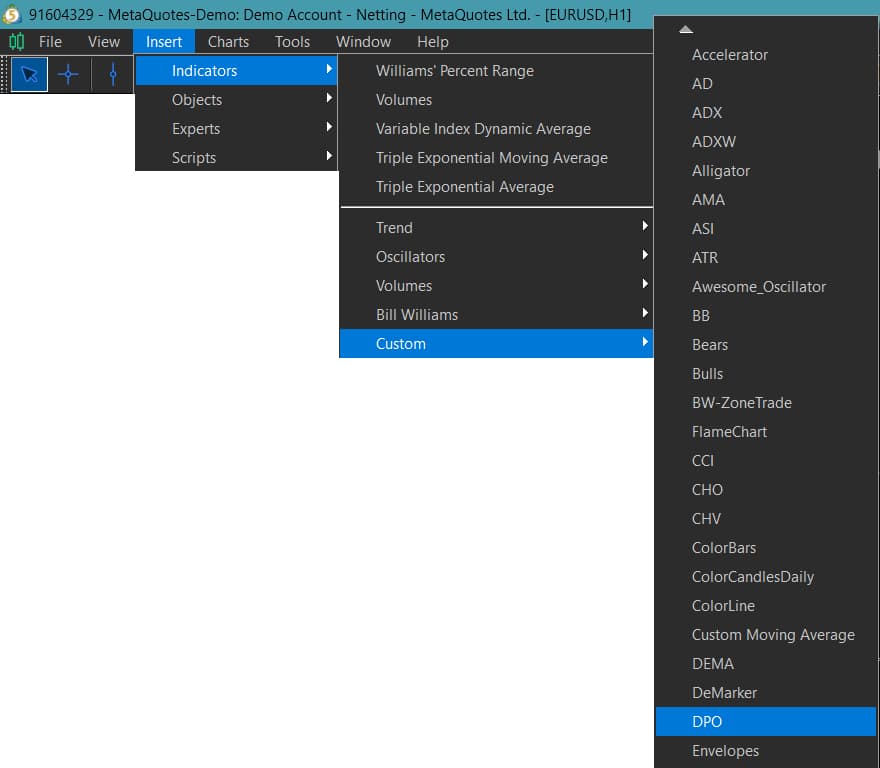
To add the DPO indicator in MetaTrader, follow these steps:
- From the top menu, go to Insert > Indicators > Custom.
- In the list that appears, select DPO.
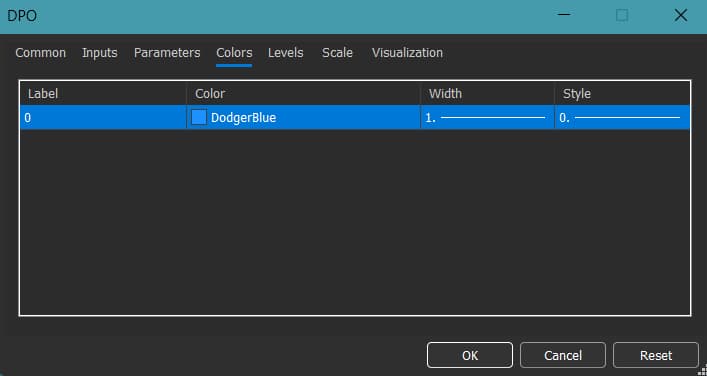
A settings window will open, where you can:
- Enter the time period (for example, 20).
- Adjust the line colour, line thickness, and display location (separate window or on the main chart).
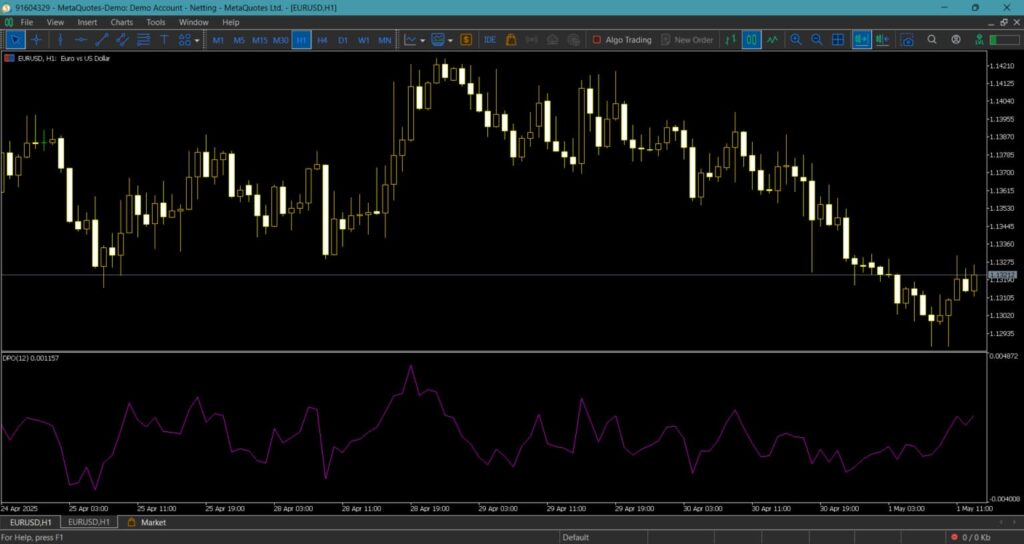
After you confirm, the indicator will appear below the price chart as DPO (the pink line).
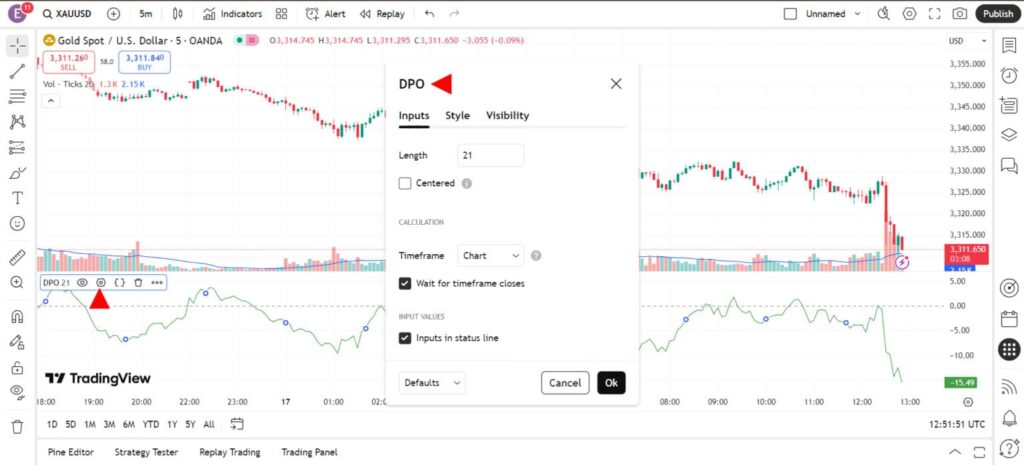
How to add and set up the DPO indicator in TradingView
TradingView is one of the best options for technical analysis due to its professional interface and advanced drawing tools. It also offers easy access to a wide library of indicators and charting features.
To add the DPO indicator:
- In the top toolbar, click Indicators.
- Search for “Detrended Price Oscillator”.
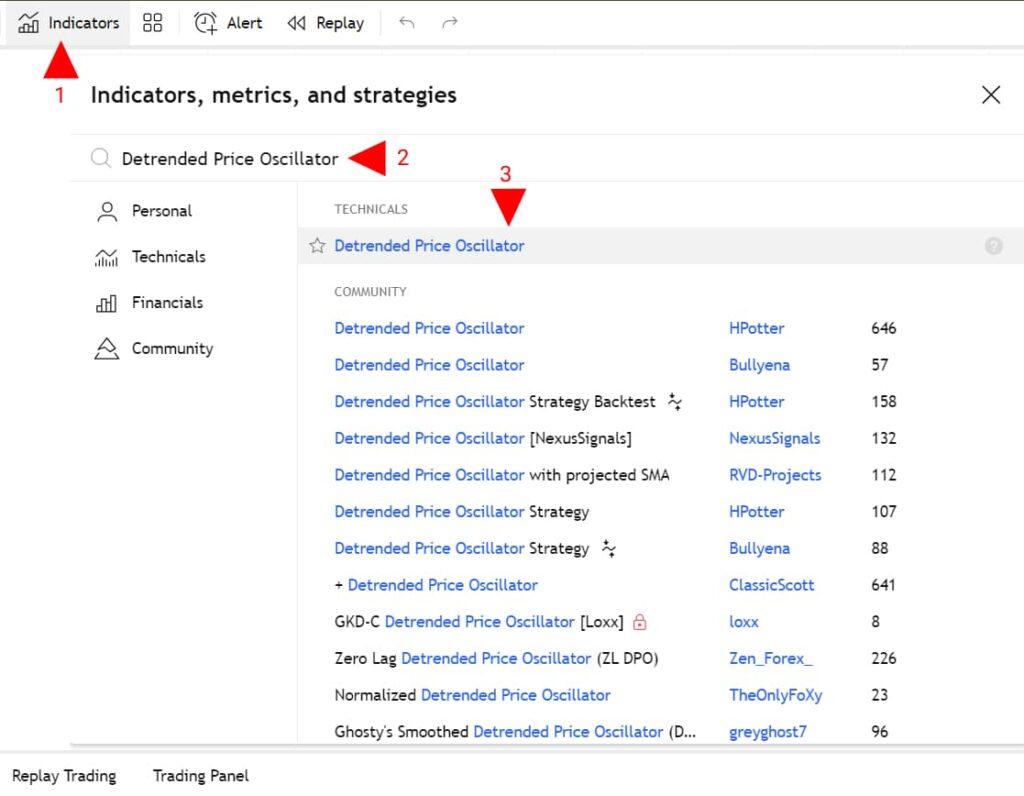
- Right-click the indicator name at the top of the chart.
- Select Settings, then set the Length value as you prefer (for example, 20).
- Change the line colour and style to match the other elements on your chart.
Common mistakes when using the DPO indicator
Although DPO is a simple tool for spotting short-term swings, many traders misread its structure and make avoidable mistakes. These mistakes can lead to poor trading decisions, especially when DPO is treated as a real-time signal.
Below are the most important errors traders often make when using the DPO indicator.
1) Using DPO for real-time market prediction
Some traders assume DPO, like momentum indicators such as MACD, can provide precise instant entry and exit signals. However, DPO is structurally based on past data and a displaced moving average, so it lags behind the current price.
Result:
Misusing it on fast timeframes or scalping setups can cause late entries or premature exits.
2) Ignoring the correct period setting
Choosing an unsuitable period length, such as 10 or 50, without considering the market type breaks alignment with real price cycles.
If the period is too small, DPO becomes overly noisy; if too large, reversals may not appear clearly.
Suggestion:
Before deciding, test several values such as DPO 14, 20, and 25 to find the best fit for your chart.
3) Shifting the indicator to the right to match the current price
Some users shift DPO to the right so it aligns with today’s price action. This defeats the indicator’s core goal: analysing past cycles to inform future expectations, not tracking the latest candle.
As reputable sources also note, this adjustment reduces accuracy in cycle detection and weakens the tool’s value.
4) Relying on DPO alone without combining confirmation tools
DPO is not a standalone indicator and should not be used in isolation. Without confirmation tools like moving averages, RSI, or trendlines, you may end up acting on false signals.
Example:
If DPO turns positive while RSI is already in overbought territory, entering a trade may carry a higher risk.
5) Confusing DPO with trend-strength oscillators
Many beginners confuse DPO with indicators like MACD or PPO and expect overbought and oversold readings. But DPO is not designed to measure trend strength, nor is it meant for instant swing entries.
Successful strategies using the DPO indicator
Some common DPO-based strategies include the following approaches.
1) DPO crossovers and candlestick patterns
One way to confirm buy or sell signals is by combining a DPO zero-line crossover with candlestick pattern confirmation.
- When DPO crosses above zero, and a bullish candlestick pattern appears, many traders treat it as a confirmed buy signal.
- Similarly, if DPO moves below zero and a bearish candlestick pattern forms, it may signal a selling opportunity.
Example:
If DPO crosses above zero while a Bullish Hammer forms, this combination can be a strong cue to enter long.
If price action contradicts these signals, or DPO crosses back through zero in the opposite direction, consider closing the trade.
2) Combining DPO with trading volume
Volume indicators reflect market participation and can help confirm or reject signals produced by the DPO indicator.
How to apply it:
- When the DPO signals and trading volume are high or rising, the trade’s probability of success improves.
- If market volume is low, it is often better to skip DPO signals because they may be weak or unreliable.
Key Insight:
Matching the DPO period to an asset’s specific time cycles, such as 14 or 21 days, can improve reversal-cycle analysis.
Conclusion
In summary, DPO is a simple yet powerful tool for identifying short-term price swings and cyclical turning points. By focusing on highs and lows relative to past averages, traders can spot short-term entry and exit opportunities.
Although DPO is not complete on its own, it can become a key part of a professional toolkit when combined with other indicators.


