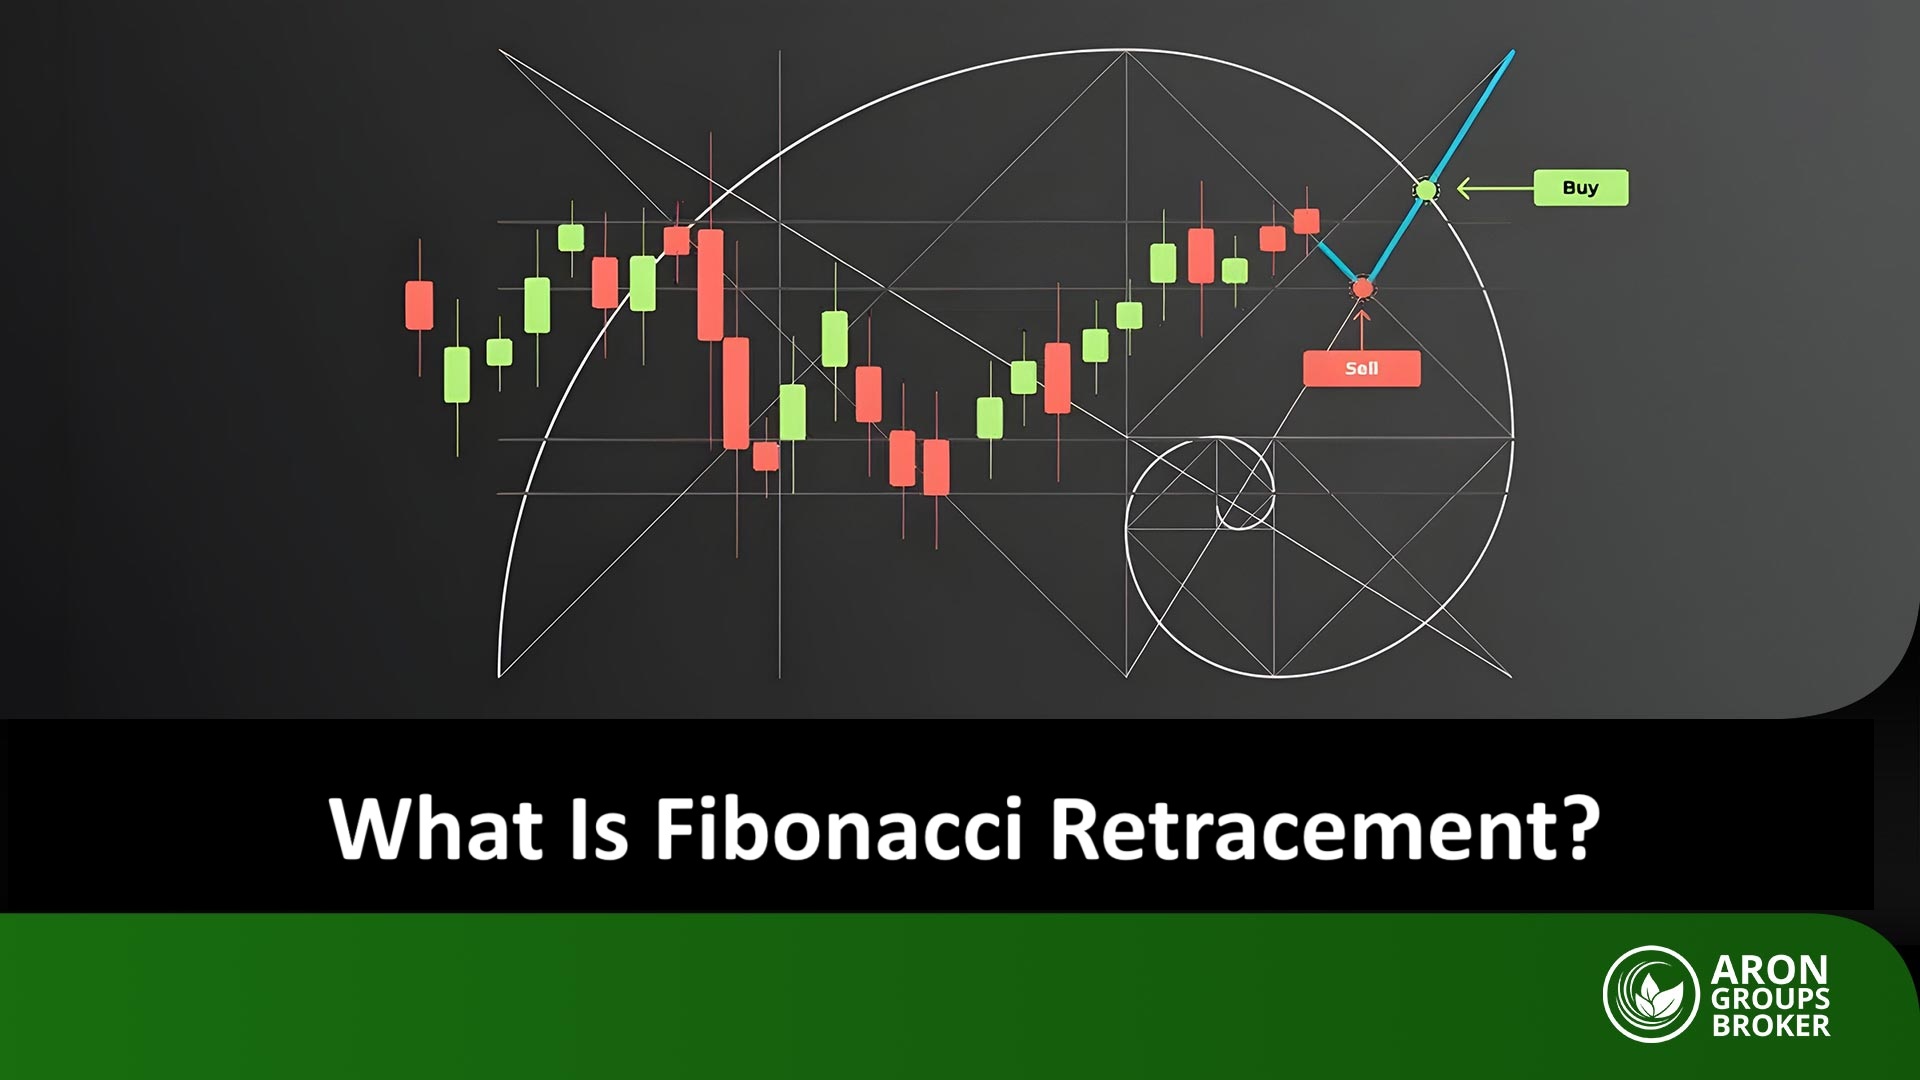


Fibonacci Retracement, also known as Fibonacci Pullback or Fibonacci Correction, is one of the most important and widely used tools in technical analysis. It helps traders and investors identify potential price reversal levels, allowing them to make more informed buy and sell decisions.
In this article, we’ll explore the fundamentals of the Fibonacci sequence, the concept of Fibonacci retracement, and how to effectively apply this tool in trading.

- Selecting the correct main wave is crucial because drawing Fibonacci on a minor corrective move produces weak and unreliable signals.
- Fibonacci works best in trending markets since in sideways or ranging conditions its levels often fail to hold.
- The tool gains strength when combined with others such as trendlines, moving averages, or support and resistance zones which greatly increases the reliability of reversal areas.
- A price touch alone is not a valid signal and waiting for additional confirmations like candlestick patterns, divergences, or structure breaks significantly improves trade accuracy.
What Is Fibonacci?
Fibonacci refers to a sequence of numbers in which each number is the sum of the two preceding ones. This series, which begins with 0, 1, 1, 2, 3, 5, 8, 13, …, is used both in nature and in technical analysis due to the unique mathematical relationships among its numbers.
One of the key features of this sequence is the Fibonacci ratios. When a number in this series is divided by the previous number, ratios such as 61.8%, 38.2%, and 23.6% are obtained. These ratios are used as Fibonacci levels in technical analysis and indicate potential support and resistance levels in the market.
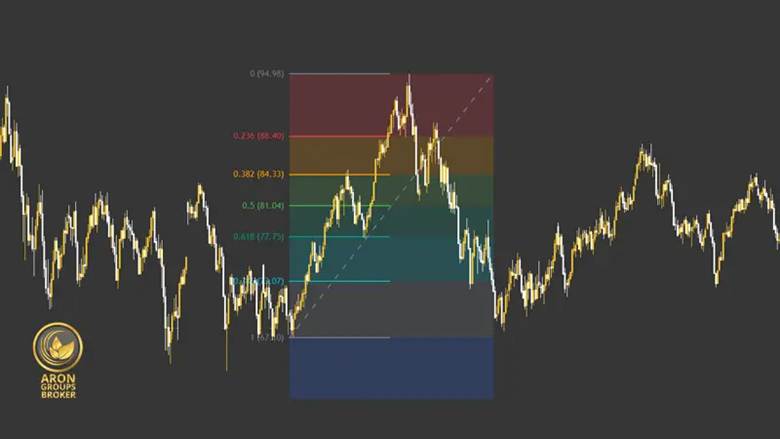
In various Fibonacci tools, traders usually use the 23.6%, 38.2%, 50%, and 61.8% levels to predict potential price reversal points. Among these, the most important range is the “Golden Zone”, which refers to the area between 38.2% and 61.8%. This range is considered one of the key price reversal zones in financial markets, and many analysts pay special attention to it.
Some of the most common Fibonacci tools include Fibonacci Retracement, Fibonacci Extension, Fibonacci Projection, and Fibonacci Fan. Each of these tools has its own specific use in identifying trends and predicting potential reversal or continuation points in price movements. However, in this article, we will focus more specifically on the Fibonacci Retracement tool, which will be explained in detail in the following sections.

According to zerodha: the 61.8% ratio called the “Golden Ratio” can turn into a de facto support or resistance zone simply because many traders anchor orders at that level.
What Is the Fibonacci Golden Zone and Why Is It Important?
The Fibonacci Golden Zone refers to the area between two key retracement levels, 38.2% and 61.8%. This range is considered one of the most sensitive price zones in technical analysis, where traders carefully monitor potential price reversal points. It is called the Golden Zone because in many cases, price corrections tend to pause or reverse within this range before continuing in the direction of the main trend.
The importance of the Golden Zone lies in its reflection of a combination of market psychology and the mathematical relationships inherent in the Fibonacci sequence. Many professional traders place their buy or sell orders around this area. For example, in an uptrend, if the price retraces into the Golden Zone and then shows signs of support or reversal, such as candlestick patterns or a break of the downtrend line, this zone can serve as an ideal entry point for a buy position.
In short, the Golden Zone represents a balanced correction where the price has not retraced too deeply to break the trend nor too slightly to be insignificant. That is why this area is considered a critical level in Fibonacci-based strategies, and analysts often pay special attention to it.
More specifically, the Golden Zone is often defined as the area between the 50% and 61.8% Fibonacci retracement levels. It is regarded as one of the most potent and reliable reversal zones in technical analysis. This importance stems from the combination of these two primary Fibonacci retracement levels and the psychological influence they exert on market participants.
When the price of an asset moves vigorously in an upward or downward trend, it often retraces to the Golden Zone after a correction. At this point, the price may resume its main trend, making this zone a prime area for traders to identify potential entry opportunities.
In many cases, once the price reaches the Golden Zone, reversal signals such as candlestick patterns like pin bars or engulfing formations appear, indicating a possible trend reversal and a return to the main direction.
For this reason, the Golden Zone is widely recognized as one of the most effective and commonly used areas for entering trades, as price reversals frequently occur here, providing traders with valuable opportunities to capitalize on market movements.

What Is Fibonacci Retracement?
Fibonacci Retracement, also known as Fibonacci Correction, is one of the most important and widely used tools in technical analysis. It helps traders identify potential price retracement levels. This tool is based on Fibonacci ratios and is used to determine possible price reversal points or the extent of a price correction within a market trend.
When the price moves within a strong uptrend or downtrend, it often experiences a temporary pullback or correction before continuing in the direction of the main trend. Fibonacci Retracement allows traders to identify these potential reversal points and make more informed decisions about entry and exit positions in their trades.
According to Investopedia: Beyond identifying pullback levels, the tool also helps traders set realistic risk-reward ratios by placing stop-loss orders just beyond the next Fibonacci level.
Fibonacci Retracement Levels
The key Fibonacci retracement levels include 23.6%, 38.2%, 50%, 61.8%, and 100%, each representing a percentage of price correction within a trend. These levels indicate potential areas where the price may pause or reverse.
The 23.6% level is generally considered a shallow retracement, while the 61.8% level is often regarded as one of the most significant reversal levels. The 50% level, though not a true Fibonacci ratio, is widely used due to its psychological importance and the strong attention it receives from traders.
In addition to these main levels, some sources also reference secondary retracement levels such as 13%, 78%, and 88%. Although these levels are less commonly used, they can sometimes provide valuable insight in certain markets and help in conducting more precise price trend analyses.
How to Draw Fibonacci Retracement
Drawing a Fibonacci Retracement requires understanding the basic principles of this tool and recognizing market waves. To begin, you first need to identify a previous impulsive wave. An impulsive wave refers to a strong and directional price movement where the market moves toward a specific target with little to no major corrections. In contrast, a corrective wave is a move against the main trend that represents a temporary pause or pullback in price.
To distinguish impulsive waves from corrective ones, you can use the Elliott Wave Theory. This analytical method classifies impulsive and corrective market waves based on a specific set of principles. If you are not yet familiar with Elliott Waves, it is recommended to study educational resources about Elliott impulse and corrective waves to better understand this analytical style.
In addition to Elliott Wave analysis, using the Zigzag indicator can also be very helpful. This indicator automatically highlights swing highs and lows, showing you the main waves of the market, which makes it easier to find suitable points for drawing the Fibonacci Retracement. However, it is important to note that this tool is not 100% accurate and may produce errors at times.
As mentioned earlier, to draw a Fibonacci Retracement, you must first identify the previous impulsive wave on the chart. In general, drawing this tool requires two clicks. The first click is placed at the beginning of the impulsive wave, and the second click at the end of it. In an uptrend, the first click should be at the lowest point of the wave and the second at the highest point. In a downtrend, the first click should be at the highest point and the second at the lowest point of the impulsive wave.
Fibonacci Retracement Tool in MetaTrader
- Open the asset chart: First, open the chart of the asset you want to analyze.
- Select the Fibonacci tool: From the top toolbar, click on Insert, then choose Objects, and under the Fibonacci section, select Retracement.

- Draw the Fibonacci Retracement: Identify the previous impulsive wave on the chart. Place the first click at the start of the wave (lowest point in an uptrend or highest point in a downtrend) and the second click at the end of the wave (highest point in an uptrend or lowest point in a downtrend).
- View the Fibonacci levels: After drawing, the Fibonacci levels will automatically appear as horizontal lines on the chart. You will see levels such as 23.6%, 38.2%, 50%, 61.8%, and 100%.

Fibonacci Retracement Tool in TradingView
- Open the asset chart: In the TradingView website or app, open the chart of your chosen asset, such as BTCUSD (Bitcoin) or EURUSD (Euro to US Dollar).
- Select the Fibonacci tool: From the left toolbar, click on Gann and Fibonacci Tools, and from the menu that appears, select Fib Retracement under the Fibonacci section.

- Draw the Fibonacci Retracement: Find the previous impulsive wave on the chart. Place the first click at the beginning of the wave (lowest point in an uptrend or highest point in a downtrend) and the second click at the end of the wave (highest point in an uptrend or lowest point in a downtrend).
- Additional settings: In TradingView, you can manually add custom levels such as 13% or 88% through the tool’s settings. This feature is especially useful for traders who work with secondary Fibonacci levels.
- View the Fibonacci levels: Once drawn, the Fibonacci levels will appear as horizontal lines on the chart. You will be able to see levels like 13%, 23.6%, 38.2%, 50%, 61.8%, 78%, 88%, and 100%. For example, in the chart below, you can see how the price correction stopped at the Fibonacci Golden Zone, found support, and then resumed its previous trend.

By following these step-by-step instructions, you can easily draw Fibonacci Retracement on both platforms and use it to analyze the market and predict potential price reversal zones. In the next section, we will discuss how to trade using the Fibonacci Retracement tool in both uptrends and downtrends.
Trading with Fibonacci Retracement in an Uptrend
In uptrending markets, the Fibonacci Retracement tool helps traders identify potential price correction levels. After a strong upward movement, known as an impulsive wave, the market often enters a corrective phase. To find suitable entry points, you can draw the Fibonacci Retracement over this impulsive wave and analyze the retracement levels.
Identifying the impulsive wave
In the example below, which shows the GBP/USD chart on the M5 timeframe, a strong upward move has been identified from the lowest point to the highest point. The Fibonacci Retracement has been applied to this move, and the retracement levels 23.6%, 38.2%, 50%, and 61.8% are displayed as potential areas where the price correction may end.
Entry point
In this case, after the price reached the Fibonacci Golden Zone (around 1.3277), which coincided with the bottom of a short-term descending channel, a bullish reversal signal appeared. This level can be considered a potential entry point, as prices often resume their upward trend after reaching this zone.
Stop loss
In an uptrend setup, the stop loss is typically placed slightly below the Golden Zone, or more precisely, just below the 61.8% Fibonacci retracement level. In this example, a reasonable stop loss could be set around 1.3260.
Take profit
For setting a take-profit target, traders can use previous resistance levels or Fibonacci Extension levels. In this case, the 1.3315 price level, which is near the top of the descending channel and aligns with a previous resistance area, can be considered an appropriate take-profit target.

Trading with Fibonacci Retracement in a Downtrend
In downtrending markets, the Fibonacci Retracement tool helps traders identify retracement levels where the price may potentially resume its downward movement.
Identifying the impulsive wave
In the example below, which shows the USD/CHF chart on the H4 timeframe, a strong downward wave has been identified from the highest point to the lowest point. The Fibonacci Retracement has been drawn over this impulsive wave, and the retracement levels 23.6%, 38.2%, 50%, and 61.8% are displayed as possible correction zones where the price might pause or reverse.
Entry point
After reaching the Fibonacci Golden Zone (around 0.8730), the price shows signs of a bearish reversal. This level can serve as a suitable entry point for a sell trade, as the price begins to move downward from this zone.
Stop loss
In a downtrend setup, the stop loss is generally placed slightly above the Golden Zone, or more specifically, above the 61.8% Fibonacci retracement level. In this example, the stop loss could be set around 0.8830.
Take profit
For setting the take-profit target, traders can look at previous support levels. In this case, the 0.8460 level is chosen as the take-profit point, as it is close to the lowest point of the previous impulsive wave.

Additional Tips for Using Fibonacci Retracement
Using the Fibonacci Retracement tool in technical analysis is one of the most popular and widely adopted methods for identifying potential market reversal levels. However, to use it effectively and minimize possible errors, it is essential to understand several key complementary points.
Fibonacci retracement levels alone are not sufficient.
The first point to remember is that Fibonacci levels are not perfectly accurate. This tool is purely based on Fibonacci number sequences and does not guarantee that prices will reverse exactly from these levels.
While retracement levels such as 23.6%, 38.2%, 50%, and 61.8% are often considered potential reversal zones, other factors such as historical support and resistance, trading volume, and market psychology also play a significant role. Therefore, relying solely on Fibonacci without considering other technical factors can lead to inaccurate trading decisions.
Use Fibonacci Retracement to determine entry and exit points.
One of the main advantages of Fibonacci Retracement is that it helps traders identify logical entry and exit points within a trend and measure the depth of price corrections. This tool can effectively assess the strength and potential of a retracement, provided it is combined with other techniques such as price patterns and technical indicators. However, as mentioned earlier, it is not foolproof, and in highly volatile or choppy markets, it may produce less reliable results.
Combine Fibonacci Retracement with Elliott Wave analysis.
Another crucial aspect of using Fibonacci Retracement effectively is understanding the Elliott Wave Theory. As a complementary system, Elliott Waves can help traders distinguish between impulsive and corrective waves, making it easier to draw Fibonacci retracements accurately on previous impulsive waves. Combining Fibonacci analysis with Elliott Wave principles can significantly increase the precision of your market analysis.
For traders who are not yet fully comfortable with Elliott Wave theory, using the Zigzag indicator can be a practical alternative. The Zigzag indicator highlights major swing highs and lows, helping identify impulsive and corrective moves more clearly and improving the accuracy of your Fibonacci drawings.
Do not forget risk management.
Perhaps the most important point of all is risk management. A trader should always set stop loss and take profit levels based on Fibonacci analysis and remember that financial markets are inherently unpredictable. Therefore, using a stop loss in trades based on Fibonacci levels is absolutely essential to protect your capital.
Secondary retracement levels can also be useful.
Finally, it is worth noting that secondary Fibonacci retracement levels such as 13% and 88% are sometimes mentioned in certain sources as less common retracement levels. While these levels can be useful in specific market conditions and may appeal to advanced traders, they should not be used as primary reference points without sufficient testing and practice.
The greater the number of Fibonacci levels that align in one area, the stronger and more reliable that zone becomes.
Fibonacci Confluence Technique for Stronger Trading Signals
The Fibonacci Confluence Technique is applied when multiple Fibonacci tools or methods such as Fibonacci Retracement, Extension, and Projection highlight important price levels within the same area. When these Fibonacci levels overlap, the likelihood of a strong reversal or trend continuation increases because multiple confirmations occur in one zone.
Why is confluence important?
When several Fibonacci levels from different price swings align in the same area, that zone becomes a significant support or resistance level. These areas often lead to strong and immediate price reactions, offering traders high-quality trading opportunities.
Steps to apply the Fibonacci Confluence Technique:
- Identify the major and minor waves in the market, either visually or by using tools such as the Zigzag indicator.
- Draw the Fibonacci Retracement on the larger wave to locate key retracement levels.
- Draw the Fibonacci Extension or Projection on the smaller wave in the same or opposite direction to estimate potential price targets.
- Find overlapping zones where multiple Fibonacci levels coincide, for example, a 61.8% retracement aligning with a 161.8% extension.
- Confirm the signal using additional methods such as price action analysis, candlestick patterns, or momentum indicators.
Example:
- Suppose the EURUSD chart is showing an uptrend.
- The Fibonacci Retracement drawn from the low to the high of the main wave identifies the 61.8% level at 1.0850.
- The Fibonacci Extension drawn from the most recent corrective wave shows the 161.8% level at 1.0852.
- This overlap suggests that the area between 1.0850 and 1.0852 is a strong support zone. If confirmed by price action, such as the appearance of a bullish pin bar, this level can be considered a good buy entry opportunity.
It is recommended to identify Fibonacci confluence zones on higher timeframes and look for precise entry setups on lower timeframes.
Step-by-Step Trading Strategies with Fibonacci Retracement
The Fibonacci Retracement tool is not just an analytical instrument; it serves as a foundation for developing a set of powerful trading strategies. In this section, we will review several practical methods for identifying entry and exit points using Fibonacci retracement levels over time.
Strategy: Entering on a Pullback to the Golden Zone
This strategy is ideal for trending markets, especially when you want to join the main trend during a temporary correction.
Step 1: Identify a clear uptrend
Look for a chart where the price is forming higher highs and higher lows, indicating a strong bullish structure.
Step 2: Draw the Fibonacci Retracement from the swing low to the swing high
Place the starting point at the bottom of the impulsive wave and the ending point at the top.
Step 3: Wait for a price correction into the Golden Zone
Highlight the area between 50% and 61.8% on the chart. This is the Golden Zone, where the price is expected to find support and potentially reverse upward.
Step 4: Confirm entry with a reversal candlestick pattern
Wait for a bullish confirmation candle within the Golden Zone. Common confirmation patterns include:
- Bullish Pin Bar
- Bullish Engulfing Candle
- Hammer
Step 5: Enter a Buy position
After confirmation, open a buy trade at the next candle’s open.
Step 6: Set a Stop Loss
Place your stop loss a few pips below the 61.8% level to avoid being stopped out by normal market fluctuations.
Step 7: Set a Take Profit target
For the take-profit level, you can use either:
- The previous swing high, or
- Fibonacci Extension levels such as 1.27% or 1.61%.

In this chart, an upward wave has been analyzed using the Fibonacci Retracement tool. After a strong rally, the price retraced to the 61.8% level, where a bullish Pin Bar candlestick pattern formed within the Golden Zone. This area, marked as the Demand Zone, indicates the entry of buyers and the resumption of the bullish movement.
Strategy: Using Fibonacci Levels as Take-Profit Targets
In Forex trading, one effective way to determine profit-taking zones is by using Fibonacci Retracement levels. These levels help traders define logical exit targets based on the natural price movements of the market.
Steps to apply this strategy:
- Identify the main price wave
For example, a clear upward move from a swing low to a swing high.
- Draw the Fibonacci Retracement tool
Apply the tool from the low (start of the trend) to the high (end of the trend).
- Identify key Fibonacci levels
The 38.2%, 23.6%, and 0% levels are typically used as staged profit-taking targets.
- Set Take Profit orders
Depending on your risk tolerance, you can partially close positions at each of these levels to secure profits.

In the example chart, a candlestick price chart is shown with Fibonacci Retracement levels used for determining take-profit zones.
- Point A: The start of the upward move (swing low). This is where the Fibonacci tool begins.
- Point B: The end of the upward move (swing high). The Fibonacci tool is drawn from Point A to Point B.
- Corrective move after Point B: After reaching the high, the price enters a pullback phase.
Fibonacci Levels:
- 38.2% – First take-profit target (TP1)
- 23.6% – Second take-profit target (TP2)
- 0% – Corresponds to the swing high (Point B) and serves as the final target if the trend continues.
Blue shaded area:
This area represents the profit-taking zone where traders can secure partial gains. It lies between Point B and the 0% level, corresponding to the previous price high.
By following these step-by-step Fibonacci strategies, traders can make data-driven entry and exit decisions, combining price structure, Fibonacci ratios, and confirmation signals for higher accuracy and consistent performance in trending markets.
Always apply risk management. Even Fibonacci confluence zones are not perfectly accurate, so placing a stop loss is always necessary.
Fibonacci Overlap with Other Tools for Creating a Potential Reversal Zone (PRZ)
One of the most powerful ways to use Fibonacci analysis is by combining it with other technical tools. When a key Fibonacci level (such as 38.2% or 61.8%) perfectly aligns with classic support or resistance, moving averages, or valid trendlines, a zone known as the Potential Reversal Zone (PRZ) is formed. This area has a high probability of producing a price reversal.
1. Fibonacci Overlap with Classic Support and Resistance
In the Gold (XAUUSD) chart, the price rises from 1900 USD to 2000 USD.
The 61.8% Fibonacci retracement level lies around 1938 USD.
At the same level, there is also a significant daily support zone.
Result:
This overlap creates a strong PRZ. Traders can enter a buy position once a price action confirmation such as a reversal candlestick appears.

In the chart above, the Gold (XAUUSD) price is shown with the Fibonacci Retracement tool applied. The 61.8% retracement level clearly acts as a strong support, where the price reacted and moved upward effectively.
2. Fibonacci Overlap with the 50 EMA
In the S&P 500 chart, an upward move occurs from 4200 to 4400.
The 50% Fibonacci retracement level aligns around 4300.
At the same point, the 50 EMA also passes through this level.
Result:
The combination of Fibonacci and the 50 EMA indicates that 4300 can act as a strong support zone with a high probability of reversal.

In this chart example, the Fibonacci Retracement tool is shown to illustrate how retracement levels can align with other technical indicators, even though it may not exactly depict the 50% Fibonacci level overlapping with the EMA50. It clearly demonstrates how combining tools can help identify strong reversal areas.
3. Fibonacci Overlap with a Valid Trendline
In the EURUSD chart, an uptrend is present.
The 38.2% Fibonacci retracement level is located at 1.1050.
At the same price level, a rising trendline (which has been tested several times before), also exists.
Result:
The simultaneous touch of the Fibonacci level and the trendline creates a Potential Reversal Zone (PRZ). When a bullish confirmation candle appears, traders can open a buy trade with increased confidence.

In the chart above, the Fibonacci Retracement tool is combined with a valid upward trendline, providing an excellent visual example of how overlapping Fibonacci levels with trendlines can create a strong PRZ.
The more overlapping confirmations there are, such as Fibonacci, Support and Resistance, EMA, and Trendline, the stronger the PRZ becomes and the more reliable the reversal signal will be.
Common Mistakes When Drawing and Using Fibonacci Retracement
The Fibonacci Retracement tool is one of the most widely used techniques in technical analysis, but incorrect application can easily lead traders to make poor decisions. Below are three of the most common mistakes to avoid.
1. Drawing Fibonacci on the Wrong Waves
Many beginner traders mistakenly draw Fibonacci on a corrective wave, whereas it should always be applied to the main impulsive wave.
Mistake: Drawing Fibonacci on a small corrective move and expecting a price reaction.
Correct method: Select the main impulsive wave (from the swing low to the swing high or vice versa) and analyze its retracement levels to find potential entry or exit points.

The chart above illustrates the structure of impulsive and corrective waves. The Fibonacci tool should be applied to the main impulsive move (such as the movement from point 1 to 5 or from A to C), not to minor corrective waves.
2. Using Fibonacci in Ranging or Non-Trending Markets
The Fibonacci Retracement tool is designed to measure price corrections within a trend, not in sideways or range-bound markets.
Mistake: Drawing Fibonacci levels in a market where price is oscillating within a fixed range.
Correct method: Use this tool only when there is a clearly defined uptrend or downtrend.

The chart of EURUSD shown above demonstrates this clearly. Fibonacci levels were applied during a downtrend followed by an upward reversal. As you can see, when the market enters a consolidation zone, Fibonacci levels lose effectiveness.
However, once a strong trend resumes, price reactions to Fibonacci levels such as 38.2% and 61.8% become meaningful. This clearly shows that Fibonacci works best in trending markets, not when prices move sideways within a fixed range.
3. Entering Trades Immediately After Price Touches a Fibonacci Level
Fibonacci levels are not magical points that guarantee reversals. They need confirmation before entering a trade.
Mistake: Entering a position immediately when the price touches the 38.2% or 61.8% level.
Correct method: Wait for additional confirmation signals such as candlestick patterns, volume spikes, or market structure breaks before entering a trade.

In the example chart, Fibonacci levels are drawn on an uptrend. After a correction to the 50% level, a bullish engulfing candle forms. This pattern acts as a confirmation signal, showing that entry should not be based solely on the price reaching a Fibonacci level. Instead, traders should wait for supporting confirmations.
The example perfectly emphasizes that combining Fibonacci Retracement with candlestick patterns can significantly improve the accuracy and reliability of trade entries.
Conclusion
Fibonacci Retracement is a powerful tool for identifying support and resistance levels in the market and can be effectively used in both uptrends and downtrends. However, like any other analytical tool, Fibonacci Retracement has its limitations. To achieve greater success in trading, it is best to combine it with other technical analysis tools and apply proper risk management principles.