


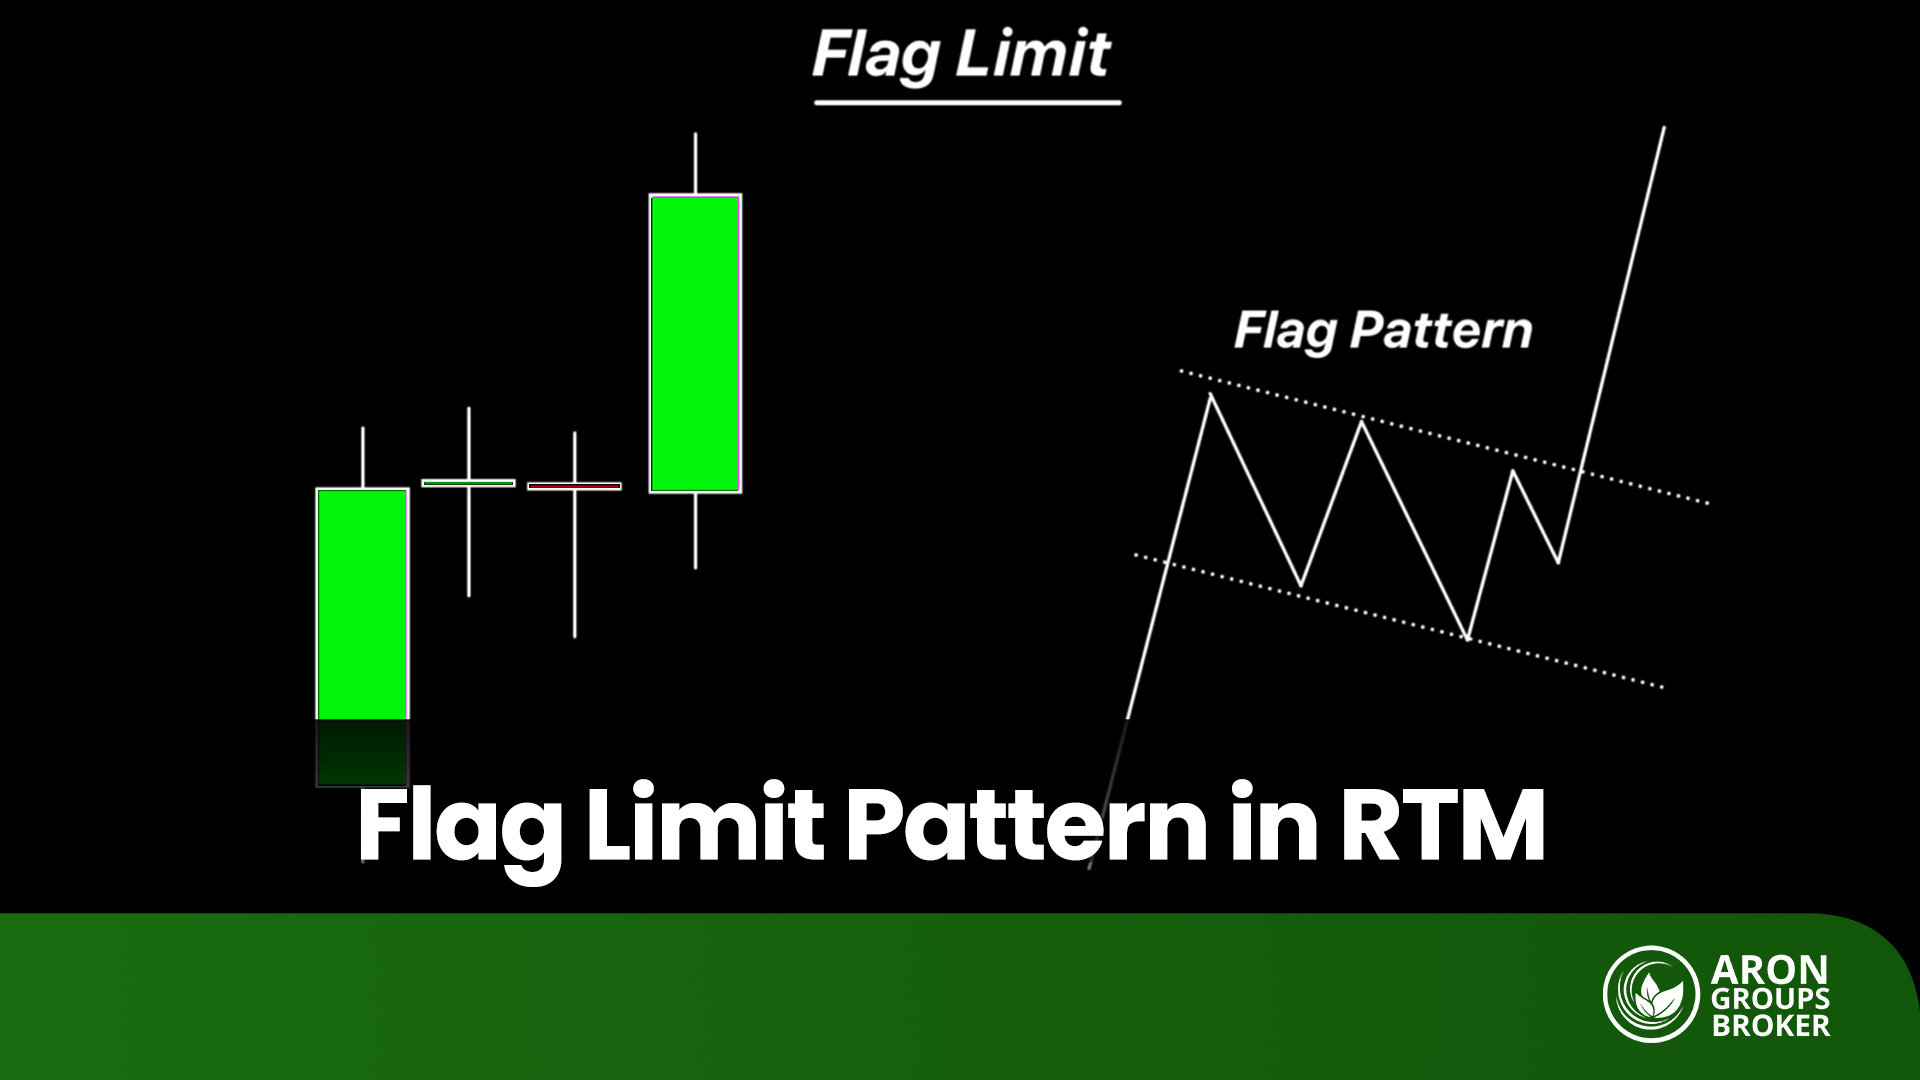


Flag Limit (FL) in the RTM (Read The Market) style is a price zone that forms after a sharp move when the market pauses briefly and then usually continues in the same direction. In RTM, this is called the Decision Zone, because buyers and sellers reassess there, often creating low-risk entry opportunities.
Flag Limit is presented alongside concepts like FTR and Compression and forms the backbone of many price action setups. In the following sections, we’ll cover the exact definition, how to draw it, and how to trade it.

- Flag Limits on higher timeframes (e.g., Daily or H4) are more reliable and produce stronger signals.
- The strength of a Flag Limit also depends on volume during the base formation; lower volume often points to a stronger zone.
- Newly formed Flag Limit zones usually carry more weight than older ones.
- The narrower the FL base, the better the entry precision and the risk-to-reward ratio.
What is a Flag Limit?
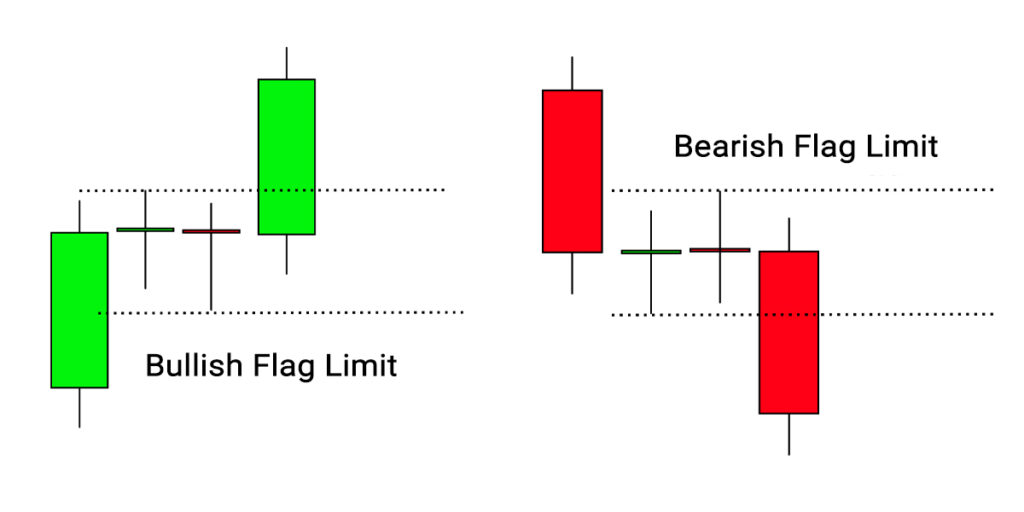
A Flag Limit is a narrow price zone that forms after a fast, impulsive move in the market. Price makes a brief pause for a few candles (candlesticks) in a small base, then usually continues in the prior direction. The upper and lower boundaries of this zone are taken from the highest and lowest prices of the base candles and are drawn as a horizontal rectangle on the chart.
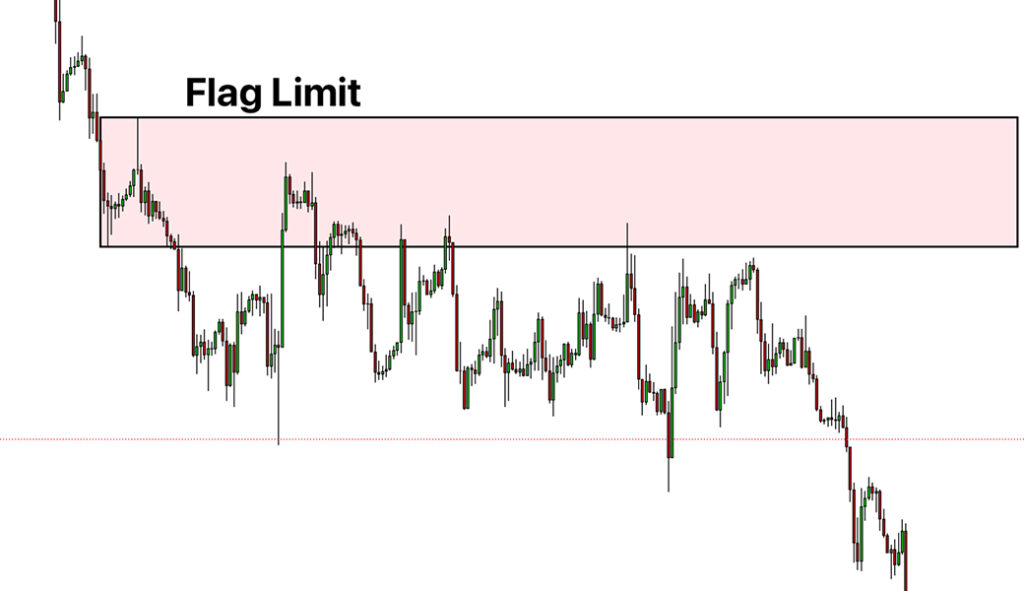
If the trend is bullish, this pause usually sits between two bullish legs and forms an RBR (Rally–Base–Rally) structure. If the trend is bearish, it appears between two bearish legs and forms a DBD (Drop–Base–Drop). In both cases, the base acts as a demand/supply zone, and a return to this area can offer a good entry opportunity.
Flag Limit Structure in RTM
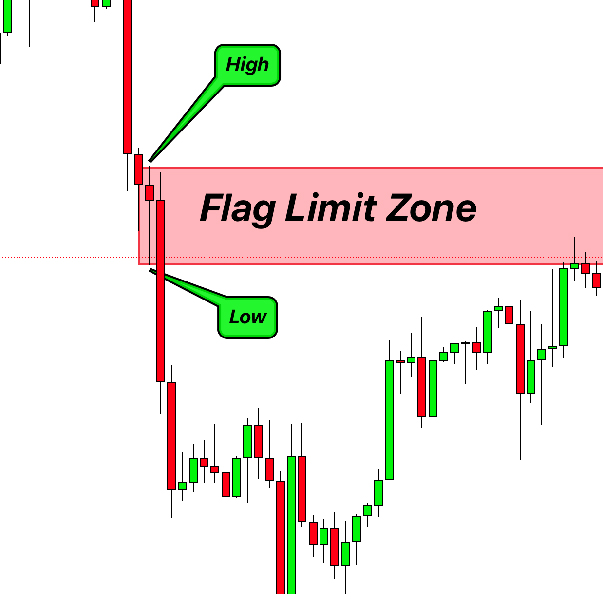
As shown in the image, after a strong bearish move, the price pauses briefly and creates a small range. This range is the Flag Limit zone.
- The upper line (High) is the highest price of the base.
- The lower line (Low) is the lowest price of the base.
- The space between these two lines is what RTM price-action traders call the Decision Zone.
In practice, when price revisits this zone, it can provide a solid entry in the direction of the main trend.

According to ForexBee, the Flag Limit works more precisely than classic support/resistance and is designed to pinpoint entry and exit levels, making decision-making simpler.
Difference Between the Flag Limit in RTM and the Classic Flag Pattern
In technical analysis, the classic Flag is a continuation pattern. It begins with a strong impulse to move the flagpole, followed by a parallel channel where price oscillates between support and resistance. When the price breaks out of this channel, the prior trend usually continues. This pattern is mainly used to identify trend continuation.
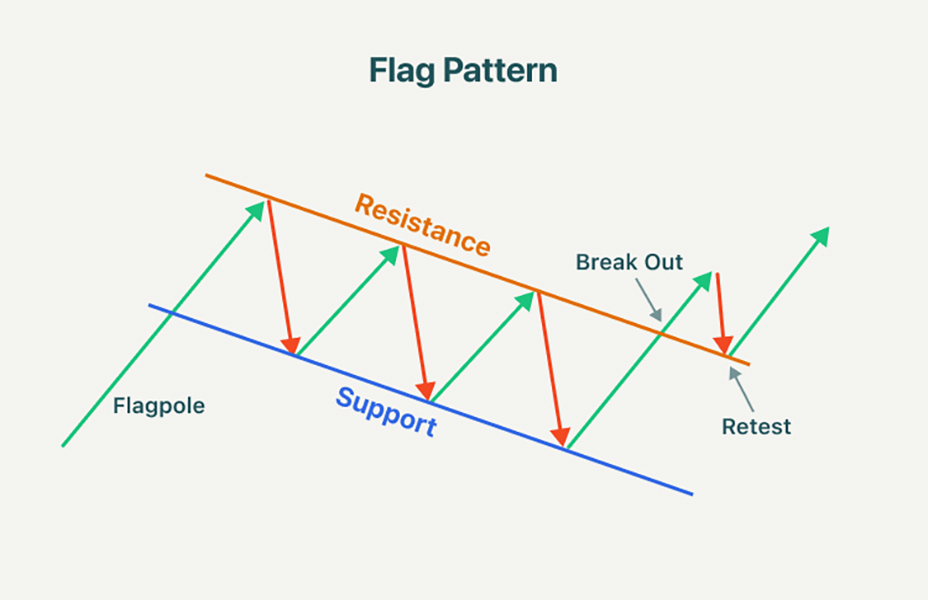
However, the RTM Flag Limit is a small horizontal zone (the Decision Zone). When price returns to this area, it signals a high-probability entry into the market.
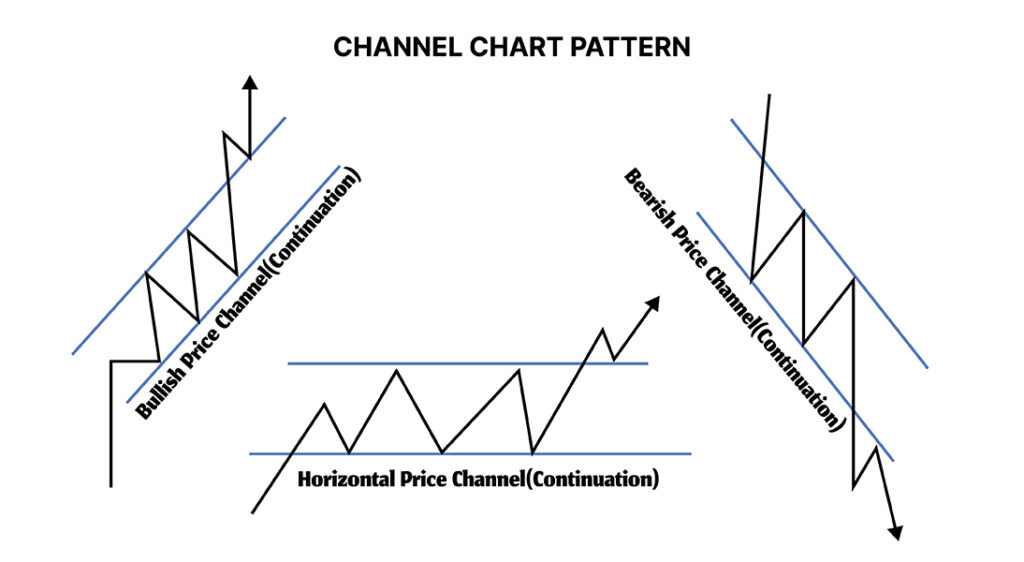
Difference Between the Flag Limit in RTM and a Classic Channel
A classic channel forms when price moves up and down between two parallel lines (dynamic support and resistance). The channel can be ascending, descending, or horizontal, and traders often use touches at the top/bottom of the channel for entries or exits.
However, the Flag Limit in RTM is a small horizontal zone that forms after a strong impulsive move in the market.
How to Trade the Flag Limit in RTM
Follow three simple steps:
- Identify the main trend: Decide whether the market is bullish or bearish. In a strong uptrend, look for bullish Flag Limits (RBR); in a downtrend, look for bearish Flag Limits (DBD).
- Find the Flag Limit: After the impulse move, locate the short pause/base (a few small candles). Mark the zone using the highest and lowest prices of the base candles.
- Enter the trade: When price retests the zone, wait for confirmation of a reversal candle (e.g., Engulfing or Pin Bar) or a structure break on a lower timeframe, then execute the entry.
How to Identify Entry and Exit Points Using the Flag Limit
- Entry: When price retests the Flag Limit zone and you see confirmation of a reversal candle (e.g., Engulfing or Pin Bar) or a structure break, that’s your entry signal.
- Exit: Exits are usually based on either:
- price reaching the next Flag Limit in the trend direction, or
- price hitting a key support/resistance level.
This approach makes entries more precise and exits more logical.
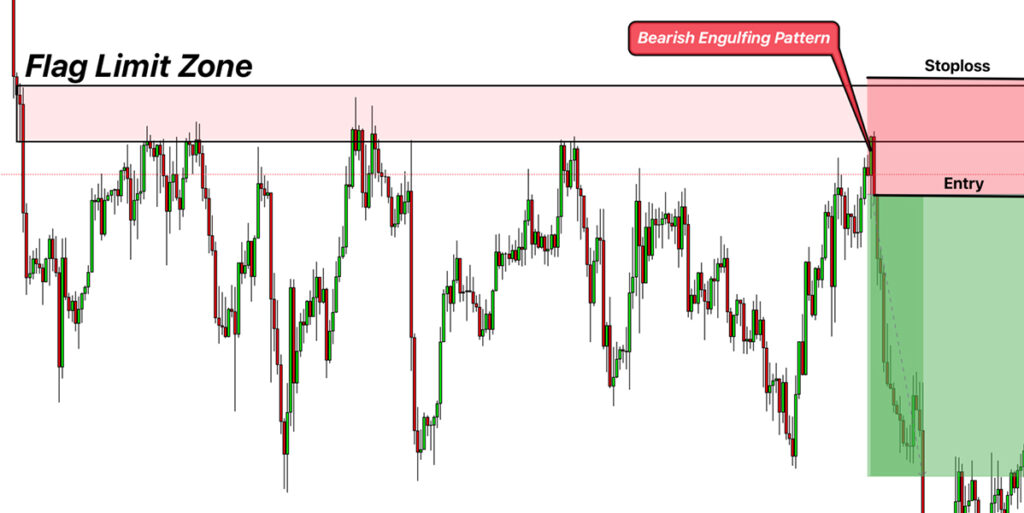
How to Set the Stop Loss Using the Flag Limit
Rule: Place the Stop Loss slightly outside the Flag Limit zone.
- For a bullish FL, set the SL a bit below the lower boundary of the zone.
- For a bearish FL, set the SL a bit above the upper boundary of the zone.
Purpose: If the price crosses this boundary, the zone is invalidated, and the initial analysis was likely wrong, so a quick exit is the best choice.
In simple terms, the Flag Limit acts like a wall; if price breaks through that wall, you shouldn’t stay in the trade.
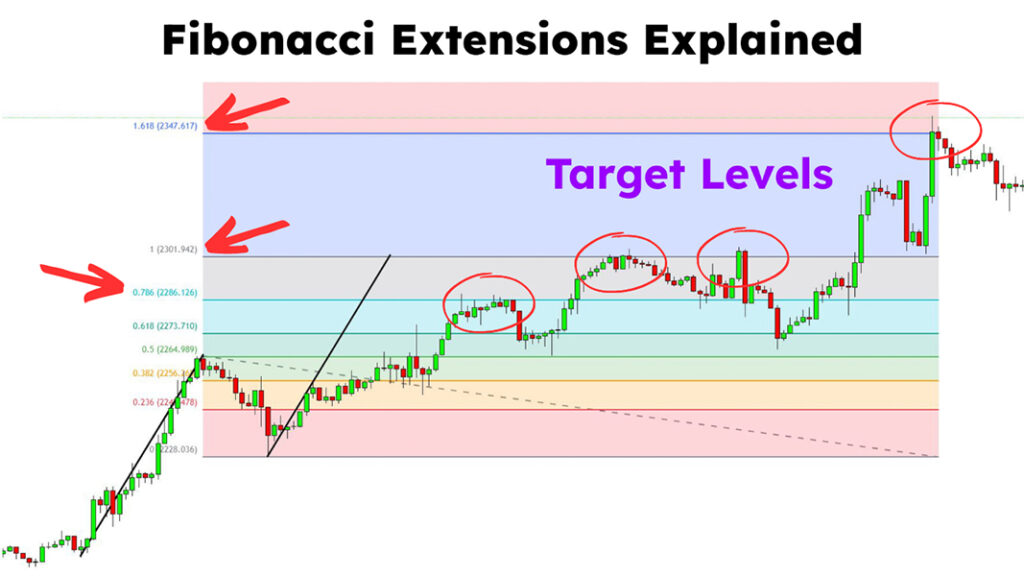
Combining the Flag Limit in RTM with Fibonacci to Set Targets
When trading RTM with a Flag Limit, you need to define profit targets. One of the best tools for this is Fibonacci (Fibonacci extensions/levels).
How it works:
- After identifying the Flag Limit zone and taking the trade, apply the Fibonacci tool to the prior impulse leg.
- In an uptrend, anchor from the swing low to swing high.
- In a downtrend, anchor from the swing high to swing low.
- Use Fibonacci extension levels 127.2%, 161.8%, and 261.8% as primary target candidates.
- When these levels overlap (confluence) with the next Flag Limit zones or major support/resistance, the targets gain higher credibility.
Benefits of this combination:
- The Flag Limit gives a precise entry point.
- Fibonacci defines likely exit zones and profit targets.
- Together, they provide a clear plan for entry, stop-loss, and exit.
Combining the Flag Limit in RTM with Moving Averages
A Moving Average (MA) is one of the simplest yet most useful technical tools for showing the market’s overall trend. When you combine it with the Flag Limit (FL) in RTM, you can build more precise and reliable setups.
How it works:
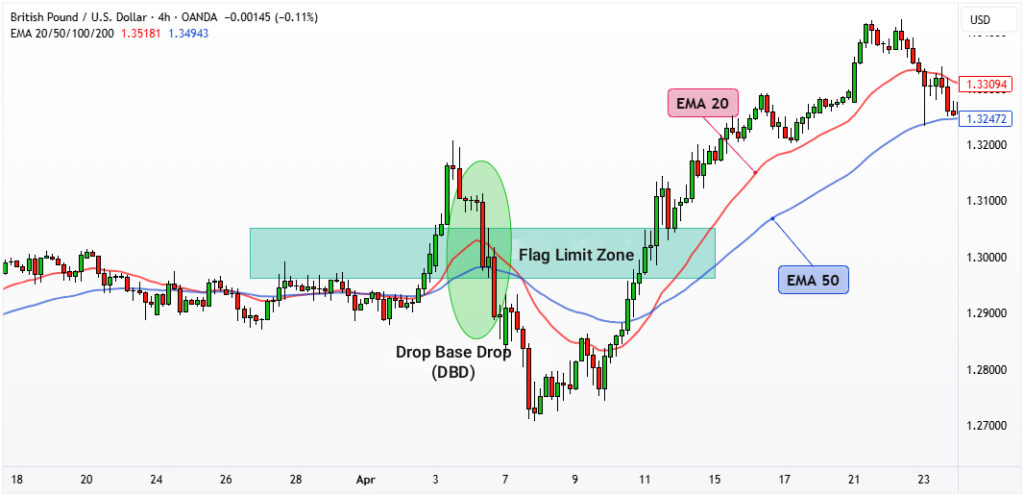
- First, define the broader trend with one or two EMAs, such as EMA20 or EMA50.
- If price is above the MA, the trend is bullish.
- If price is below the MA, the trend is bearish.
- After you identify the Flag Limit zone (the small base after the impulse move), check whether this zone is aligned with the MA direction.
- If price pulls back to the Flag Limit and the MA confirms the same direction, you can enter the trade with higher confidence.
Benefits of this combination:
- The Flag Limit gives a precise entry point.
- The Moving Average filters the overall trend direction.
Result: the trader takes positions aligned with the trend and with lower risk.
Combining the Flag Limit in RTM with the MACD Indicator
The MACD is one of the most popular technical analysis tools for showing the strength and direction of price momentum. When you combine MACD with the Flag Limit in RTM, you can achieve more confident entries and more precise targets.
How it works:
- Identify the Flag Limit: After a strong impulse (rally or drop), find the small base and mark the FL zone.
- Check MACD:
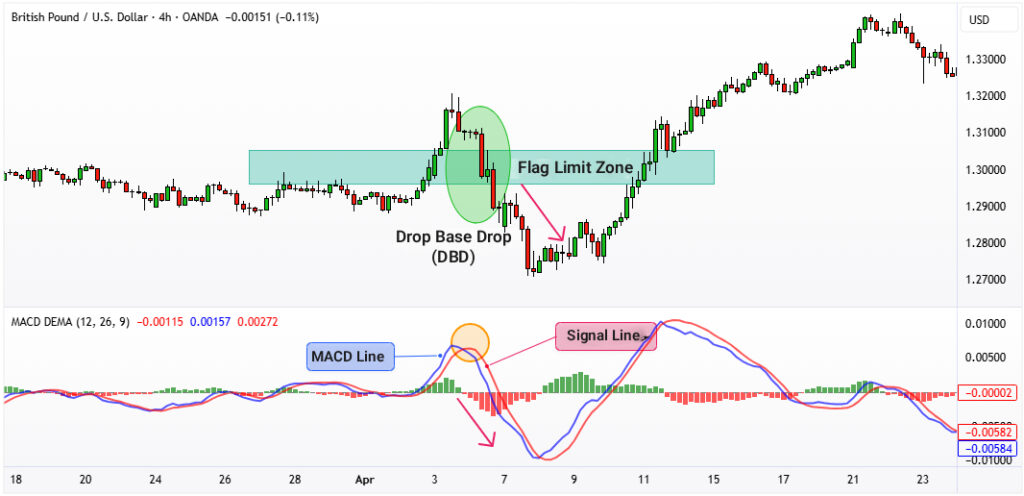
- On a bullish FL retest, look for a bullish MACD crossover or MACD crossing above the zero line; this confirms trend continuation.
- On a bearish FL retest, look for a bearish MACD crossover or negative divergence (price makes a higher high while MACD makes a lower high), a solid confirmation for short setups.
For example:
- In an uptrend, if price pulls back above the Flag Limit and the MACD shows a bullish crossover at the same time, it signals a good buy setup.
- In a downtrend, if price retests the bearish Flag Limit and MACD is below the zero line, it signals a good sell setup.
Combining the Flag Limit in RTM with the RSI Indicator
The RSI (Relative Strength Index) shows the strength of buying and selling in the market. It moves between 0 and 100:
- Above 70 = overbought (higher chance of a pullback or decline).
- Below 30 = oversold (higher chance of a rebound or rise).
How it works:
- As usual, first find the Flag Limit (FL) zone after a strong impulse move.
- Wait for price to retest this zone.
- Check the RSI at the same time:
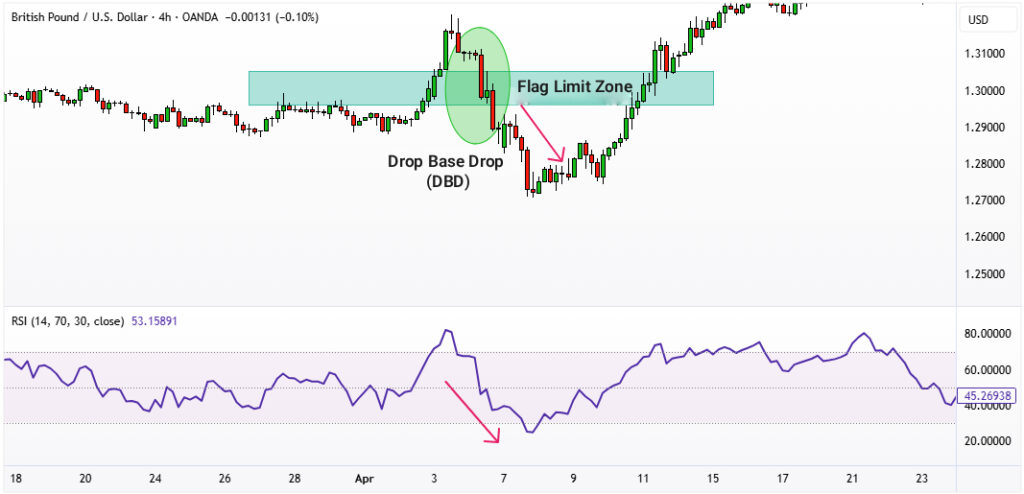
- If it’s a bullish FL and RSI is near oversold (<30) or turning up, the long entry has higher conviction.
- If it’s a bearish FL and RSI is near overbought (>70) or turning down, the short entry is more reliable.
- RSI divergence also matters:
- If price reaches a bearish FL but RSI prints a lower high (bearish divergence), downside probability increases.
- If price reaches a bullish FL but RSI prints a higher low (bullish divergence), upside probability increases.
Common Mistakes Traders Make When Using the Flag Limit
Many traders misuse the Flag Limit. Knowing these mistakes helps you avoid common traps and build tighter setups.
Confusing the Flag Limit with a classic Flag or Channel
The FL is a narrow, horizontal zone, not a slanted channel or a classic continuation pattern.
Drawing the zone incorrectly
Some only use candle bodies or draw the zone too thin/too wide. You should set the boundaries from the high/low of the base candles.
Entering without confirmation
Don’t enter just because price touches the zone. Wait for price action confirmation—a Pin Bar, Engulfing candle, or a structure break on a lower timeframe.
Ignoring the number of retests
Multiple touches usually weaken the zone. Late entries after many retests often get caught in a break of the zone.
Skipping risk management
Even a strong FL can fail. Place the Stop Loss (SL) just outside the zone and control position size to avoid oversized losses.
Using it in a ranging market
The FL works best in trending conditions. In range markets, it often produces false signals.
Conclusion
In the RTM style, the Flag Limit helps remove guesswork and makes entry, Stop Loss, and Take Profit levels clearer. Combining this zone with tools like Fibonacci, Moving Averages, MACD, and RSI increases entry precision and reduces trade risk.
Success with the Flag Limit depends on drawing the zone correctly, waiting for price-action confirmation, and applying solid risk management. Follow these principles, and the Flag Limit can become one of your most powerful tools for finding high-probability setups in the market.


