


In financial markets, prices sometimes move so quickly that they cross part of their path without any trading taking place. This trading void, which signals a disruption in the balance between supply and demand, can provide valuable information about future market behaviour.
The concept of the Fair Value Gap (FVG) is based precisely on the idea of identifying zones the market is likely to revisit, either to correct or to continue the prevailing trend.
In this article, we explore the structure, uses, identification methods, and trading strategies built around FVG.

- FVG, or Fair Value Gap, refers to the distance between the current market price of an asset and the fair value estimated for it.
- This gap usually forms after a rapid price move where no trades have taken place within a specific price range.
- FVGs often arise from extreme market sentiment, major economic news, or political events that push price temporarily away from its real value.
- Traders typically identify these gaps using technical analysis, especially candlestick patterns and detailed price charts.
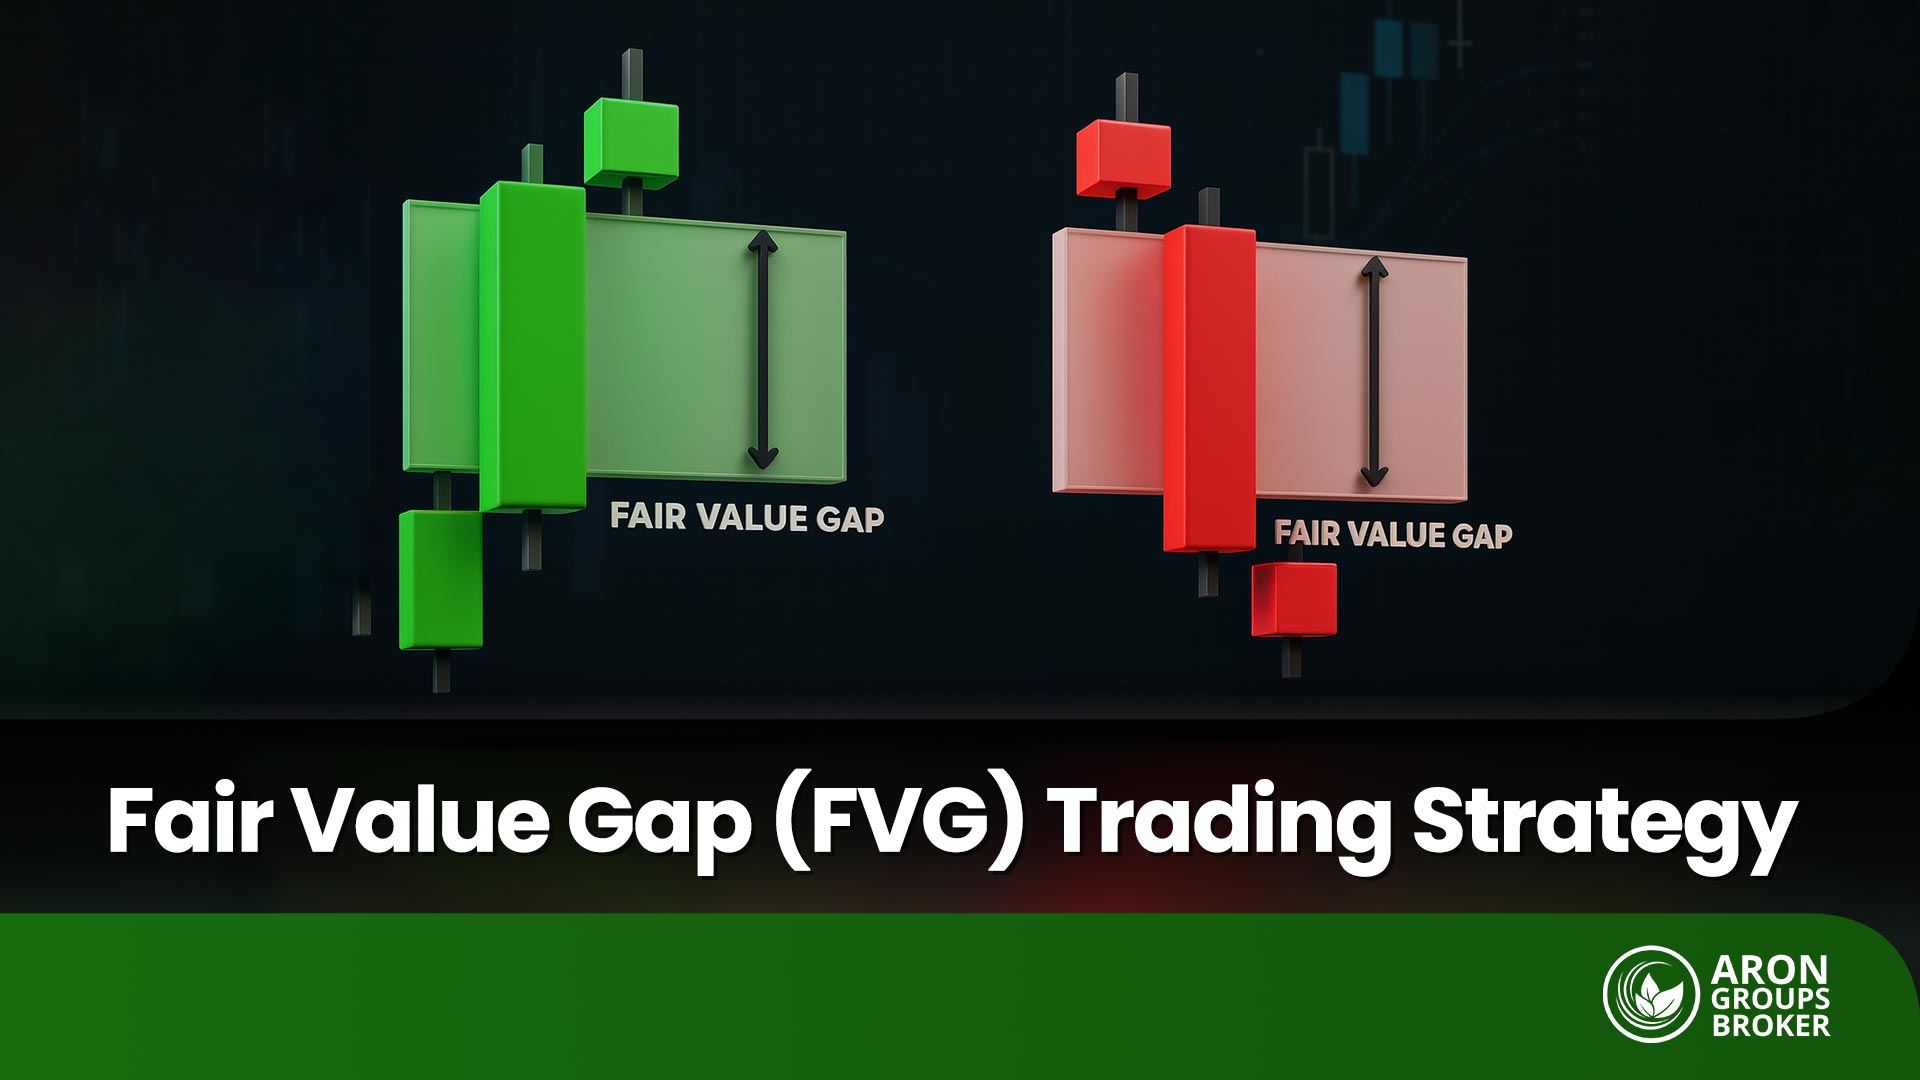
What Is FVG and Why Does It Matter in Price Action?
A Fair Value Gap (FVG) is a zone on the price chart where, during a sudden move, the price jumps from one level to another, with no trading occurring between those two levels. This move is often triggered by economic news, strong market sentiment, or the entry of large institutional players, creating an imbalance in the market.
In price action trading, and especially within Smart Money Concepts (SMC), detecting FVGs is one of the key ways to find trading opportunities. The market tends to revisit these zones to “fill” the price gap. Knowing where these hidden structures lie on the chart can help traders plan more precise entries and exits.
What Is an Imbalance Zone on the Chart and Why Is It Important?
An imbalance zone is a part of the chart where price has moved quickly and firmly, without achieving a balance between supply and demand. In such conditions, one side of the market – buyers or sellers – has complete control, and prices surge in one direction without meaningful countervailing reactions.
These zones are usually a sign of a Fair Value Gap (FVG). In the future, they can serve as potential areas where prices may return or as important support and resistance zones for traders.
How to Identify FVG on a Price Chart
To correctly identify an FVG on the chart, you need to pay attention to several key factors:
From the arrangement of candlesticks and the choice of timeframe to the tools that help you detect these zones more quickly and accurately. Below, we look at each of these aspects in detail.
How to Spot FVG Using Candlesticks
To detect a Fair Value Gap (FVG) on candlestick charts, you should look for a specific pattern that shows a fast price move with a trading void.
The identification process is as follows:
- First candlestick:
- Comes before the sharp price move and signals the start of buying or selling pressure.
- Second candlestick:
- A strong candle with high momentum that creates the internal price gap.
- Third candlestick:
- Continues the previous move, but the price does not return to the area between the high of the first candle and the low of the third candle.
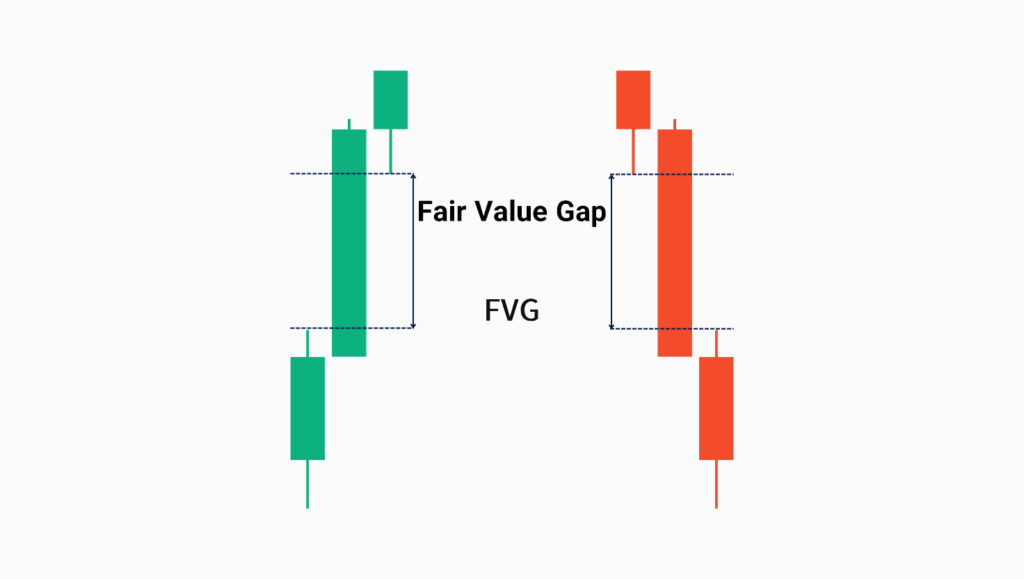
In an uptrend, the area between the high of the first candle and the low of the third candle forms the FVG zone.
In a downtrend, the FVG zone lies between the low of the first candle and the high of the third candle.
This FVG area often acts like a magnet in the future and can attract prices back toward it.
Which Timeframes Are Best for Finding FVGs?
In professional analysis, the 4-hour (H4), daily (D1), and even weekly timeframes are usually the best environments for identifying FVGs, because strong, impulsive moves with clearer structure tend to form on these higher timeframes.
For day trading or scalping, you can also look for smaller FVGs on the 15-minute, 30-minute, or 1-hour charts, which typically offer shorter-term targets.
The long-term chart below shows an example of bullish FVGs in a monthly trend that are being filled one after another.

According to TrendSpider, a valid FVG should not only show an empty space between candlesticks, but also be confirmed by high volume and a rapid breakout from the zone. Simply seeing a gap is not enough.

Tools and Indicators for Faster FVG Detection
Manually spotting FVGs requires a high level of attention, but using indicators can make the process much easier.
Some examples of Fair Value Gap indicators on TradingView include:
- Fair Value Gap [LuxAlgo];
- ICT Fair Value Gap [LM];
- Fair Value Gap (Volumetric) by FluxCharts.
The image below shows a list of popular indicators that appear when you search for “Fair Value Gap” in the Indicators section on TradingView.

Trading Strategies Using FVG
Entering a Trade After Price Reacts to the FVG Zone and Fills the Gap
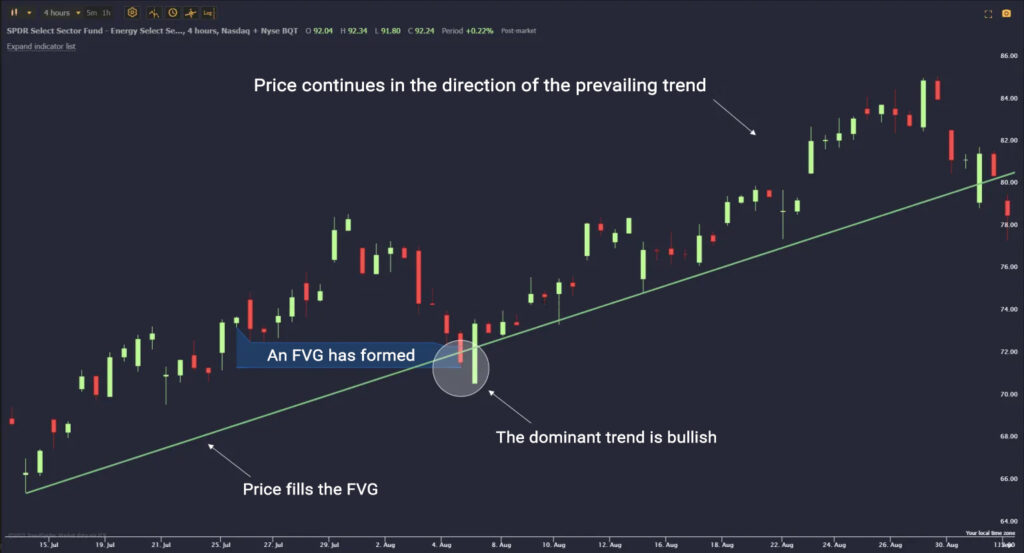
One of the simplest yet most effective ways to trade with Fair Value Gaps (FVGs) is to enter a position after the price returns to the gap zone and fills it. This strategy is built around the idea of market imbalance and typically works best when the price is moving in line with the dominant trend. Steps of this strategy:- Identify the FVG zone
First, locate the area between:
- The high of the first candle and the low of the third candle in a bullish move, or
- The low of the first candle and the high of the third candle in a bearish move. This zone represents the Fair Value Gap.
- Wait for the price to return to the FVG At this stage, the market often attempts to “fill” the gap by making a pullback into the FVG zone.
- Confirm the entry
Enter the trade when a confirmation candle forms near or inside the FVG zone, such as:
- a reversal candle,
- an engulfing candle, or
- a candle that signals a break of structure (BOS).
- Set the stop loss
- For long positions: just below the FVG zone.
- For short positions: just above the FVG zone.
- Set the take-profit target
- At the next support or resistance level, or
- Based on a risk-reward ratio such as 1:2 or 1:3.
Combining FVG Zones with Key Support and Resistance Levels
If an FVG zone aligns exactly with an important level, such as a key support or resistance level, its predictive power increases.
In these situations, the FVG zone can become a strong point for entering or exiting a trade, because the price is reacting to both:
- a price gap (imbalance), and
- a historically significant level that has previously caused reactions.
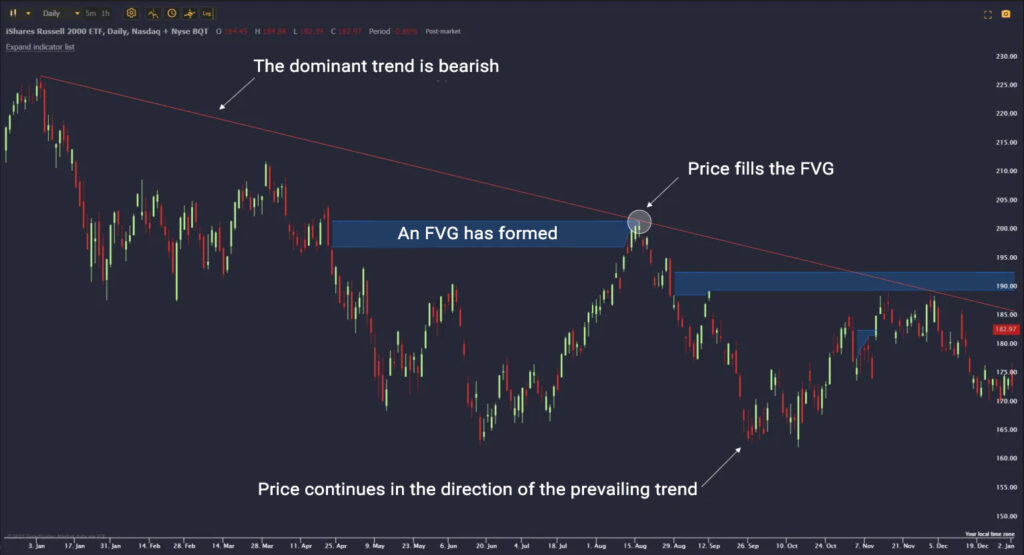
In the example below, an FVG forms along a descending trendline. When price returns to this zone and fills the gap, it resumes the downtrend. This shows how combining an FVG with a trendline can create a strong reversal signal.
Using Technical Confirmations Alongside FVG
Simply identifying an FVG zone is not enough. Professional traders use additional confirmation tools to reduce errors and increase the reliability of their analysis.
Here are three important confirmations:
- Combining FVG with Order Blocks
If an FVG zone overlaps with a significant Order Block (for example, an area where smart money previously entered the market), this confluence becomes a strong signal for a continuation or reversal.
Example:
In an uptrend, if an FVG forms exactly on a bullish Order Block (demand zone), there is a high probability that the price will bounce from that area. - Divergence in Indicators (such as RSI or MACD)
If, near the FVG zone, an indicator like RSI or MACD shows divergence, for instance, price is making lower lows while the indicator is making higher lows, this suggests weakness in the current trend and a potential reversal.
When combined with an FVG, such divergence can generate a much stronger entry signal. - Market Structure Analysis
Before entering a trade based on FVG, you should check whether the overall market structure supports the idea. For example:- Is the market still in an uptrend or a downtrend?
- Has the previous high or low been broken?
- Has there been a clear break in the structure or a trend change?
- This analysis helps you determine whether you are using the FVG setup in the same direction as the broader market, rather than trading against the prevailing structure.
Common Mistakes When Analyzing FVG
A poor understanding or incorrect use of FVG can lead to false signals and significant losses. Below are the main mistakes you need to avoid.
Misinterpreting Imbalance Zones
One of the most common errors is to treat every gap or empty space on the chart as an FVG.
A true Fair Value Gap only forms when the market moves through a price area without trades taking place there, not merely because of a difference between the open and close of candlesticks.
For example, during major news releases or periods of extreme volatility, gaps may appear that have nothing to do with FVGs and are simply the result of rapid price swings.
Relying Too Heavily on FVG Without Confirmation
Identifying an FVG alone should not be the basis for entering a trade.
Entering a position solely because a gap exists without considering trading volume, overall market structure, key support and resistance levels, or confirmations such as order blocks or divergence can lead to high-risk entries and premature exits.
According to letechs, In three-leg market structures (such as CHoCH - Change of Character), a small FVG sometimes forms between the second and third wave, acting as the point where hidden demand breaks through.
Ignoring Market Structure When Analyzing Gaps
For FVGs to be effective, they must be aligned with the broader market structure.
For instance, if the market is in a strong downtrend and you spot a bullish (upward) FVG, you should not go long just because the FVG exists unless there are signs of a potential trend reversal, such as:
- a break of the previous high, or
- a clear change in price behaviour.
Put simply:
- First, determine the direction of the market.
- Then check whether the price is showing any signs of reversal.
- Only after that should you use FVG as part of your decision-making process.
Difference Between FVG and Order Block: Which One Gives More Reliable Signals?
Both Fair Value Gaps (FVGs) and Order Blocks are key concepts in price action analysis and Smart Money–based strategies. Many traders confuse the two because both, in a way, reflect market imbalance. However, their use and the way price behaves around them are quite different.
Comparison of Order Block and Fair Value Gap
| Feature | Order Block | Fair Value Gap (FVG) |
|---|---|---|
| Origin | Sudden entry of large institutional orders at a specific price level | Rapid price movement that leaves a price zone with no trades executed |
| Role in the market | Shows where big players are interested to a specific level | Shows an imbalance and the market’s need to return and fill the gap |
| Price reaction | Price usually rejects this zone strongly | Price may return and either reverse or simply fill the gap and continue |
| Time of formation | After a break of structure and the end of a ranging phase | In the middle of a strong impulse or powerful trend |
| Reliability in trading | Often used as a low-risk entry zone | Used mainly to anticipate reversals or trend continuation |
| Use with other tools | Very strong in combination with market structure, FVG, divergence, etc. | Should ideally be combined with Order Blocks or other confirmations |
Which One Provides More Reliable Signals?
Both are powerful tools, but:
- Order Blocks usually provide more precise and reliable entry signals because they are directly linked to real institutional order flow.
- FVGs play more of a complementary role. When combined with Order Blocks, market structure, or divergence, they can turn into very strong trade signals.
The best results often occur when an FVG zone overlaps with an Order Block. In that case, the probability of a price reversal is significantly higher.
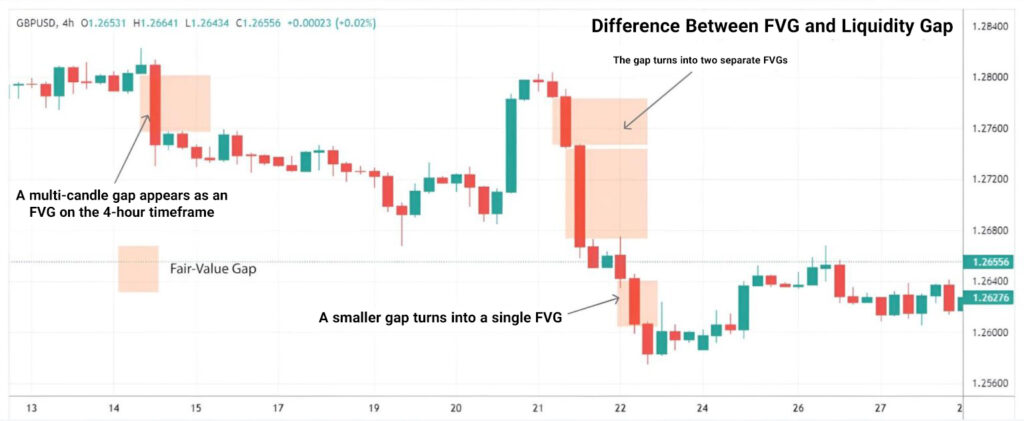
What Is the Difference Between FVG and a Liquidity Gap?
Both FVGs and Liquidity Gaps refer to market imbalance, but they differ in scale, origin, and their role in technical analysis.
A Liquidity Gap (Liquidity Gap or Liquidity Void) is a broader zone where price suddenly jumps or crashes, with virtually no normal trading between the two price levels. These gaps often appear after major news events, large institutional trades, or during low-liquidity hours and signal a strong imbalance between supply and demand.
This means:
- FVG is a smaller, more precise gap that often forms over very short periods and typically aims to correct a limited, local imbalance.
- A Liquidity Gap is more like a “large vacuum” on the chart that may span several candlesticks or even multiple FVGs, and is caused by the absence of buyers or sellers, leading to a sharp price jump.
Comparison of FVG and Liquidity Gap
| Feature | FVG (Fair Value Gap) | Liquidity Gap |
|---|---|---|
| Scale and size | Smaller and shorter-term | Broader and longer-term |
| How it forms | From a specific three-candle pattern | Typically, after major events or heavy institutional orders |
| Main concept | Temporary disruption of price equilibrium | Near-total lack of liquidity between two price levels |
| Price reaction | Market often returns to this gap and fills it | May be filled later and can contain several FVGs inside it |
| Where it is most visible | Lower or mid timeframes | More prominent on higher timeframes (e.g., H4, Daily, Weekly) |
| Relationship between them | Each FVG can be part of a Liquidity Gap | Each Liquidity Gap may contain multiple FVGs |
Conclusion
In short, FVGs (Fair Value Gaps) are one of the core, practical concepts in trading approaches based on price action, SMC, and ICT. These zones represent areas of price imbalance that the market often revisits to correct or extend its move.
However, FVGs are most effective when combined with other technical tools such as Order Blocks, overall market structure, and additional confirmations. Only then can FVGs be used as relatively safe, high-probability entry zones.
Sources: Trading.de, TrendSpider


