


Key Points:
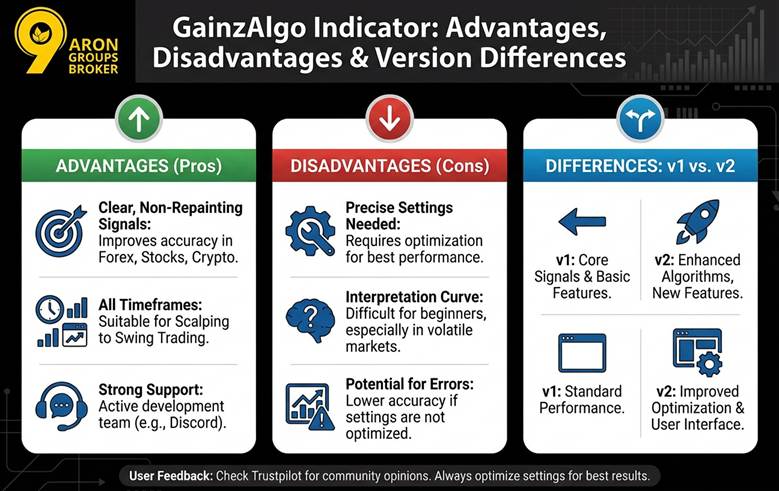
- The GainzAlgo Indicator focuses on stable candlesticks, not just moving averages, unlike many other indicators.
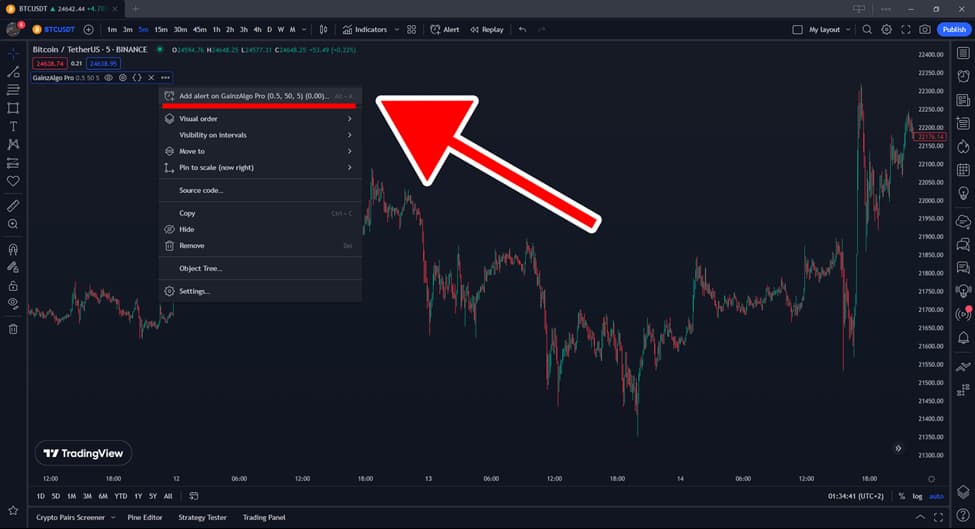
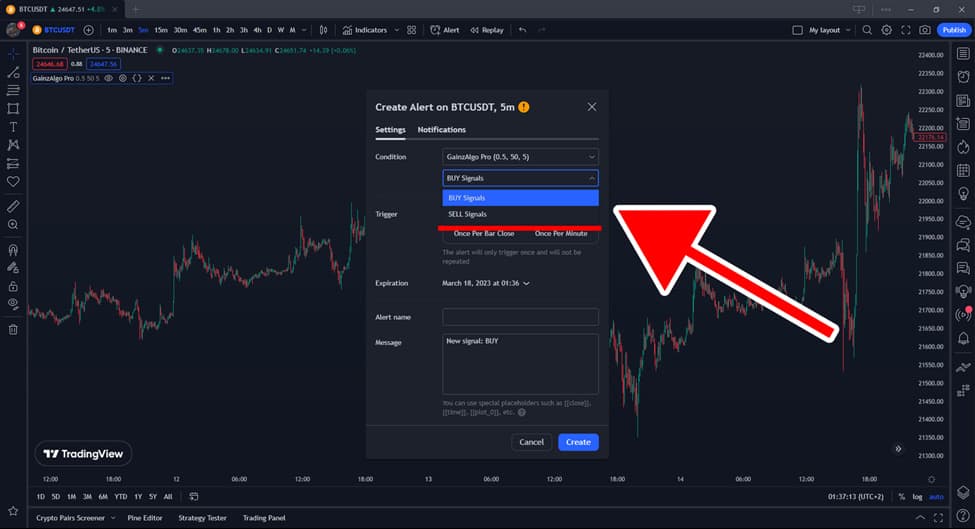
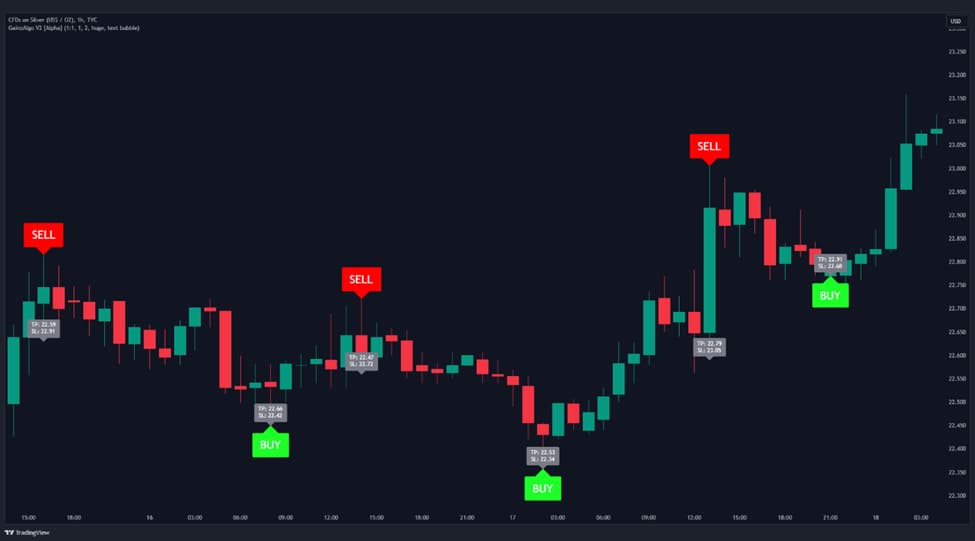
- The GainzAlgo V2 allows automatic TP/SL setting with an internal algorithm, eliminating the need for additional tools.
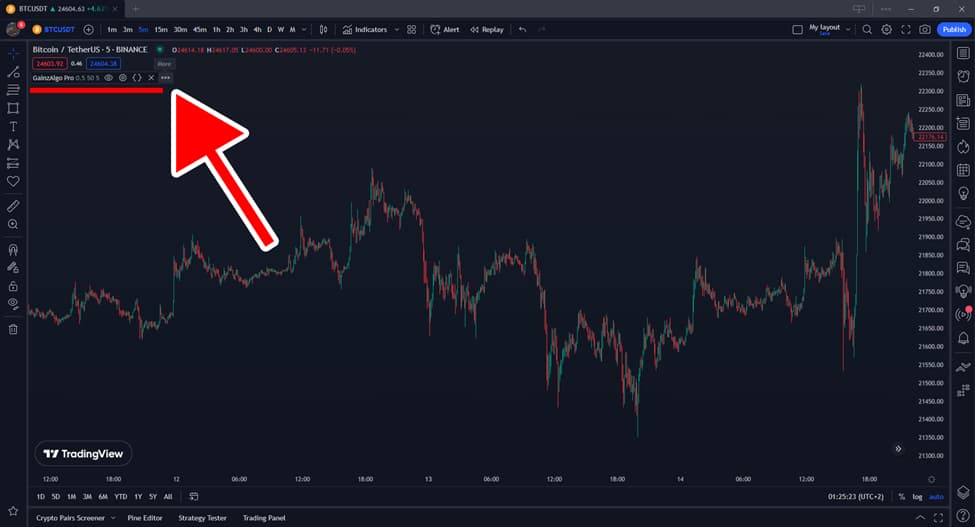
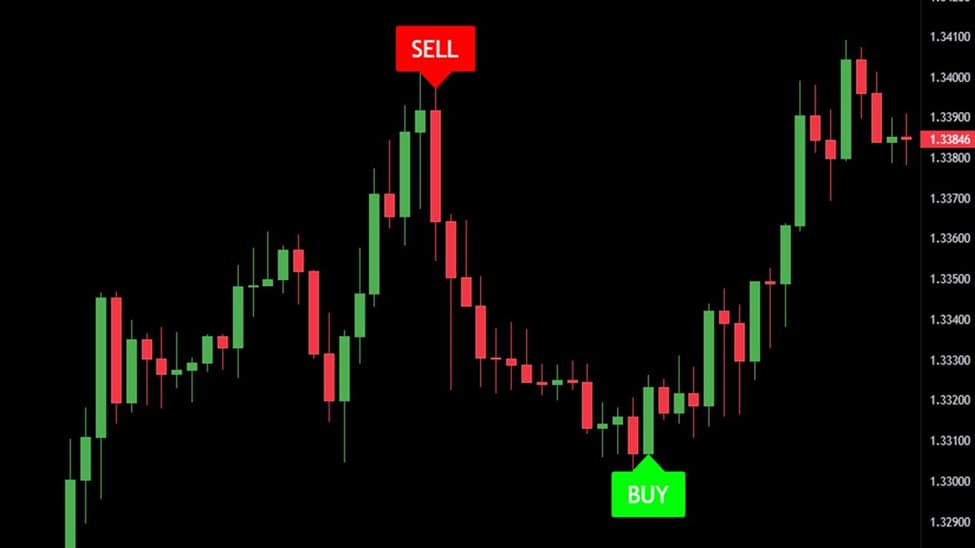
- The GainzAlgo user interface on TradingView, featuring visual signals like arrows and PRZ areas, makes analysis easier for beginners.
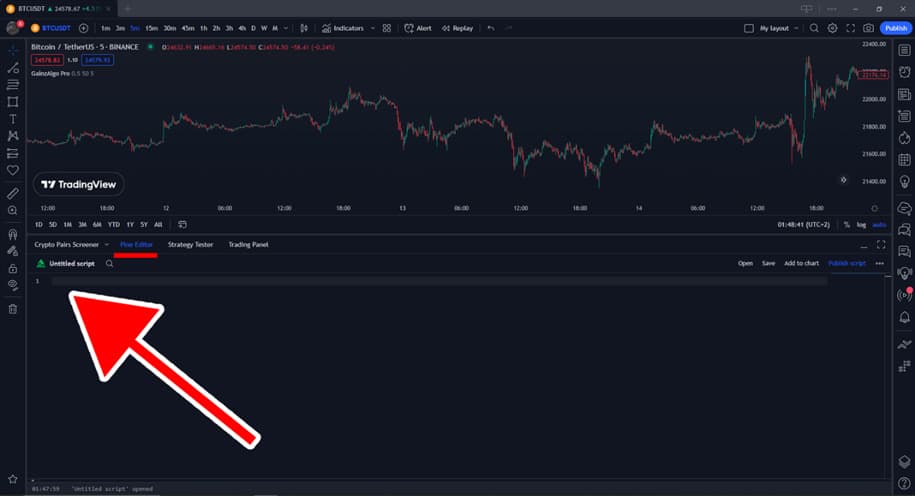
- To access the GainzAlgo indicator script, you need private access. The free version is not available on TradingView’s public market.

Source Box
For detailed technical specifications, pricing of different versions, and user performance reviews, visit the official gainzalgo.com website to get more accurate and comprehensive information about this indicator.
Key Insight
GainzAlgo v2 is designed to filter out market noise and analyze only real trends. In volatile markets like crypto or unstable stocks, its signals are more accurate and targeted.
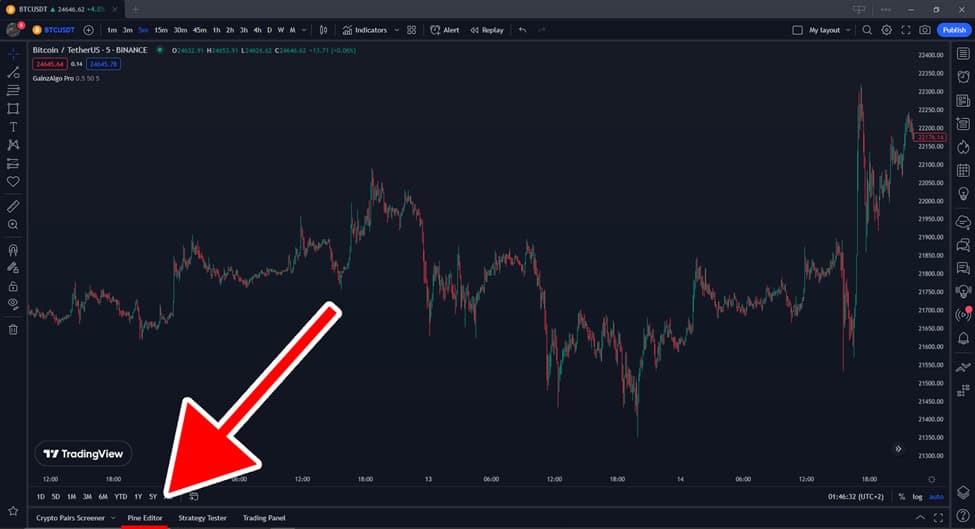
Pro Tip
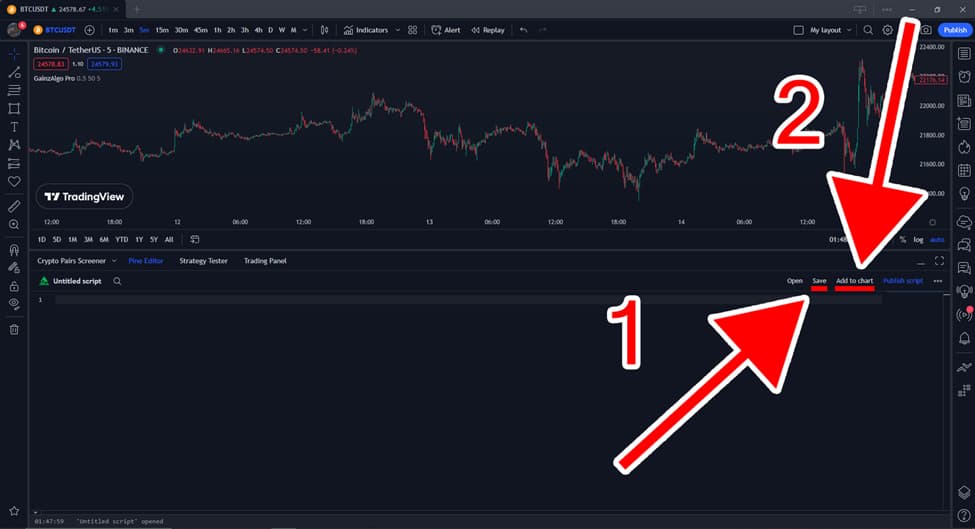
Although the GainzAlgo Indicator requires a purchase or is Invite-Only, the support team usually provides free installation for users. This installation is done directly on your TradingView account, eliminating the need for manual setup.