


The head and shoulders pattern, when correctly identified, can provide traders with highly accurate entry or exit points. This pattern reflects a weakness in the current trend and signals that the market may be ready for a reversal. If you’re looking to gain a deeper understanding of price behavior, learn the precise structure of this pattern, recognize the different types, and understand how to use it practically in markets like Forex and cryptocurrency, make sure to continue reading this article.

- The more horizontal the neckline, the stronger the validity of the breakout. A neckline with a steep slope can lead to more false breakouts.
- The validity of the pattern depends on trading volume and the time frame. An increase in volume at the time of the neckline breakout and a higher time frame provide more credibility to the pattern.
- After the neckline breakout, price typically retraces about 50% of the distance from the head to the neckline. Entering at this level often offers a better risk-to-reward ratio.
- The neckline must be broken with closed candles (not just wicks) for the entry signal to be valid.
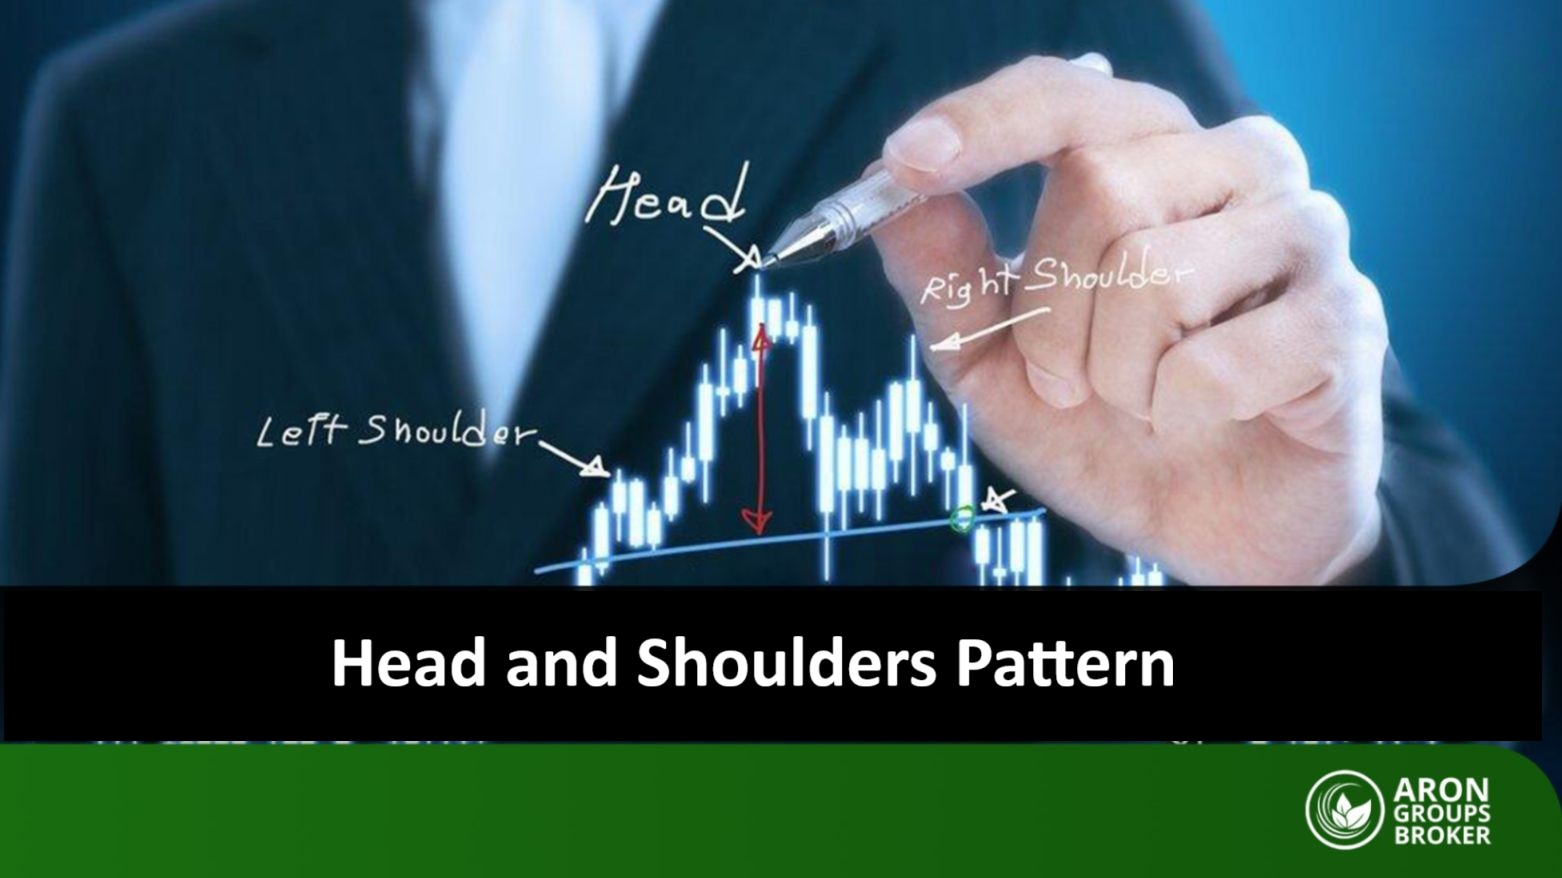
What is the Head and Shoulders Pattern?
The Head and Shoulders pattern is a reversal structure in technical analysis that indicates the end of a trend and the beginning of a price reversal. This pattern consists of three peaks: the left shoulder, the head (the tallest peak), and the right shoulder. Once the right shoulder is formed and the neckline is broken, the probability of a market direction change increases.
In an uptrend, the Head and Shoulders pattern serves as a signal for a downtrend, while in a downtrend, it acts as a reversal pattern indicating an uptrend. This structure reflects the collective behavior of traders and a decrease in the strength of the current trend. It is used to determine the optimal entry or exit points for a trade.
Structure and Components of the Head and Shoulders Pattern
The Head and Shoulders pattern has a defined structure that clearly illustrates the market trend. This pattern forms when the market is no longer capable of continuing the previous trend, and signs of a reversal appear.
To better understand this pattern, its key components are as follows:
- Left Shoulder: An upward wave followed by a slight price correction.
- Head: A peak higher than the left shoulder, representing the market’s last attempt to continue the trend, but after this, the price declines again.
- Right Shoulder: A weaker wave that fails to surpass the head and usually ends at or below the level of the left shoulder.
- Neckline: A line drawn from the lowest points between the left shoulder, head, and right shoulder. The pattern is complete when this line is broken.
A precise understanding of these components helps traders identify the end of a trend earlier and make the right decisions for entry or exit.

If the duration of the right shoulder formation is significantly shorter than that of the left shoulder, it usually indicates an acceleration in trend reversal and a stronger reversal power. This characteristic is seen in patterns with high validity.
Types of the Head and Shoulders Pattern and Their Differences
The Head and Shoulders pattern may seem simple at first glance, but depending on its position on the chart, it can be categorized into several types. Each of these types represents different market behavior, and correctly identifying them is crucial for accurate trend analysis.
- Head and Shoulders Top Pattern;
- Inverse Head and Shoulders Pattern;
- Head and Shoulders Continuation Pattern.
Now, let’s explore the different types of the Head and Shoulders pattern and the differences between them.
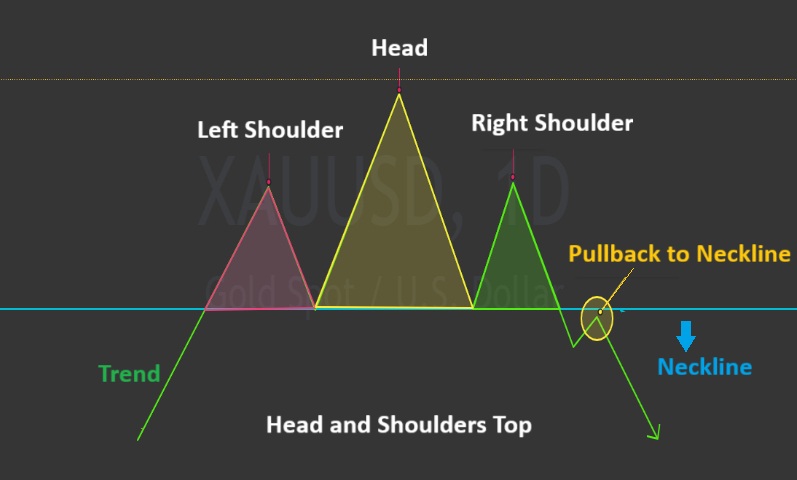
Head and Shoulders Top Pattern
This type of pattern appears at the end of an uptrend and serves as a serious warning for the potential start of a price decline. Initially, the market enters an uptrend, forming the left shoulder. Then, with further upward movement, a higher peak, known as the head, is formed. Afterward, buying power decreases, and the right shoulder, which is usually shorter than the left shoulder, forms. When the price breaks the neckline downwards, the previous uptrend ends, and the selling pressure forces the market into a downtrend. This pattern is highly reliable on daily and weekly timeframes and becomes even more powerful when combined with concepts like support and resistance.
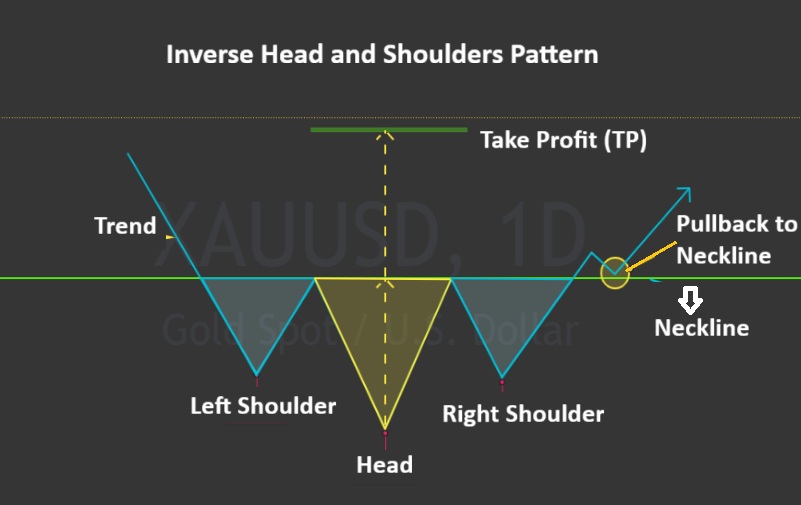
Head and Shoulders Bottom (Inverse) Pattern
On the contrary, this pattern forms at the end of a downtrend and signals a reversal towards an uptrend. Initially, the market creates the left shoulder with a price decline. Then, a deeper drop occurs, forming a valley known as the head. After that, selling pressure decreases, and the right shoulder, which is usually shallower than the left shoulder, forms. When the neckline is broken upwards, the pattern is confirmed, and new buyers typically enter the market. This structure is particularly common in cryptocurrency markets, especially after periods of heavy selling pressure.
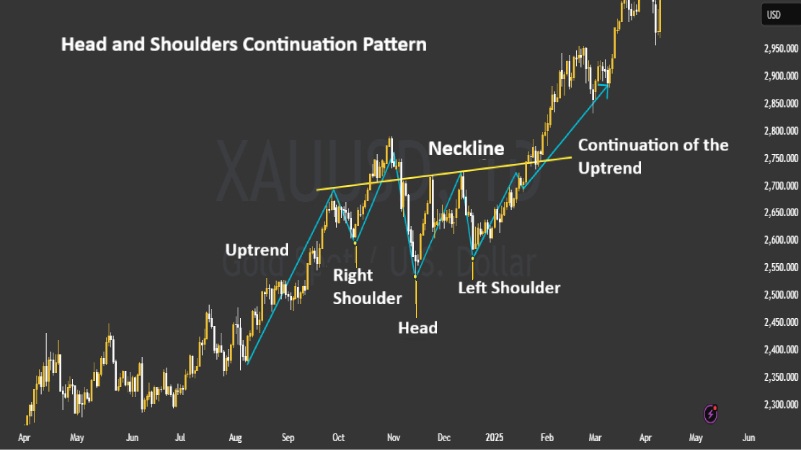
Head and Shoulders Continuation Pattern
Although the Head and Shoulders pattern is primarily known as a reversal structure, in certain cases, it can appear within the main trend and, once completed, continue the previous trend. This type of pattern is more commonly seen in lower timeframes and in combination with patterns such as triangles or wedges. However, its validity is lower than that of a reversal pattern and should not be relied upon solely for decision-making.
Understanding the differences between these structures helps traders read the market more accurately. By combining this knowledge with concepts like support and resistance or double top and double bottom patterns, traders can provide more reliable analysis.
How to Identify and Draw the Head and Shoulders Pattern on a Chart
To accurately draw the Head and Shoulders pattern, the market trend should first be analyzed within a specific time frame.
In the top pattern, three peaks should appear in order: the left shoulder, the head (the highest peak), and the right shoulder, which is at the same level or lower than the left shoulder.
After identifying these three points, the neckline is drawn by connecting the two lows between the shoulders and the head.
In the bottom or inverse pattern, this process happens in reverse; instead of peaks, we deal with troughs, and the neckline is drawn by connecting the two peaks between the troughs.
It’s important to note that accuracy in drawing depends on the relative symmetry between the shoulders and the time gap between them. The more symmetrical these elements are, the higher the validity of the pattern. Using analytical tools like rulers and channels on charting platforms helps to achieve more precise drawings.
Many traders quickly assume that the pattern is forming when they see two peaks or troughs. However, no decision for entering or exiting should be made until the right shoulder is fully formed and the neckline is clearly broken. Early recognition is one of the most common mistakes when working with this pattern.
Validating the Head and Shoulders Pattern with Volume and Timeframe
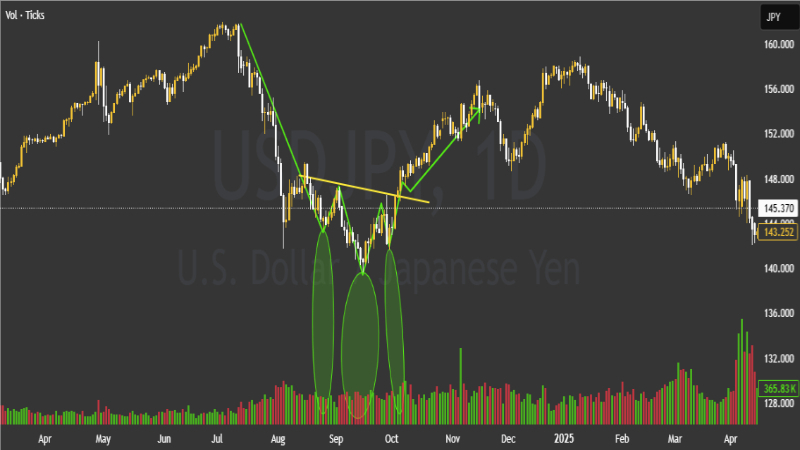
The validity of the Head and Shoulders pattern is not limited to its appearance alone. It must also be examined in conjunction with trading volume and the timeframe to ensure that the market is genuinely prepared for a trend reversal. This step serves as an intelligent filter for the analyst to distinguish the true structure from visual illusions. In a valid pattern, volume is typically high during the formation of the left shoulder and decreases as the head forms. During the right shoulder, volume is lower than both previous stages. However, the critical point is the sharp increase in volume at the time the neckline is broken. This increase indicates that new forces have entered the market, providing confirmation of the breakout.
From a timeframe perspective, the longer the time span, the stronger and more reliable the pattern becomes. For instance, a Head and Shoulders pattern on a daily chart holds more significance than one on an hourly chart. In markets like cryptocurrency, which experience high volatility, choosing the right timeframe aids in a more precise analysis.
Head and Shoulders patterns that form near supply/demand zones on a higher timeframe (HTF) are particularly more reliable, especially when they overlap with other price action patterns such as order blocks or FVG (Fair Value Gaps), making them even more trustworthy.
Determining Entry and Exit Points in the Head and Shoulders Pattern
Entering a trade in the Head and Shoulders pattern requires patience and a definite confirmation of the neckline break. In other words, it is not recommended to enter a trade until the price has fully crossed the neckline, and a closed candle has formed on the other side.
According to Babypips, professional analysts wait for a pullback or a price retracement to the neckline before entering. This movement, also known as the “return to the breakout point,” provides a golden opportunity for a safer entry. Entering without waiting for the pullback carries more risk but may yield higher profits.
Exiting a trade depends on the type of management. Some traders prefer to exit the trade once a predetermined profit target is reached. Others use risk management techniques such as trailing stops to try to maximize profit from the market’s movement as much as possible.
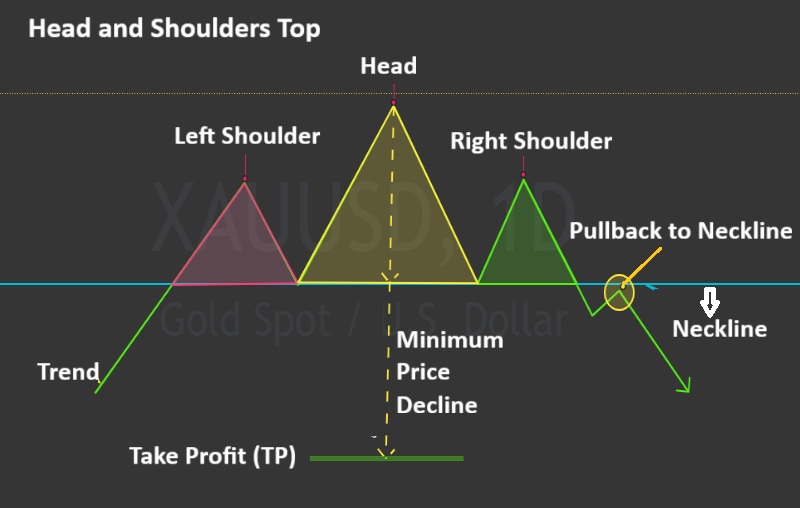
Determining Profit Target and Stop-Loss in the Head and Shoulders Bottom and Top Patterns
In the Head and Shoulders pattern, the profit target is typically determined based on the vertical distance between the head and the neckline. This distance is considered as the price target after the breakout. For example, if the distance between the head and the neckline is 500 units, we expect the price to move at least 500 units in the same direction after the breakout. The stop-loss is usually placed above the right shoulder for the top pattern and below the right shoulder for the bottom pattern. This area is where, if the market reverses and invalidates the breakout, the trade should be exited.
Alongside this traditional structure, some advanced traders employ dynamic risk management techniques. For example, by analyzing support and resistance levels or considering trading volume during the retracement, they adjust their stop-loss to maintain trade security while allowing enough breathing room for price fluctuations.
Advantages and Disadvantages of the Head and Shoulders Pattern
According to Investopedia, The Head and Shoulders pattern, like any other analytical method, has its own advantages and limitations. Below, we will explore both the pros and cons of this pattern:
Advantages of the Head and Shoulders pattern include:
- High predictive power for trend reversal: This pattern provides strong signals for potential trend changes, making it a valuable tool for traders.
- Applicability across various markets: It can be used in different markets such as Forex, cryptocurrencies, and stocks.
- Clear and recognizable structure: The pattern’s distinct formation makes it easy for both novice and experienced analysts to identify.
- Can be combined with concepts like support and resistance: Integrating it with other technical analysis concepts enhances the accuracy of the analysis.
- Provides relatively clear entry and exit points: The pattern offers well-defined points for traders to consider entering or exiting positions.
Disadvantages of the Head and Shoulders pattern include:
- Slow formation, requiring patience for the right shoulder to complete: The pattern may take time to form, which can lead to delays in trade opportunities.
- Highly sensitive to false fluctuations, especially in high-risk markets: The pattern may produce unreliable signals in volatile markets.
- Risk of no pullback after the neckline breakout, missing the entry opportunity: After the neckline breaks, there may not be a pullback, resulting in missed entry chances.
- Potential for incomplete pattern formation, leading to false signals: The pattern may sometimes form incompletely, which can lead to incorrect trade decisions.
- Dependence on other confirmations like volume or time frame for validation: The pattern’s effectiveness often requires confirmation through additional indicators such as trading volume or the time frame being used.
Ultimately, the successful use of the Head and Shoulders pattern requires a thorough understanding of its components and practice under various market conditions. A comprehensive analysis, especially in conjunction with supplementary technical analysis concepts, increases the chances of success.
Common Mistakes in Using the Head and Shoulders Pattern
Despite its high reliability in technical analysis, the Head and Shoulders pattern, when used incorrectly, can lead to poor decisions and significant losses. Recognizing common mistakes in the analysis and execution of this pattern plays a crucial role in improving trading accuracy. Below, we outline the most common mistakes traders make when using the Head and Shoulders pattern:
- Premature Pattern Recognition: Many traders, upon observing two similar peaks or troughs, assume that the pattern is forming. However, it can be very risky to enter a trade until the right shoulder is fully formed and the neckline is broken.
- Ignoring Trading Volume: Volume is a key factor in confirming the pattern. If the volume does not increase when the neckline is broken, there may be a risk of market deception, and the previous trend could continue.
- Unrealistic Profit and Stop-Loss Targets: Setting a profit target too far or a stop-loss too close can cause the trade to be closed prematurely or result in a loss due to unrealistic expectations of more profits.
- Disregarding the Appropriate Time Frame: Some traders identify the pattern in unstable time frames without considering the main chart’s time frame, which reduces the pattern’s credibility.
- Using the Pattern Independently without Other Confirmations: Entering a trade solely based on the Head and Shoulders pattern, without considering support and resistance or comparing it with complementary patterns like triangles or double tops and bottoms, can lead to incomplete analysis.
In conclusion, paying attention to these mistakes and avoiding rush decisions helps traders utilize the Head and Shoulders pattern more accurately and reduces the risk of incorrect analyses.
Conclusion
In Forex trading and other financial markets, profitability is not solely the result of accurate predictions, but rather the outcome of a deep understanding of recurring structures and hidden signals in price behavior. The Head and Shoulders pattern, beyond being a classic chart formation, represents a map of the shifting power dynamics between buyers and sellers. If you can understand this silent language of the market, you will notice opportunities that many traders may fail to recognize.


