The High Minus Low Indicator is a simple, powerful tool for assessing market volatility. According to Investopedia, it measures the difference between the highest and lowest prices of an asset, such as a stock or currency. It acts like a price fluctuation thermometer, helping traders identify market opportunities. This article provides a step-by-step guide to calculating and using the indicator. It also covers its applications and limitations. Whether you’re new to trading or want to understand market movements better, this guide will help you navigate the markets with ease.
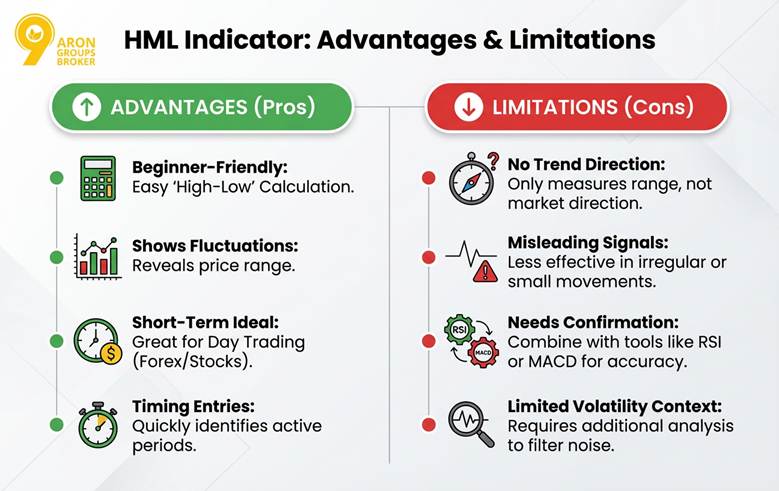
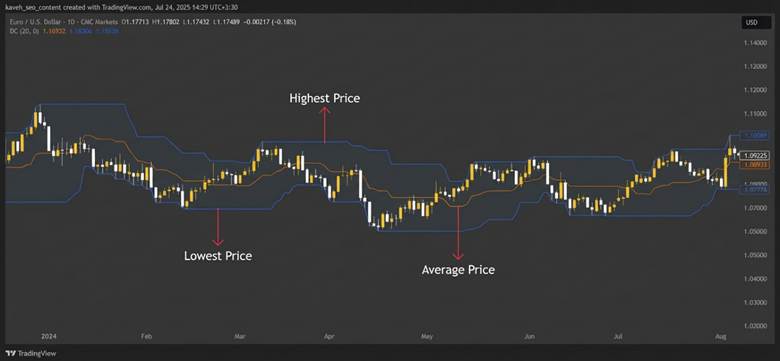
- The High Minus Low Indicator is simple to use, making it ideal for beginners to assess high-low indicator trading quickly.
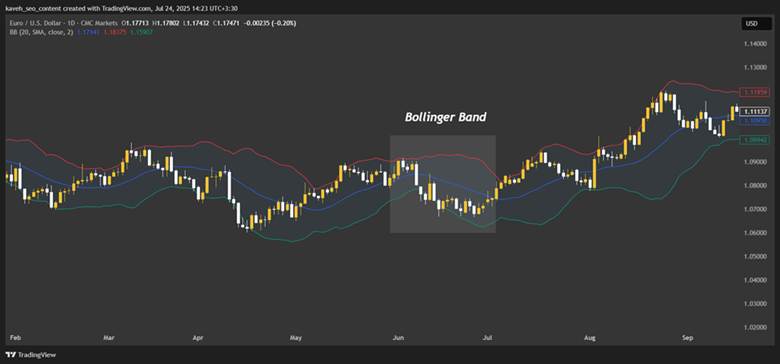
- It offers less trend insight than Bollinger Bands but is excellent for fast decisions, especially when comparing High Minus Low vs Bollinger Bands.
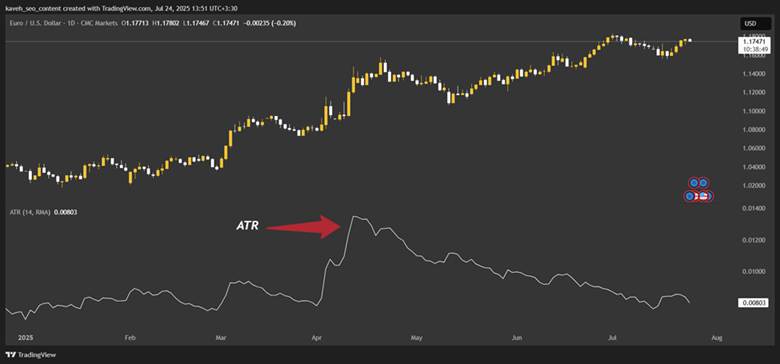
- Combining the High Minus Low Indicator with tools like RSI improves analysis and reduces false signals when measuring market volatility.
- Choose the right time frame (hourly or daily) based on your trading style to optimize the High Minus Low formula.
What is the High Minus Low Indicator and How Is It Used in Technical Analysis?
The High Minus Low Indicator is a simple technical analysis tool that helps traders understand price volatility. It calculates the difference between the highest price (High) and the lowest price (Low) within a specific time period. This shows the extent of price movement.
According to StockCharts, the High Minus Low Indicator appears as a line on the chart. If this line rises, it means the price range is increasing, and market volatility is rising. If the line falls, the market is calming down.
This indicator helps identify market volatility, spotting overbought or oversold conditions, and predicting trend reversals. For example, in forex trading, a sharp increase in the High Minus Low Indicator may signal the start of a strong trend. In stocks, it helps traders decide when to enter or exit trades. Unlike oscillators, which focus on trend momentum, this indicator measures price range, making it easy to understand.
Q: How can traders use the High Minus Low Indicator to identify potential market breakouts?
Answer: Traders can monitor sudden spikes in the HML line. A sharp increase in the daily price range may signal an emerging breakout, allowing traders to prepare for strong short-term movements. Combining this with volume analysis can improve the reliability of breakout signals.
Pro Tip
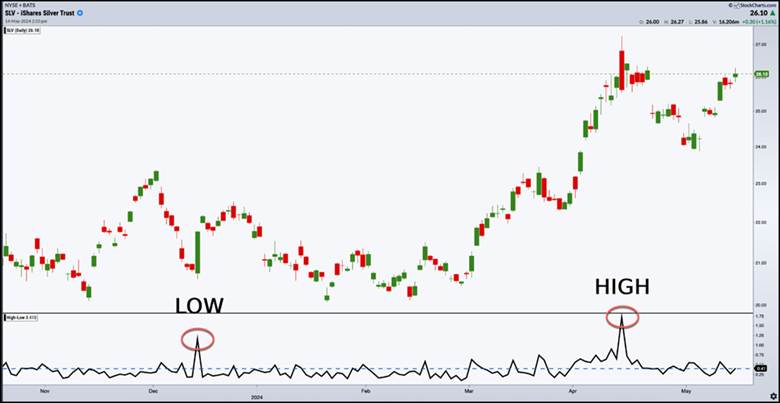
You can use the High Minus Low Indicator to find volatile markets for scalping. Higher volatility typically provides more quick-profit opportunities.
Difference Between the High Minus Low Indicator and the ATR Indicator
Both the High Minus Low Indicator and the ATR Indicator are used for measuring market volatility, but they work differently. The High Minus Low Indicator calculates the difference between the highest (High) and lowest (Low) price of an asset. This calculation is done within a specific time period, such as one day.
This calculation, known as the high minus low formula, shows the price movement for that period, but it does not account for gaps between trading days. This makes it effective for high low indicator trading and identifying daily range indicator fluctuations.
In contrast, the ATR Indicator is more complex. Developed by J. Welles Wilder, the ATR Indicator accounts for the price gap between days. It compares the difference between high and low, the gap between high and previous close, and the gap between low and previous close. Then, it averages these values to calculate the true range.
This makes the ATR Indicator better for managing stop-loss and take-profit levels in longer trades or volatile markets. When comparing high minus low vs atr, the ATR offers a more comprehensive volatility measure. The high minus low strategy works well for quick analysis, while the ATR is better for precise risk management.
Difference Between the High Minus Low Indicator and Bollinger Bands
The High Minus Low Indicator measures price volatility by calculating the difference between the highest and lowest price in a time period, like one day. It appears as a line on the chart, showing the price range.
It is ideal for short-term trading and detecting rapid price changes. However, it doesn’t provide insights into market trends or average prices, focusing only on the price range.
On the other hand, Bollinger Bands consist of three lines:
a simple moving average (usually 20 periods) as the middle line, and two bands above and below. These bands are calculated using standard deviation.
They expand or contract based on market volatility. According to Investopedia, Bollinger Bands help identify overbought conditions (near the upper band), oversold conditions (near the lower band), and detect long-term trends.
The High Minus Low Indicator shows the price range. Bollinger Bands provide a broader market view using moving averages and standard deviation. For quick analysis, the High Minus Low Indicator is better, but for complex, long-term strategies, Bollinger Bands are more suitable.
Key Insight
The High Minus Low Indicator, which focuses solely on the price range, can serve as a complementary tool to confirm signals from Bollinger Bands during breakouts at the upper or lower bands.
Difference Between the High Minus Low Indicator and the Donchian Channel Indicator
The Donchian Channel uses the highest and lowest prices over a specific period to create three lines. These lines include:
- The highest price,
- The lowest price,
- and their average.
The Donchian Channel is used to identify price breakouts and long-term trends. A price movement outside the channel’s boundaries signals potential buy or sell opportunities.
In contrast, the HML indicator calculates the difference between the highest and lowest prices within a specific timeframe. It focuses on short-term market movements, helping traders assess daily price fluctuations.
The key difference between the two indicators lies in their structure and application. The High Minus Low Indicator analyses daily price changes and short-term volatility. The Donchian Channel identifies long-term trends and breakouts.
Therefore, the High Minus Low Indicator is better for short-term traders, while the Donchian Channel is more suited for medium- to long-term trend analysis.
How to Calculate the High Minus Low Indicator (HML)
As mentioned earlier, the High Minus Low (HML) Indicator calculates the difference between the highest and lowest prices over a specific time period. According to StockCharts, The formula is as follows:
HML = High – Low
In this formula, High represents the highest price and Low represents the lowest price in the selected time period. The HML Indicator simply measures price volatility and is ideal for short-term analysis. It helps identify periods of high or low volatility. Higher HML values indicate greater price volatility, while lower values suggest a more stable market.
For example, if during a trading day the highest price is $60 and the lowest price is $45, the calculation would be:
HML = 60 – 45 = 15
This result shows the price range for that specific day.
Q: How can traders improve the accuracy of the High Minus Low Indicator for active market analysis?
A: Traders can calculate HML not just for a single period, but as a rolling average over multiple consecutive periods. For example, using a 3-day or 5-day rolling HML smooths out sudden spikes and highlights consistent volatility trends. This calculation can also be customized based on trading style and time frame: day traders might use hourly HML, while swing traders may prefer daily or multi-day HML. By doing so, the signals become more reliable, actionable, and less prone to being distorted by isolated price swings.
Advantages and Limitations of the High Minus Low Indicator
The HML Indicator is appealing to beginners due to its easy calculation. The high minus low formula shows price fluctuations. It’s ideal for high low indicator trading in short-term trades like day trading in forex or stocks. The daily range indicator can quickly identify active market periods, making it useful for trade entry timing.
However, the HML Indicator has limitations. It only measures the price range and doesn’t predict market direction or long-term trends. In markets with small, irregular price movements, it may give misleading signals. To improve accuracy, combine the High Minus Low Indicator with tools like RSI or MACD. This reduces errors from sudden, meaningless price changes, improving measuring market volatility and analysis.
Warning
The High Minus Low Indicator may generate unstable signals in low-liquidity markets due to irregular volatility. Therefore, it should be used with caution in such markets.
| Advantages | Limitations |
|---|---|
| Easy and quick to calculate | Only shows price range and cannot predict market trends |
| Suitable for short-term trades like day trading | Cannot simulate long-term market trends |
| Helps quickly identify active market periods | May give misleading signals in markets with small volatility |
| Useful in markets like forex and stocks | Needs to be combined with other indicators for better accuracy |
Conclusion
The High Minus Low Indicator is a practical, easy-to-use tool for tracking market price volatility. It is especially valuable for short-term traders. The indicator calculates the difference between high and low prices, helping you understand market dynamics. While it doesn’t tell the full market story, combining it with RSI or moving averages strengthens decision-making. This combination reduces errors from misleading price movements, offering better insights for traders.