


Technical analysis is most effective when the tools used can simultaneously reveal price behavior, trend strength, and potential reversal points. The Ichimoku indicator is specifically designed with this goal in mind. It provides a comprehensive view of market balance and imbalance, rather than offering a single perspective.
The Ichimoku indicator is not just a technical tool; it’s a complete analytical framework. By utilizing five key components, it enables real-time assessment of trend structure. In this article, we will explore how to read, interpret, and strategically use this powerful tool. So, join us as we delve deeper into the world of the Ichimoku trading strategy.

- The Ichimoku Cloud combines several indicators to provide a comprehensive view of market trends, support and resistance levels, and trading signals.
- Developed by Goichi Hosoda in the 1960s, this analytical system remains one of the most popular tools among professional traders.
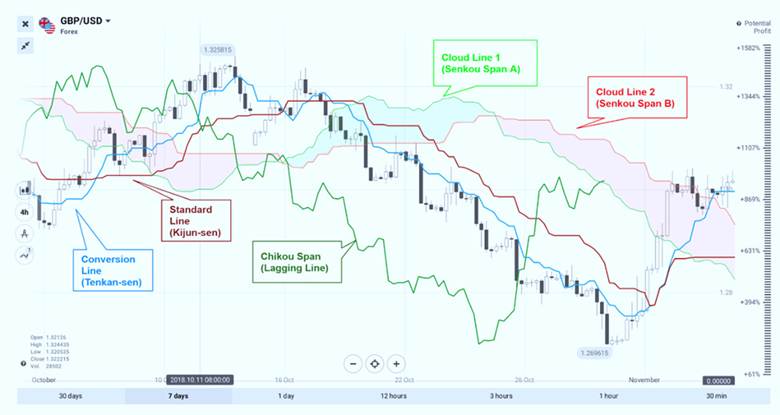
- The main components of the Ichimoku Kinko Hyo include the Tenkan Sen (conversion line), Kijun Sen (base line), leading lines (Senko Span), and the lagging span (Chikou Span).
- The Ichimoku Cloud not only identifies the market direction but also acts as a dynamic support and resistance area, helping traders make informed decisions.
What is the Ichimoku Indicator?
The Ichimoku indicator, also known as Ichimoku Kinko Hyo, is a comprehensive technical analysis tool developed by Goichi Hosoda, a Japanese journalist, in the 1960s. The term “Ichimoku” translates to “one look” in Japanese, and “Kinko Hyo” means “balance at a glance.” This reflects the primary goal of the Ichimoku indicator, which is to provide a quick and complete overview of market conditions with just one look at the chart.
According to an article on Investopedia, the Ichimoku indicator was designed to identify trends, support and resistance levels, and market momentum. Its ability to integrate multiple aspects of technical analysis into a single system has made it one of the most popular tools among traders.
Hosoda spent over 30 years refining and testing this system before introducing it to the world in 1969. Interestingly, Hosoda initially tested the Ichimoku Kinko Hyo using candlestick charts, which have since become one of the most widely used chart types in technical analysis. By combining mathematical principles, market psychology, and price action, he created a system that not only identifies market trends but also predicts the strength of these trends and potential reversal points.
Often referred to as the Ichimoku Cloud, this indicator was originally developed for analyzing the Japanese stock market, but it is now widely used across various markets, including Forex, cryptocurrency, and commodities. The Ichimoku indicator consists of five main lines or components that work together to provide information on trend direction (whether bullish or bearish), the strength of price movement, and key support and resistance levels.
The Ichimoku Cloud is particularly attractive to traders seeking an all-in-one tool, as it not only offers historical data but also provides a forward-looking perspective, helping to forecast future market movements.
Components of the Ichimoku Indicator and How to Calculate Them
The Ichimoku indicator is a comprehensive technical analysis system consisting of five key components. These elements work in harmony to help traders identify market trends, support and resistance levels, and trading signals. Understanding the calculation formulas for these components will allow you to use this tool professionally in online trading.
Tenkan Sen (Conversion Line)
The Tenkan Sen, or Conversion Line, is the first component of the Ichimoku indicator and acts as a key support and resistance indicator. This line is calculated by averaging the highest high and the lowest low over a short time period (usually 9 periods). The Tenkan Sen is primarily used to identify reversal signals and analyze short-term trends. When the price is above the Tenkan Sen, the likelihood of an upward trend is high, while when the price is below this line, a bearish trend is more probable.
Tenkan Sen Calculation Formula:


The Tenkan Sen acts like a speedometer, capturing the rapid changes in the market. When this line moves upwards or downwards, it indicates a bullish or bearish trend, respectively. If the Tenkan Sen is horizontal, it signals that the market is in a range-bound state, with no clear trend.
Kijun Sen (Base Line)
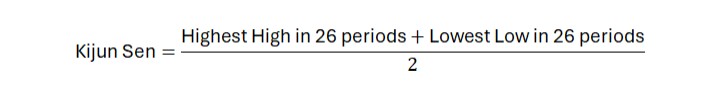
The Kijun Sen, or Base Line, is used to determine long-term trends and identify support and resistance levels. This line is calculated by averaging the highest high and the lowest low over a longer time period (usually 26 periods). The Kijun Sen serves as an important tool for confirming or rejecting trend changes in the Ichimoku indicator. If the Tenkan Sen crosses above the Kijun Sen, it can be seen as a signal to buy or sell. Additionally, when the price is above the Kijun Sen, the market is in an uptrend, and when the price is below it, the market is in a downtrend.
Kijun Sen Calculation Formula:
Chikou Span (Lagging Span)
The Chikou Span, or Lagging Span, is another important component of the Ichimoku indicator that helps analyze past price trends. This line shifts the current closing price 26 periods back and is used to identify the effect of the trend on price and to establish an overall market view. When the Chikou Span is above past prices, it signals a bullish trend, while when it is below past prices, it signals a bearish trend.
Senkou Span A & Senkou Span B (Leading Lines)
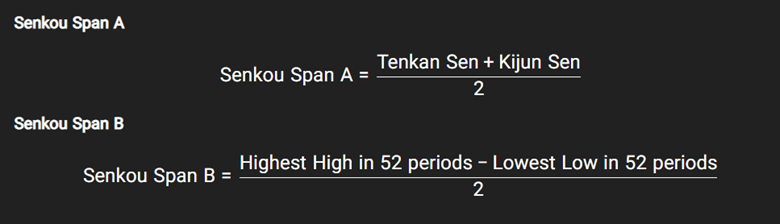
The two lines, Senkou Span A and Senkou Span B, which form the edges of the Ichimoku Cloud (also known as Kumo), act as advanced support and resistance levels. These lines are plotted 26 periods ahead of the price, helping to predict potential support and resistance areas. In fact, the Ichimoku Cloud acts like a weather forecast for the market, indicating safe (support) and dangerous (resistance) zones.
The Senkou Span A is calculated as the average of the Tenkan Sen and the Kijun Sen, while the Senkou Span B represents the average of the highest high and lowest low over a 52-period span. These two lines form the Ichimoku Cloud, which helps in better identifying the market trend. A price breaking above or below the cloud can provide important signals for entering or exiting the market.
How to Interpret the Ichimoku Indicator
A proper understanding of the Ichimoku indicator structure becomes meaningful when we know how its components interact simultaneously to describe the trend, market strength, and key decision-making points. In this section, we will explain how to interpret the signals generated by the Ichimoku indicator.
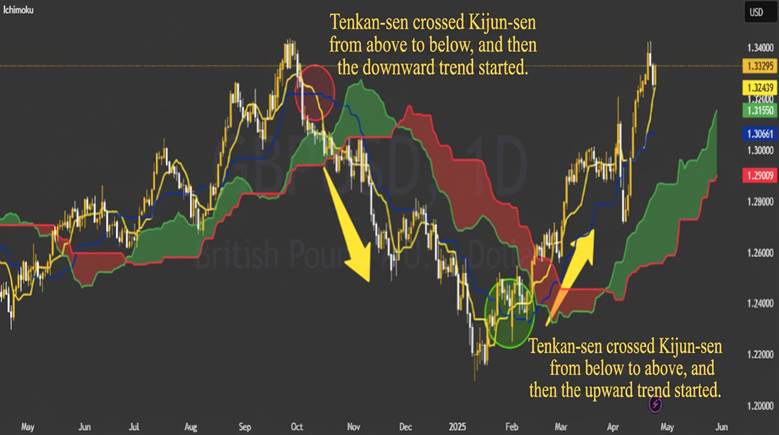
Tenkan Sen and Kijun Sen Crossover
One of the most important ways to interpret the Ichimoku indicator is by examining the crossover between Tenkan Sen (Conversion Line) and Kijun Sen (Base Line), which provides short-term and medium-term signals:
- Bullish Signal: When the Tenkan Sen crosses above the Kijun Sen, it signals the start of an uptrend. This signal is stronger when the price is above the Ichimoku Cloud.
- Bearish Signal: When the Tenkan Sen crosses below the Kijun Sen, it signals a downtrend. This signal is stronger when the price is below the Ichimoku Cloud.
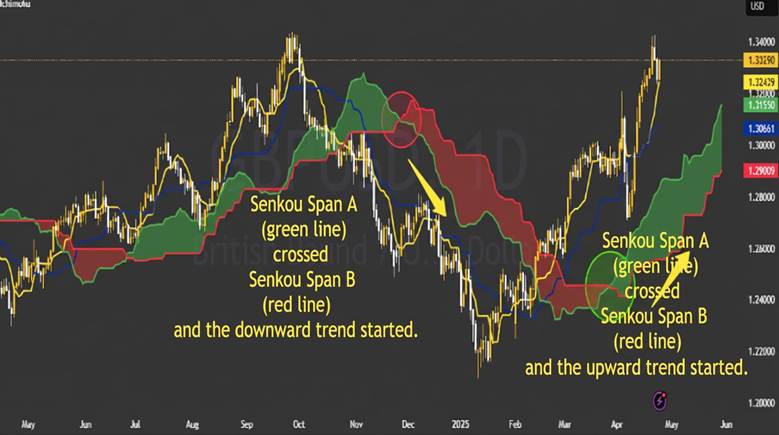
Senkou Span Crossovers
The crossover between Senkou Span A and Senkou Span B, which form the Ichimoku Cloud, is used to predict long-term trends:
- Bullish Crossover: When Senkou Span A crosses above Senkou Span B, the Ichimoku Cloud changes from red to green, indicating the beginning of an uptrend.
- Bearish Crossover: When Senkou Span A crosses below Senkou Span B, the cloud turns red, indicating the start of a downtrend.
Role of Chikou Span
The Chikou Span (Lagging Span) is used for trend confirmation and identifying potential reversal points:
- When the Chikou Span is above the price chart, the trend is bullish.
- When the Chikou Span is below the price chart, the trend is bearish.
- When the Chikou Span is near or inside the price chart, the market is neutral.
Ichimoku Cloud Analysis
The Ichimoku Cloud, formed by the space between Senkou Span A and Senkou Span B, acts as a dynamic support and resistance area in the Ichimoku indicator:
- Price above the Cloud: This indicates an uptrend, with the cloud acting as support. Traders can look for buying opportunities in this situation.
- Price below the Cloud: This indicates a downtrend, with the cloud acting as resistance. This position is suitable for selling opportunities.
The standard numbers of the Ichimoku indicator (9, 26, 52) are derived from the Japanese calendar and the natural cycles of the market. These numbers align interestingly with Fibonacci ratios in price cycles, a harmony that can be extremely valuable for technical analysts.
Ichimoku Trading Strategies
In this section, we will explore Ichimoku trading strategies that help traders make better decisions in the financial markets using this powerful tool.
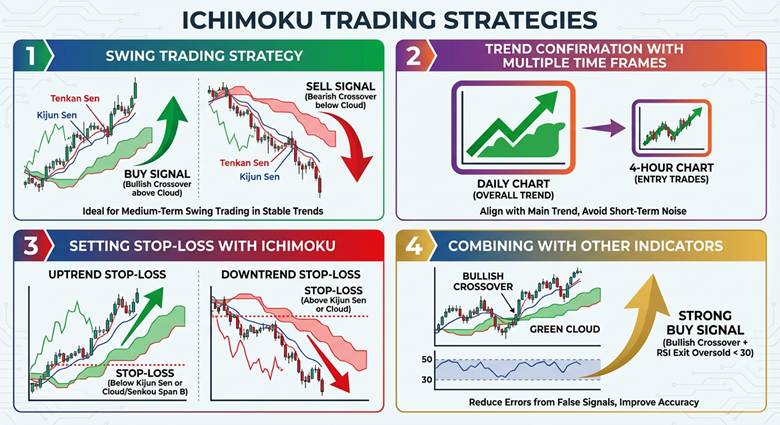
Swing Trading Strategy with Ichimoku
One of the most popular methods is the Ichimoku strategy for swing trading. In this approach, the combination of the Tenkan Sen and Kijun Sen crossover signals, along with the price’s position relative to the Ichimoku Cloud, is used. A bullish crossover (where Tenkan Sen crosses above Kijun Sen) above the green cloud provides a strong buy signal. Conversely, a bearish crossover below the red cloud signals a sell opportunity. This strategy is ideal for medium-term swing trading in stable trends.
Trend Confirmation with Multiple Time Frames
To reduce errors, use the Ichimoku indicator with a multi-timeframe approach. For example, assess the overall trend on a daily chart and enter trades on a 4-hour chart. This method helps you stay aligned with the main market trend and avoid short-term noise.
Setting Stop-Loss with Ichimoku
In the Ichimoku trading strategy, stop-loss can be set using Kijun Sen or the Ichimoku Cloud. In an uptrend, place the stop-loss below the Kijun Sen or beneath the cloud (Senkou Span B). In a downtrend, place the stop-loss above the Kijun Sen or the top of the cloud. This approach improves risk management.
Combining with Other Indicators
For increased accuracy, combine the Ichimoku indicator with tools like the RSI. For example, if a bullish crossover occurs alongside the RSI exiting the oversold zone (below 30), the buy signal becomes stronger. This combination helps reduce errors from false signals.
Advantages and Disadvantages of the Ichimoku Indicator
The Ichimoku indicator is a versatile tool in technical analysis, with its own set of advantages and limitations. Below, we will explore the benefits and drawbacks of the Ichimoku indicator, helping you make more informed decisions about using this indicator.
Advantages of the Ichimoku Indicator
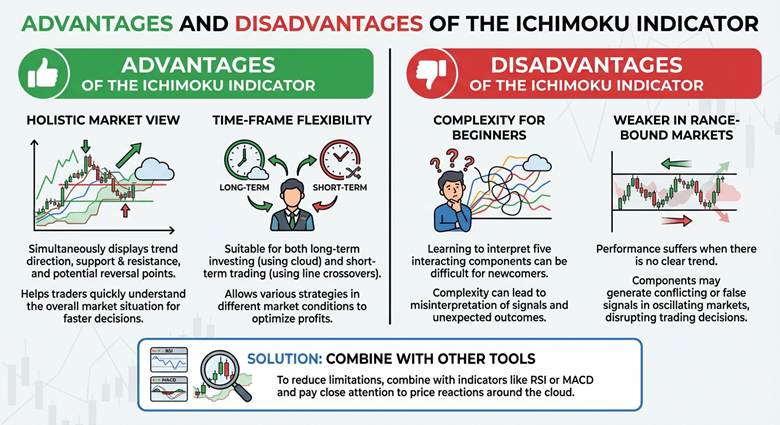
Due to its comprehensive design, the Ichimoku indicator is one of the most popular tools in technical analysis. The first advantage is that it provides a holistic view of the market trend. By combining five key components, it simultaneously displays trend direction, support and resistance levels, and potential reversal points. This feature helps traders quickly understand the overall market situation and make faster trading decisions.
The second advantage is its time-frame flexibility. The Ichimoku indicator is suitable for both long-term investing (using Senkou Span B and the cloud) and short-term trading (by analyzing the Tenkan Sen and Kijun Sen crossovers). This versatility allows traders to use various strategies in different market conditions, optimizing their profits and minimizing losses.
Disadvantages of the Ichimoku Indicator
Despite its significant benefits, the Ichimoku indicator also has some limitations. The first challenge is its complexity for beginners. Learning to interpret the five components and understanding how they interact with price can be difficult for newcomers. This complexity can sometimes lead to misinterpretation of signals and increase the likelihood of unexpected gains or losses.
The second limitation is the Ichimoku indicator’s weaker performance in range-bound markets (where there is no clear trend). In situations where the price is oscillating within a fixed range, components such as the cloud or line crossovers may generate conflicting or false signals. This can disrupt trading decisions and mislead traders.
To reduce these limitations, it is recommended to combine the Ichimoku indicator with other tools (such as RSI or MACD) and always pay close attention to price reactions around the cloud.
Advantages and Disadvantages Table of the Ichimoku Indicator:
| Advantages of the Ichimoku Indicator | Disadvantages of the Ichimoku Indicator |
|---|---|
| Provides a comprehensive view of market trends with just one glance | High complexity for beginners and requires time to learn |
| Suitable for analysis in different time frames (short-term to long-term) | Weak performance in range-bound (no clear trend) markets |
| Generates strong combined signals for entry and exit | False signals in volatile market conditions |
| Can be used in swing trading and other strategies with diverse filters | Relatively slow reaction to sudden price movements |
| Enhances decision-making accuracy by analyzing multiple elements simultaneously | Requires thorough understanding of components and their interactions |
Combining Ichimoku with Other Indicators
While the Ichimoku indicator can be powerful on its own, combining it with other technical analysis tools significantly enhances trading decision accuracy. These combinations help filter out false signals and leverage the best indicators to create advanced strategies.
1. Combining Ichimoku with MACD for Momentum Confirmation
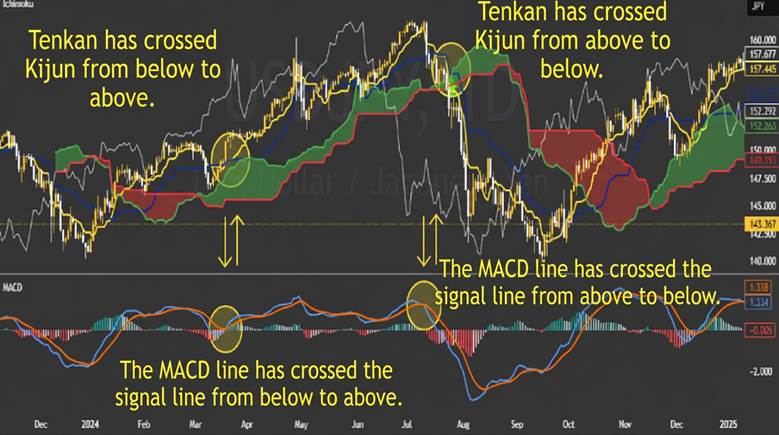
MACD (Moving Average Convergence Divergence) is one of the most popular indicators for identifying market momentum. When you receive a buy signal from the Ichimoku indicator (such as a bullish crossover of the Tenkan Sen and Kijun Sen above the green cloud), you can validate the signal by looking at the MACD. If the MACD line crosses above the signal line and the histogram is expanding, this alignment confirms the bullish trend. Conversely, in a sell signal, a bearish crossover in the MACD and a histogram below zero enhances the strength of the downtrend.
2. Using Bollinger Bands for Volatility Analysis
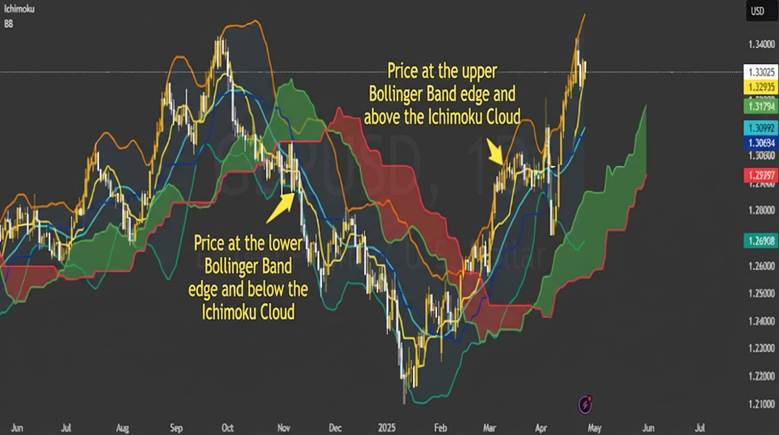
Bollinger Bands are an excellent tool for identifying price volatility and reversal points. Combining them with the Ichimoku indicator helps you get more precise entry and exit signals. For example, if the price reaches the upper Bollinger Band while being above the Ichimoku Cloud, it could indicate the continuation of an uptrend. If the price reaches the lower Bollinger Band and is below the red Ichimoku Cloud, the downtrend may intensify.
3. Combining Ichimoku with RSI
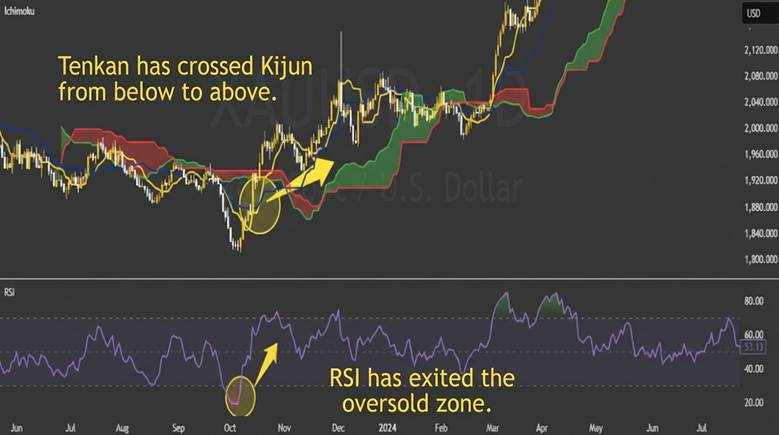
Combining the advanced Ichimoku indicator with the RSI (Relative Strength Index) is an effective strategy for identifying overbought and oversold conditions. Suppose a bullish crossover of the Tenkan Sen and Kijun Sen occurs above the green cloud. If the RSI also exits the oversold region (below 30), this alignment strengthens the buy signal. Similarly, in a sell signal, a bearish crossover of the Ichimoku lines below the red cloud, combined with RSI entering the overbought region (above 70), provides a stronger warning to exit the trade.
How to Activate and Set Up the Ichimoku Indicator in MetaTrader and TradingView
For technical analysts, using precise and customizable tools is essential. One such professional yet complex tool is the Ichimoku indicator, which can easily be activated and set up in popular trading platforms like MetaTrader 5 and TradingView.
Activating Ichimoku in MetaTrader 5
Step 1: Open the MetaTrader 5 platform and select the asset chart you want to analyze.
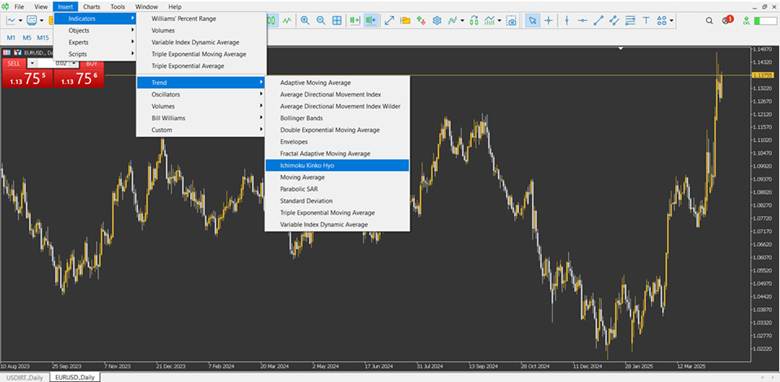
Step 2: From the top menu, select “Insert.”
Step 3: Under the “Indicators” section, choose the “Ichimoku” submenu.
Step 4: The Ichimoku indicator settings window will appear.
Step 5: Click “OK.” The indicator will now be added to your chart.
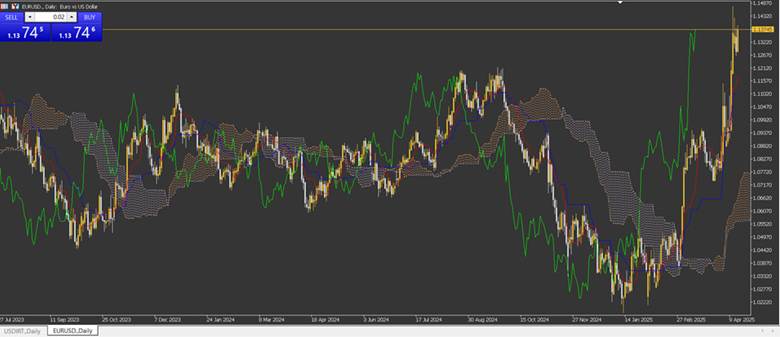
To remove or edit the indicator, right-click on the Ichimoku lines on the chart and select "Delete Indicator" or "Properties of Indicator" as needed.
Setting Up Ichimoku in TradingView
Step 1: Log into the TradingView platform and open the chart you want to analyze.
Step 2: Click on the “Indicators” icon in the toolbar above the chart.
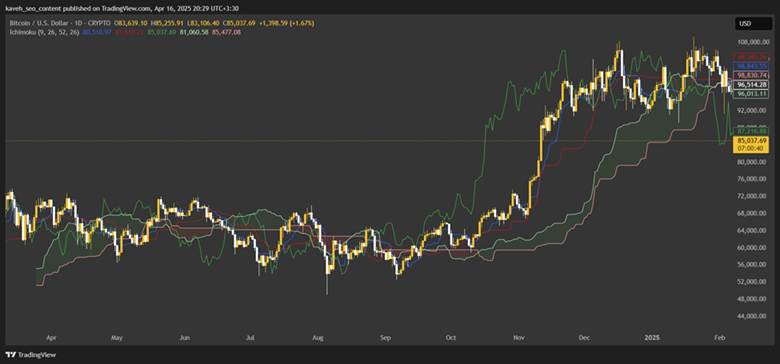
Step 3: In the search box, type “Ichimoku” and select the indicator.
Step 4: The Ichimoku indicator will be automatically added to your chart.
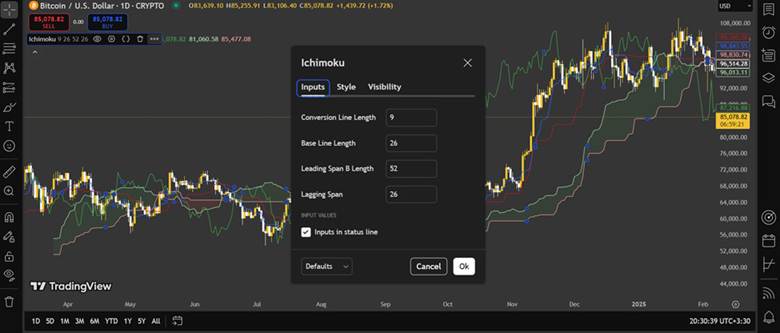
Tip: To adjust settings, click the gear icon next to the indicator’s name. In the “Inputs” section, you can edit parameters, and in the “Style” section, you can change the line colors or the cloud thickness.
By following these steps, you can activate and configure the Ichimoku indicator in both MetaTrader 5 and TradingView. This tool, whether using default or customized settings, will help you identify trends, support and resistance levels, and trading signals. For enhanced productivity, ensure that your settings align with your trading strategy.
Conclusion
Mastering the Ichimoku indicator goes far beyond simply understanding its lines. A proper understanding of the logic behind this tool’s structure and the ability to adapt it to the ever-changing market conditions is what distinguishes professional analysts. The Ichimoku indicator is not just used for trend identification; it enables analysts to quickly assess the market structure, potential entry and exit points, and even the strength of price movement with just one glance.
Although it may seem complex at first, with practice and a thorough understanding of its components, the Ichimoku indicator becomes one of the most precise and strategic tools for trend analysis. In today’s volatile markets, having such a multi-layered tool can provide a significant competitive advantage for any analyst. Now is the time to integrate this tool not just as an indicator, but as a powerful analytical system into your trading strategy.


