


ICT Dealing Range is simply the measuring tape Smart Money traders use: a meaningful high and low that lets you judge whether price is expensive or cheap inside that swing—but how do you pick the right high/low, and why does price so often poke above the range high or dip below the range low before moving properly? In this guide, I’ll show you how to define a dealing range the ICT way, how to use the midpoint (equilibrium) to separate premium and discount, and how to read the most useful footprints inside the range so you’re not guessing.

- An ICT dealing range is the price zone between a meaningful swing high and swing low—used as a framework to measure premium/discount and liquidity objectives.
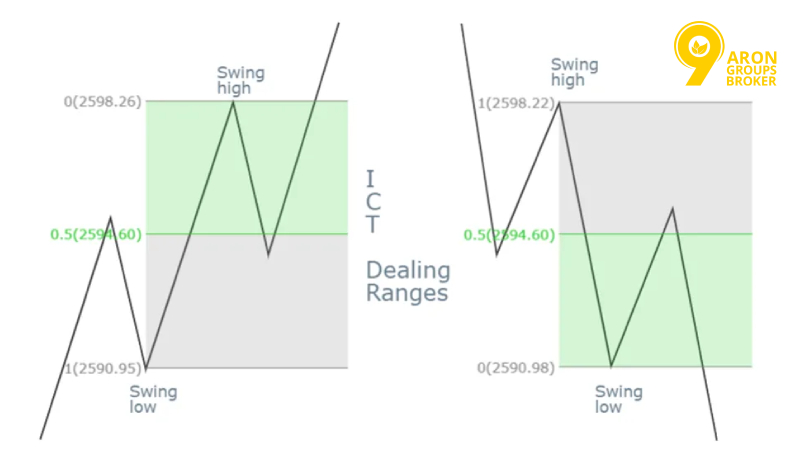
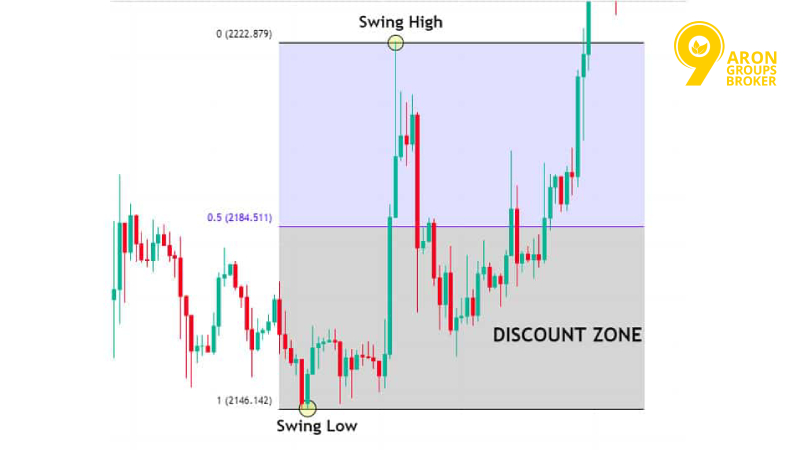
- The 0.50 level is commonly used as the equilibrium (midpoint): above it is a premium, below it is a discount.
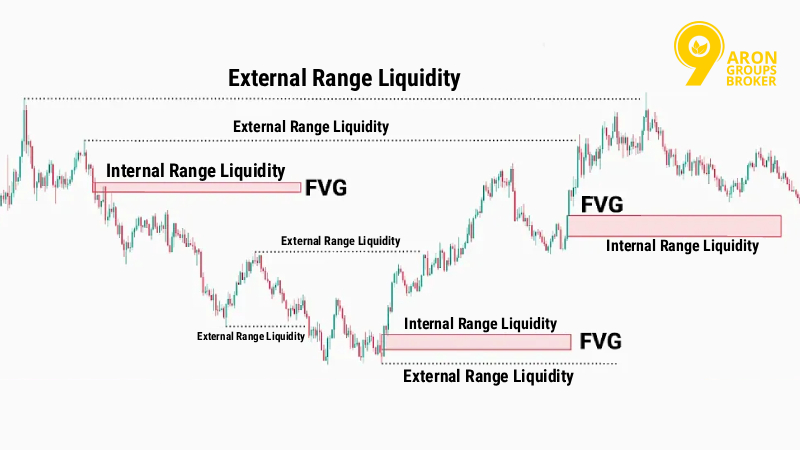
- External range liquidity typically refers to liquidity resting above the range high and below the range low; internal range liquidity is found within the range (often around PD arrays).
- PD Arrays are used like a checklist of institutional-style reference points to refine entries within the dealing range.
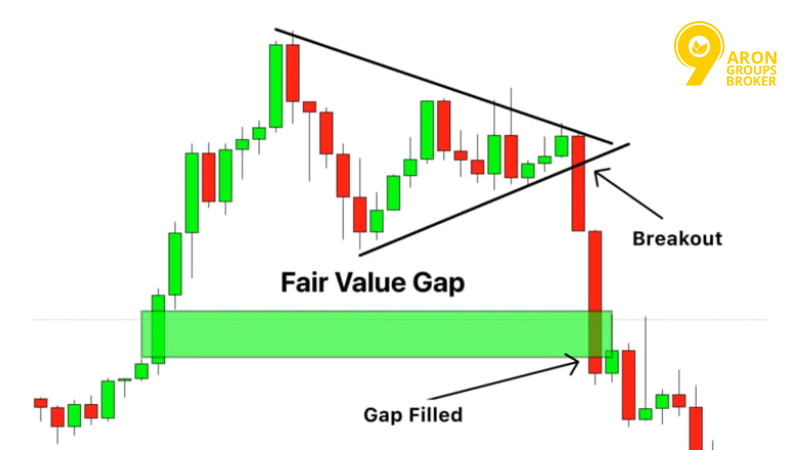
- Order blocks are often described as the last opposing candle (or cluster) before a sharp impulsive move; they matter most when they align with range context.A Fair Value Gap (FVG) is widely explained as a three-candle imbalance/inefficiency that price may later revisit (rebalance).
Get to Know the ICT Dealing Range
Before you look for entries, you need a clean framework. The dealing range gives you that framework by anchoring analysis to one swing high and one swing low, then letting you judge where price sits within that span and what it may be reaching for.

Important:
If your range is drawn from the wrong swing points, every PD array will look tradable. Start with the range, or you’ll end up confirming noise.
What is the ICT Dealing Range Really?
According to TradingFinder, in ICT terms, the dealing range is the price zone between the most recent significant swing high and swing low—a reference range you use to measure price and locate objectives.
Here’s the human version: it’s a structured way to stop saying price is high/low and start saying price is high/low relative to this swing.
How to mark a dealing range (practical and repeatable):
- Pick a clear swing high and clear swing low that the market actually respected (not tiny wiggles).
- Draw your range from low → high (or high → low).
- Immediately mark the midpoint (0.50 / equilibrium).
- Only after that, start looking for internal tools (FVGs, order blocks, etc.).
And one thing people miss: a dealing range is not a sideways market label. It’s a measurement system that can exist even when price is trending—because swings exist in trends too.
How Dealing Range ICT Shows Smart Money Moves
Once your dealing range is set, price action tends to make more sense because you can frame it around liquidity and re-pricing rather than random candle shapes.
What you’ll notice quickly:
- The high and low act like magnets. Many traders place stops beyond these points, so price often probes them. (In ICT language, this is where external liquidity sits.)
- The midpoint stops you chasing. If price is already in premium, the easy long is often late; if price is in discount, the panic short is often late.
- Internal structure becomes readable. Instead of treating every FVG or order block as equal, you can ask: Is this forming in the right part of the dealing range?
Remember:
Smart Money Concepts aren’t about predicting; they’re about filtering. The dealing range is one of the strongest filters you have.
Key Levels in the ICT Dealing Range
A dealing range becomes useful only when you treat it like a map with key landmarks: the high, the low, the midpoint (equilibrium), and the internal/external liquidity ideas tied to those landmarks.
Spotting the Highs and Lows of the ICT Dealing Range
The dealing range high and low are the boundaries of the swing you’re measuring. In most ICT explanations, the range is defined between the high and low of the most recent swing.
A practical way to choose better highs/lows:
- Use swings that are obvious at a glance (if you need to convince yourself, it’s probably not clean).
- Prefer highs/lows that caused a noticeable reaction (sharp move away, not a slow drift).
- Avoid building ranges from the middle of chop—those levels get violated so easily they teach you nothing.
A quick sanity check I use:
- If you can’t explain why stops would sit beyond your chosen high/low, you’ve probably picked the wrong swing.
Understanding the Midpoint and Equilibrium of the ICT Dealing Range
Equilibrium is typically the 0.50 (50%) midpoint of the dealing range. Above it is labelled premium, and below it is a discount in many ICT-style explanations.
How to mark it cleanly (without clutter):
- Draw a Fibonacci retracement across your swing.
- Keep only the 0.50 line visible as your EQ reference.
Now you can classify price location quickly:
- Price above EQ → you’re in premium
- Price below EQ → you’re in discount
Why the Equilibrium Level Matters for Your ICT Dealing Range Trades
EQ matters because it forces discipline in your entries. Without it, most traders do this:
- They buy because price looks strong… right at the top of the range.
- They sell because price looks weak… right at the bottom of the range.
With EQ, you can apply a simple rule-set:
- If you’re looking for longs, you generally want to see price offering you discount conditions relative to the swing.
- If you’re looking for shorts, you generally want to see price offering you premium conditions relative to the swing.
The Habit that changes everything:
Before you click anything, say out loud: Am I trading in the correct half of the dealing range? If you can’t answer that in one sentence, you’re not ready to execute.
Internal vs External Levels in the ICT Dealing Range
In ICT language, external range liquidity is often described as the liquidity resting above the dealing range high and below the dealing range low. Internal range liquidity is found inside the dealing range and can show up around internal reference points (like FVGs).
Here’s the practical distinction:
- External levels (outside the range) are usually about targets and stop clusters.
- Internal levels (inside the range) are usually about entries and reactions.
| Concept | Where it sits | How you use it (in real life) |
|---|---|---|
| External range liquidity | Beyond range high/low | To frame likely objectives and raid areas |
| Internal range liquidity | Within the range | To refine entries around internal reference points |
Smart Money Structures Inside the ICT Dealing Range
Once your dealing range is correct, the tools inside it stop being random indicators and start behaving like decision points. This is where you use PD arrays, order blocks, and FVGs to build a coherent execution plan.
ICT PD Arrays: How They Guide Entries in the Dealing Range
PD Arrays are often described as a Premium/Discount arrangement—a checklist of reference points used to time entries and align with where price sits on the curve.
Inside a dealing range, PD arrays become genuinely useful when you apply them like this:
- Start with location: premium or discount relative to EQ.
- Pick the right tool for the right half: you’re not hunting the same confirmations in premium as you are in discount.
- Demand a reason: if the PD array doesn’t align with your expected draw (target), it’s probably a pretty level rather than a meaningful one.
A simple learning exercise (highly practical):
- Mark one dealing range per day on your instrument.
- Screenshot it.
- On the screenshot, label only: High, Low, EQ, Premium, Discount.
- Then circle only one PD array you would trust most and write why in one sentence.
That one-sentence rule improves your accuracy fast.
Order Blocks and Smart Money Patterns in the ICT Dealing Range
Order blocks are commonly explained as the last opposing candle (or candle cluster) before a sharp impulsive move—bullish OB often being the last bearish candle before a strong rise, and bearish OB the last bullish candle before a strong drop.
Inside a dealing range, here’s how to keep order blocks usable (not decorative):
- Anchor it to a real displacement. If there wasn’t a strong push away, don’t force the label.
- Check where it sits relative to EQ. A perfect bullish OB sitting deep in premium often behaves worse than you want.
- Look for confluence, not clutter. If an OB aligns with an imbalance (like an FVG) you have a cleaner narrative.
Important note:
Not every candle before a move is an order block worth trading. The best ones are earned by context: range location + impulsive move + a clear reason price would return.
Fair Value Gaps in the ICT Dealing Range
A Fair Value Gap (FVG) is widely described as a three-candle imbalance/inefficiency that forms when price moves so quickly that the market doesn’t trade efficiently through a zone; traders often expect price to revisit that area later to fill or rebalance it.
Inside the ICT dealing range, the FVG becomes a practical tool because it gives you:
- A zone (not a single line) to watch for reaction.
- A reason for retracement that isn’t just because it pulled back.
How to use FVGs without overcomplicating it:
- Only prioritise FVGs that appear after a clean, impulsive move.
- Give higher weight to FVGs that sit in the right half of your dealing range (discount for bullish ideas, premium for bearish ideas).
- Treat the FVG as a location, then look for confirmation through your broader narrative (where liquidity is likely resting, what the likely draw is, etc.).
Trading Zones and Liquidity Moves in the ICT Dealing Range
Once you’ve defined dealing range ICT high/low and marked equilibrium, the next job is not to trade the box — it’s to read where price sits on the curve (premium/discount), then watch how liquidity is taken and used to fuel the next move. This is where the dealing range becomes practical: it tells you where to stop chasing and where to start waiting.
How to Identify Premium and Discount Zones in the ICT Dealing Range
The cleanest way to define premium and discount is the ICT-style EQ split: draw a Fibonacci from the swing high to swing low (or vice versa) and use the 0.50 level as equilibrium. Above EQ is premium (price is high relative to the swing), and below EQ is discount (price is cheap relative to the swing).
In practice, you only need three labels on your chart:
- Dealing Range High
- Equilibrium (0.50)
- Dealing Range Low
If you want a simple execution habit:
- When price is on premium, I prepare to sell ideas (not blindly — but I’m alert).
- When price is on discount, I prepare to buy ideas.
Important note:
Premium/discount is a relative measure. If your chosen swing is wrong, your cheap and expensive labels will be wrong too.
Using Zones to Read Potential Reversals in the Range
Premium and discount zones don’t predict reversals by themselves — they tell you where reversals are more sensible and where they’re usually forced.
A practical reversal read inside a dealing range often looks like this:
- Price reaches an extreme (premium or discount)
That’s the location filter. - Liquidity is taken (sweep)
Price pushes beyond an obvious high/low to trigger resting orders, then reacts. - A deliverable structure appears (PD arrays)
You’ll often see displacement and then a clean area to lean on (FVG, order block, etc.).
If you’re trying to learn this properly, don’t ask Is this a reversal? first. Ask:
- Is price in a logical place for a reversal (premium/discount)?
- Did price take liquidity before shifting direction?
- Do I have a clean internal level to execute from, or am I guessing?
Don’t forget:
Reversals that don’t take liquidity first are usually the ones that feel too clean — and they’re the ones retail traders chase late.
Liquidity Sweep Explained in the ICT Dealing Range
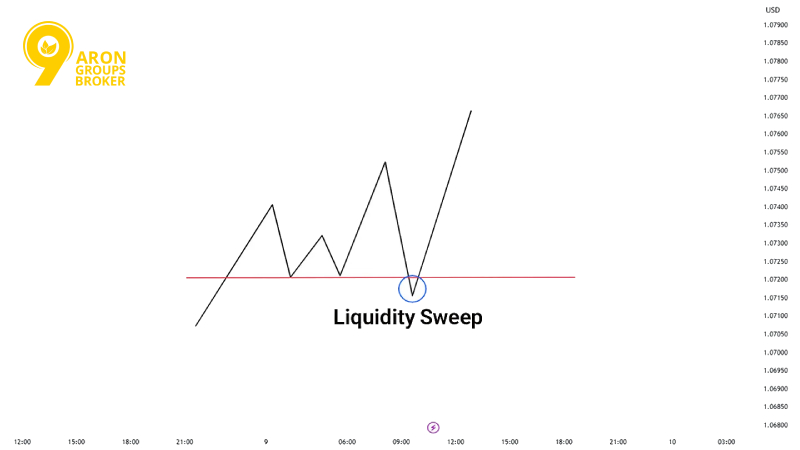
A liquidity sweep is typically described as a quick push beyond a well-watched high/low to trigger clustered orders (stops, breakout entries, resting orders), followed by either rejection back into the range or acceptance beyond the level.
Inside a dealing range ICT, sweeps most commonly show up at:
- The range high (buy-side liquidity above highs)
- The range low (sell-side liquidity below lows)
- Obvious equal highs/lows near the boundaries (when they’re visible, they’re attractive targets)
The key learning point is this: a sweep is not price manipulation as a story — it’s simply a liquidity event. The market reaches for fuel, then decides whether to reject or accept.
Step-by-Step: Executing a Liquidity Sweep in the Dealing Range
Here’s a practical process you can rehearse on any chart (forex or indices) without overcomplicating it:
- Build the dealing range
- Mark swing high, swing low, and EQ (0.50).
- Decide what you’re waiting for
- A sweep of the high or the low (external liquidity event).
- Wait for the probe
- Price pushes beyond the level and triggers orders.
- Classify the outcome
- Rejection: price snaps back into the range (failed break behaviour).
- Acceptance: price holds beyond the level and starts building value outside it.
- Choose an internal execution point
- After rejection/acceptance, look for a clean internal reference (e.g., an FVG or order block aligned with your narrative), as detailed by Writofinance.
- Define invalidation and target
- Invalidation is usually back through the sweep (context-dependent).
- Target is typically the next logical liquidity pool (often external).
Drawing on Liquidity: How Smart Money Triggers Moves in the ICT Dealing Range
Draw on Liquidity (DOL) is the idea that price tends to move toward visible liquidity pools — old highs/lows, equal highs/lows, key support/resistance areas — because those zones contain resting orders that can be used to facilitate larger buy and sell in forex.
In dealing range terms, DOL helps you answer one of the most important questions:
- If price leaves this dealing range, where is it most likely headed next?
A simple way to apply DOL without getting lost:
- Identify 2–3 candidate liquidity pools (not ten).
- Rank them by visibility (the more obvious the level, the more likely it’s a magnet).
- Use premium/discount to avoid aiming for targets that don’t fit your current location.
Practical Examples of Drawing Liquidity in the Range
Example A (bullish narrative):
- Price trades into a discount (below EQ).
- It sweeps below the range low (takes sell-side liquidity), then re-enters the range.
- Your DOL becomes the next obvious upside pool: range high and/or a prior session high (buy-side liquidity).
Example B (bearish narrative):
- Price trades into premium (above EQ).
- It pokes above the range high (takes buy-side liquidity) and fails to hold above it.
- Your DOL becomes the next obvious downside pool: range low and/or a prior session low.
Remember that:
If you can’t name your DOL in one sentence, you’ll enter too early — because you’re trading a pattern instead of a destination.
Price Expansion After the ICT Dealing Range
Price expansion is what the dealing range often sets up: liquidity is gathered, internal structure forms, and then the market moves with intent toward the next objective. The useful part isn’t predicting the exact pip — it’s recognising when the market has likely finished building and is ready to deliver.
Predicting Where Price Will Move After the ICT Dealing Range
A grounded way to anticipate expansion is to focus on what liquidity has been cleared and what liquidity is still untouched.
A common ICT-style framing is:
- Internal liquidity is addressed first, then price seeks external liquidity (above the swing high / below the swing low).
So instead of asking Will it break up or down?, ask:
- Which side of the dealing range has just been swept?
- Which obvious liquidity pool remains uncollected?
- Did the move show acceptance (hold) or rejection (snap back) beyond the boundary?
Important note:
Expansion is easiest to read after the liquidity event. If you try to forecast before the sweep, you’ll often pick the right direction at the wrong time.
How the Equilibrium Sets Up Expansion in the ICT Dealing Range
Equilibrium (EQ) is useful here because it’s a quick state check:
- If price is repeatedly holding above EQ, it’s spending more time in premium and may be positioning for an upside objective (context dependent).
- If price is repeatedly holding below EQ, it’s spending more time in discount and may be positioning for a downside objective.
EQ also helps you avoid a classic mistake: expecting a huge expansion while price is still stuck oscillating across equilibrium (that’s often balance, not delivery). The premium/discount framework is explicitly built around EQ as the midpoint reference.
Timeframes and Context for ICT Dealing Range
Dealing ranges exist on every timeframe — but they don’t all carry the same weight. The practical edge comes from aligning a lower timeframe dealing range with a higher timeframe narrative, so you’re not trying to scalp against the bigger draw.
Intraday, Daily, and Weekly ICT Dealing Ranges Explained
Think of timeframe dealing ranges as different zoom levels of the same map:
- Intraday dealing range: built from local swings inside the session; used for execution and timing.
- Daily dealing range: built from daily swings; used for day-to-day bias and key targets.
- Weekly dealing range: built from weekly swings; used for broader objectives and where the week wants to go.
ICT-style education often emphasises structured multi-timeframe work (higher timeframes for context, lower for entries), and more broadly, multi-timeframe analysis is a widely taught method in trading education.
How Higher Timeframes Influence Lower ICT Dealing Ranges
As outlined by Investopedia, here’s the simplest way to make this real:
- Higher timeframe levels act like bigger magnets.
- Lower timeframe ranges often form inside a higher timeframe leg that’s aiming for a larger liquidity pool.
That’s why many traders use a top-down routine: longer timeframes for context, shorter timeframes for precision.
Important note:
If your 5-minute dealing range suggests a long, but your daily narrative is clearly drawing to downside liquidity, the perfect 5-minute setup can still be a trap. Context first.
Applying ICT Dealing Ranges Across Different Charts
A practical, repeatable workflow across instruments (FX and indices) looks like this:
- Start on the higher timeframe (HTF)
- Mark the most obvious swing high/low dealing range.
- Mark EQ and premium/discount
- You’re building the curve.
- Drop to the lower timeframe (LTF)
- Look for a smaller dealing range that fits inside the HTF story.
- Use LTF only for execution
- Your entry is refined on LTF; your why comes from HTF.
If you do just one thing to improve learning speed: keep a weekly folder of screenshots where you annotate HTF range + EQ + DOL, and then show where the LTF dealing range formed.
ICT Dealing Range vs Traditional Range Trading
Traditional range trading is commonly taught as buying near support and selling near resistance inside a defined channel — essentially a mean-reversion approach within a sideways market.
ICT dealing range work can look similar on the surface (high/low boundaries), but the intent is different:
- Traditional range trading asks: Will it bounce between support and resistance?
- ICT dealing range asks: Where is liquidity resting, what will get swept, and where is price drawn next?
A practical comparison:
| Feature | Traditional range trading | ICT dealing range approach |
|---|---|---|
| Core idea | Buy support/sell resistance | Measure premium/discount + track liquidity objectives |
| Common trigger | Touch of level, indicator signals | Liquidity sweep + rejection/acceptance + internal reference |
| Where it works best | Typically sideways markets | Can be used within trends as a measurement framework |
How to Trade the ICT Dealing Range
Trading a dealing range ICT is not buying the low, selling the high. It is a simple process: define the range, mark EQ, identify the likely liquidity draw, then execute from a clean internal level after liquidity is taken or price shows acceptance. Keep it boring. Keep it repeatable.
Entry and Exit Strategies for ICT Dealing Range Trades
You can trade the dealing range with a few consistent models. Start with two. Master them. Add more later.
Model 1: Sweep → Reversal (classic)
- Mark High / Low / EQ.
- Wait for a sweep of the range high or low.
- Look for rejection back inside the range.
- Enter on a return to a clean internal level (FVG or OB) in the correct half.
- Target the next liquidity pool (often EQ first, then the opposite side).
Model 2: Break → Acceptance (continuation)
- Mark High / Low / EQ.
- Wait for a break and acceptance outside the range.
- Avoid instant entries. Let price retest.
- Use the first clean internal level after the break as your entry zone.
- Target the next external liquidity pool in the trend direction.
Simple exit structure (keeps you disciplined)
- Take partial at EQ if the price starts from an extreme.
- Take more at the next obvious internal level.
- Final target at the opposite boundary or external liquidity (depending on your model).
A Suggestion:
If you can’t point to your entry, invalidation, and target in 10-15 seconds, skip the trade.
Managing Risk Within the ICT Dealing Range
Your edge dies if risk is sloppy. Keep risk management rules tight and simple.
Core risk rules
- Risk a fixed amount per trade (small and consistent).
- Place stops where the idea is proven wrong, not where it feels comfortable.
- Avoid entries in the middle of the range. That’s where uncertainty lives.
Practical stop placement
- For sweep-reversal: the stop often goes beyond the sweep extreme.
- For acceptance trades: stop often goes back inside the range, below/above the acceptance structure.
A quick risk checklist
- Is the entry in premium or discount, not near EQ?
- Is there a clear liquidity event or acceptance?
- Is the stop logical and not huge?
- Is the target realistic for the timeframe?
| Risk Item | Good behaviour | Bad behaviour |
|---|---|---|
| Entry location | Near an extreme | Mid-range impulse entry |
| Stop | Beyond invalidation | Random tight stop |
| Target | Clear liquidity pool | I’ll see what happens |
| Frequency | Few good trades | Many forced trades |
Common Mistakes Traders Make in the ICT Dealing Range
Most losses come from the same three issues: wrong range, wrong location, or rushed execution. Fix those, and your results usually improve fast.
Don’t Confuse Any Consolidation With a Real ICT Dealing Range
Not every chop is a dealing range worth using. Many boxes are just noise.
Fix
- Anchor the range to a meaningful swing high and swing low.
- Avoid micro ranges inside random candles.
- If the boundaries are not obvious, don’t force it.
Respect the Midpoint and Equilibrium in ICT Dealing Range Trades
EQ is a filter. It keeps you from buying high or selling low.
Fix
- For longs, prioritise setups below EQ (discount).
- For shorts, prioritise setups above EQ (premium).
- If the price keeps flipping around EQ, reduce the size or stand down.
Combining Liquidity and PD Arrays for Safer ICT Dealing Range Entries
A PD array without liquidity context is just a shape. A sweep without structure is just a spike.
Fix
- Start with liquidity: what got swept, and what is the draw?
- Then use PD arrays to execute: FVG/OB as the entry location.
- Demand a clean story: event → displacement → return to level → execute.
Conclusion
An ICT dealing range gives you structure. It tells you where price is on the curve, where liquidity sits, and where entries make sense. Keep your process simple: mark High/Low/EQ, wait for a liquidity event or acceptance, and execute from a clean internal level with a clear invalidation. Then journal it. One screenshot per trade is enough. After 20 examples, you’ll start seeing the range like a map, not a box.