icon icon Home
icon icon Accounts
icon icon Quick start
icon icon Symbols

Understanding the ICT Killzone Indicator and Its Role in High-Liquidity Trading Hours

Author
Abe Cofnas
Abe Cofnas
calendar Last update: 31 January 2026
watch Reading time: 10 min

The ICT Killzone Indicator is widely used to highlight periods of elevated market participation, yet many traders misapply it due to inconsistent session timing across platforms and brokers.

This guide explains how to align Asian, London, and New York kill zones correctly on MT4, MT5, and TradingView using reliable time references. It also outlines a practical framework for integrating session windows with market structure validation and clearly defined liquidity objectives, so timing supports execution rather than replacing analysis.

bookmark
Key Points:
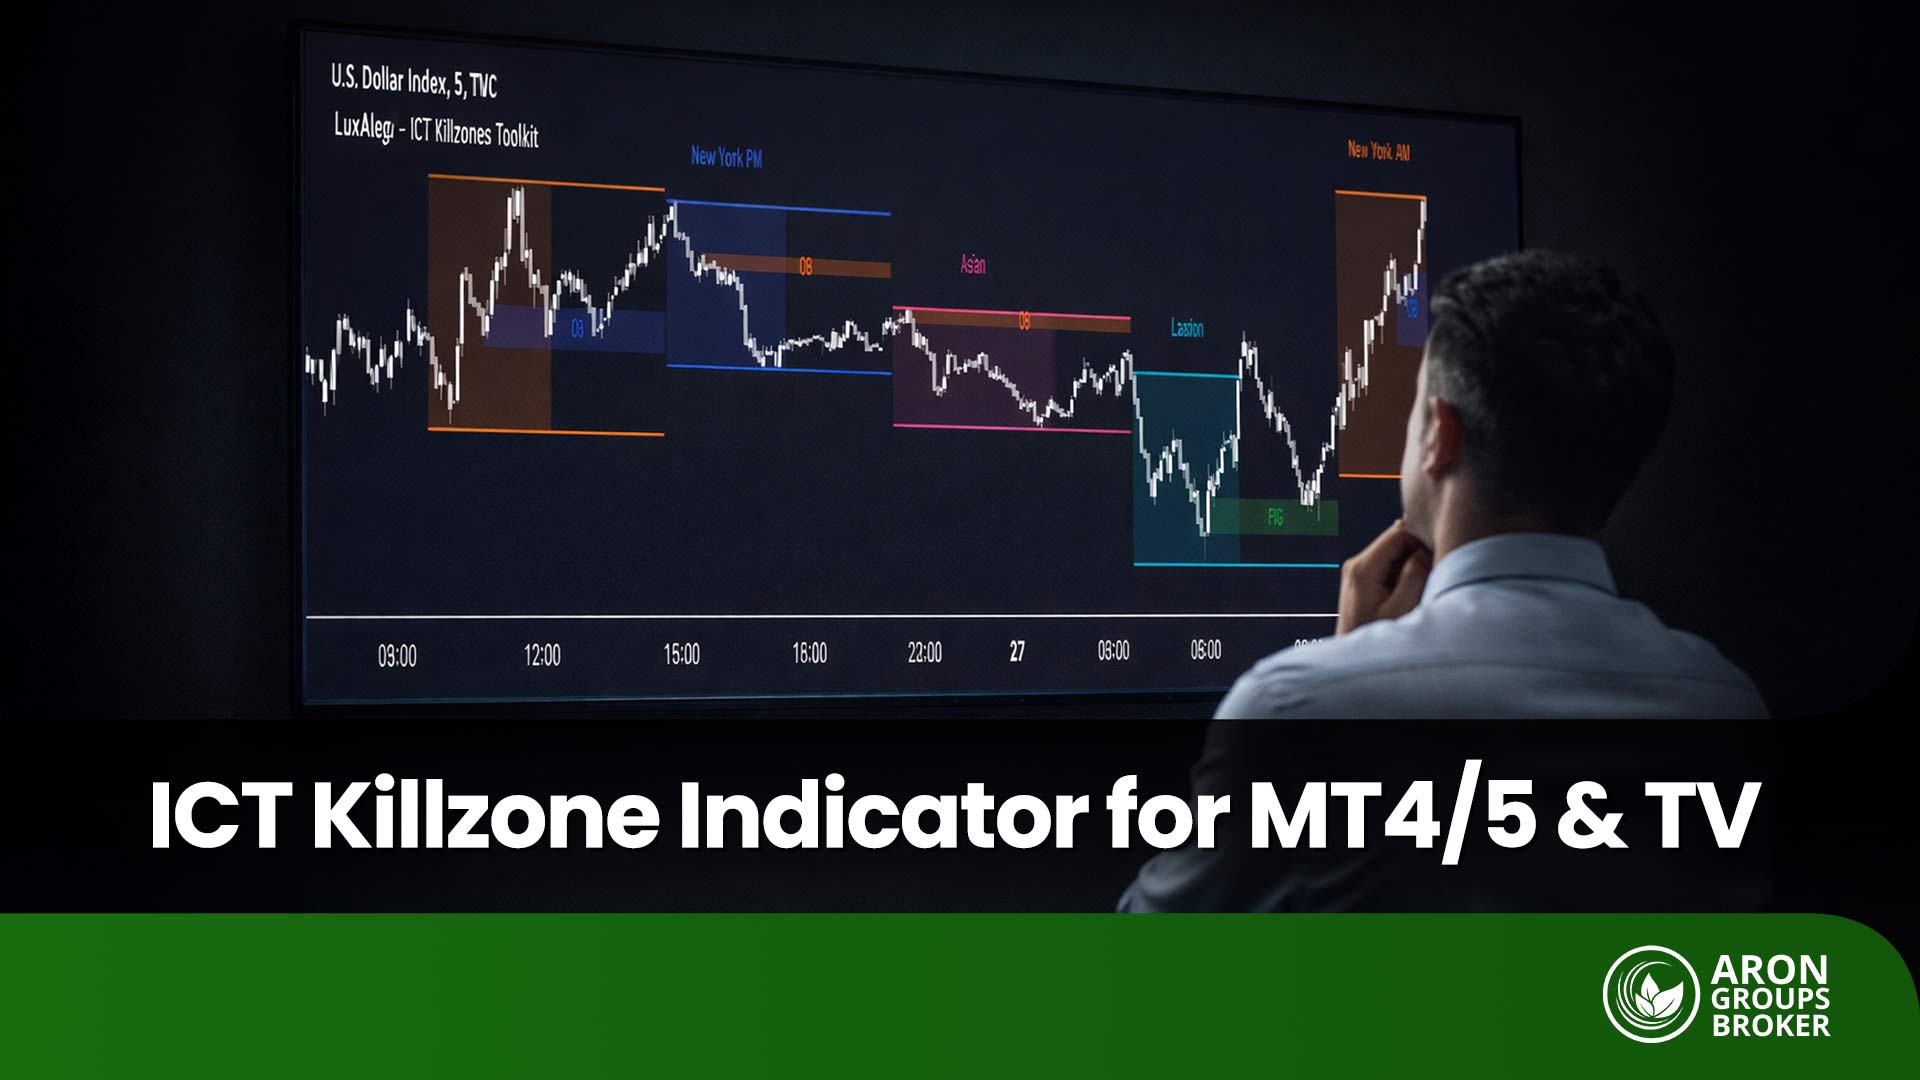
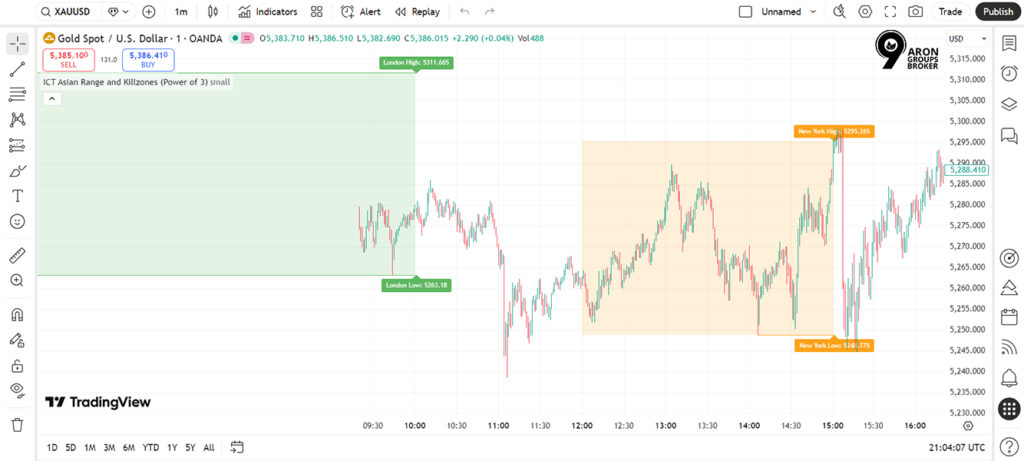
  • ICT Killzones function as time-based filters that tell you when to trade without predicting price direction.
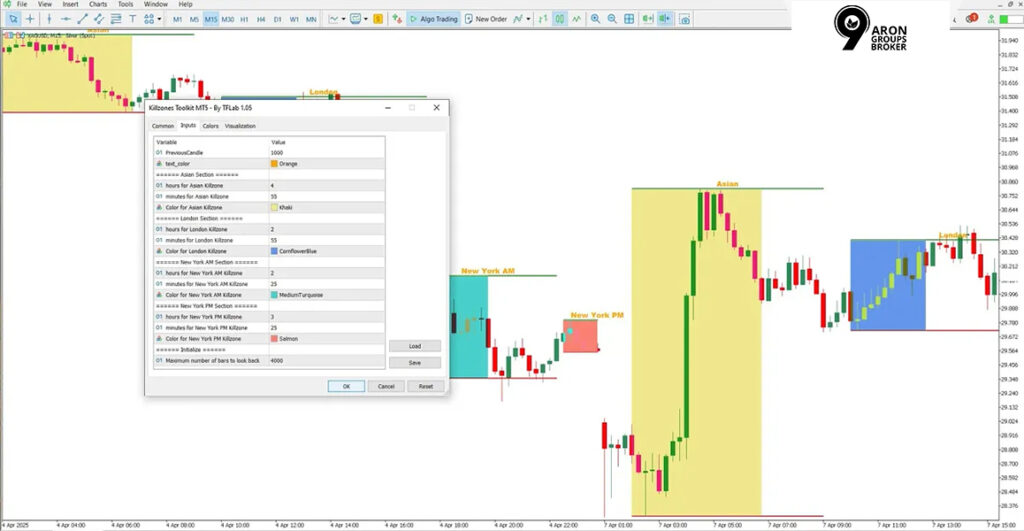
  • Most indicator errors occur when settings are aligned with local time instead of your Broker Server Time.
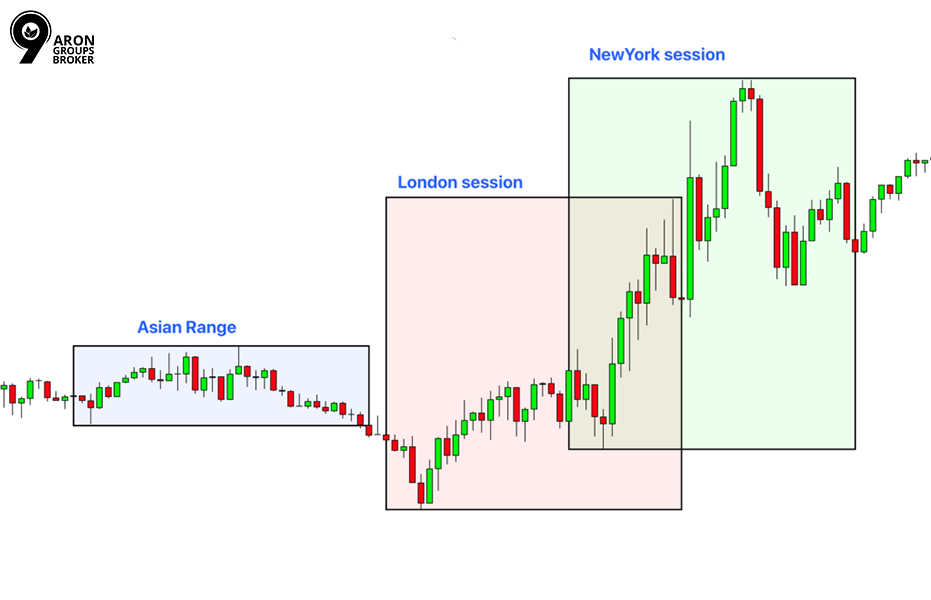
  • The London-New York overlap offers peak liquidity and often provides the day's best reversal opportunities.
  • Trading the first 15 minutes of a session is risky due to unstable spreads and frequent stop hunts.

What Is the ICT Killzone Indicator?

According to the mql5 website, the ict killzone indicator draws time boxes that isolate the day’s busiest dealing hours on your chart. These boxes typically correspond to the: 
ICT Killzone Indicator

It is a scheduling tool for attention, not a forecasting engine for price direction. A highlighted window cannot confirm bias, validate structure, or upgrade a weak setup into a trade.

Most versions let you control what is visible, so the chart stays readable during fast conditions. You can usually toggle individual sessions, switch labels on or off, and simplify colours for clean execution views.

Q: Can kill zones work on any instrument, or only FX?
A: They can be applied to many markets, but session logic matters most in 24-hour products like the forex market.

Why Session Windows Matter?

Participation clusters around session opens because regional banks, corporates, and funds enter price discovery in sequence. Overlaps compress global attention into one window because two dealing centres compete for the same flows.

These windows can improve tradability, yet they increase execution sensitivity when price updates accelerate and orders stack. When order flow intensifies, you often see tighter quotes, faster movement, and a higher chance of slippage.

The London-New York overlap is widely described as the most liquid stretch of the FX day. It is also commonly treated as a peak-volatility interval, especially when US data hits during active European participation.

sms-star

Did You Know:
Session overlaps combine two active regional order books, so liquidity refreshes faster and spreads often tighten. Execution can still worsen during sudden bursts because orders hit multiple venues at once.

Kill Zones vs Trading Sessions

Also explained in Investopedia, “Asian, London, New York” are labels for periods of higher regional participation, not fixed market opening bells. They are not a universal clock, and the same label can shift by one hour during daylight saving transitions.

ICT Killzone Indicator

A session label describes who is active, not a guaranteed start time for every broker and every symbol. That distinction matters when you compare notes across platforms or copy session settings from another trader.

Broker server time and DST pitfalls

MetaTrader charts use your broker’s server time, which can differ from London or New York time by several hours. That difference is why a kill zone can look “wrong” on MT5, yet still be correct for that broker’s chart clock.

Pick one reference zone for planning, then convert every session window into your platform’s chart time. UTC is a sensible anchor because it does not change with daylight saving, which reduces routine errors.

Session reference times (example, must be verified by your platform)

Session labelCommon referenceWhat to verify
Asian sessionTokyo/Sydney flowBroker server time, DST offset
London sessionEuropean openLocal DST changes, MetaTrader chart time
New York sessionUS market hoursOverlap window versus full session

Treat this table as a map legend, not a promise that every symbol trades identically at those hours. Always confirm the chart’s displayed time, the symbol’s session settings, and any broker-specific trading breaks.

sms-star

Risk Note:
Wrong time zone settings create false “kill zone” boundaries that can shift entries and distort your comparisons.

Q: Why does my kill zone start two hours early on MT5?
A: Your broker’s server time or DST setting may differ, or indicator inputs may assume another reference time.

ICT Killzone Indicator Times for Asia, London, and New York

If your platform is set to UTC, these session windows are a practical starting reference. Some indicators shade the full session, while others highlight narrower sub-windows within the same session.

Typical session windows

SessionUTC Time (Standard)The "DST Trap
Asia (Tokyo)00:00 – 09:00Usually stable (Japan doesn't use DST).
London (Ldn)07:00 – 16:00Shifts 1 hour in March/Oct (UK Time).
New York (NY)12:00 – 21:00Shifts 1 hour in March/Nov (US Time).
Ldn/NY Overlap12:00 – 16:00High Volatility Zone. Watch out for the "Gap Weeks" when US/UK shift on different dates.

Daylight saving time can shift how these windows appear on your chart. The shift occurs because local session clocks change while your platform reference may stay fixed.

In Europe and the UK, summer time runs from the last Sunday in March to the last Sunday in October. In most of the United States, daylight saving time runs from the second Sunday in March to the first Sunday in November.

Because the US and Europe switch on different dates, the London-New York overlap shifts for one or two weeks. During those weeks, your indicator can look incorrect unless you convert from local session time consistently.

  • When London is on BST (UTC+1), an 08:00 London open prints at 07:00 UTC on UTC charts.
  • When New York is on EDT (UTC−4), an 08:00 New York open prints at 12:00 UTC on UTC charts.

DST handling rules that prevent misaligned kill zones

  • Anchor planning to one reference zone, then convert into broker or chart time before trading.
  • Re-check conversions on DST change weeks, not after you notice entries have shifted.
  • If you change chart time zones, reapply the indicator and confirm its session inputs still match.

MetaTrader Setup for the ICT Killzone Indicator (MT5 and MT4)

Start with official marketplaces when possible, because listings usually include version notes and update paths. Avoid random file mirrors, because you cannot verify file integrity, and updates often break without any changelog.

On MT5, the marketplace listing presents the tool as a session highlighter, not a directional indicator. It also notes options to show or hide sessions and session names, which helps reduce chart clutter.

ICT Killzone Indicator MT5/MT4 Setup Steps

  • Download from the official listing or a verified provider with a clear version history.
  • Restart MetaTrader 5 or MT4 so the platform reloads indicators into the Navigator panel.
  • Attach the indicator to the target symbol, then open Inputs and review session hours.
  • Confirm the assumed time zone, then toggle labels and hide unneeded sessions for clarity.
ICT Killzone Indicator
sms-star

Note:
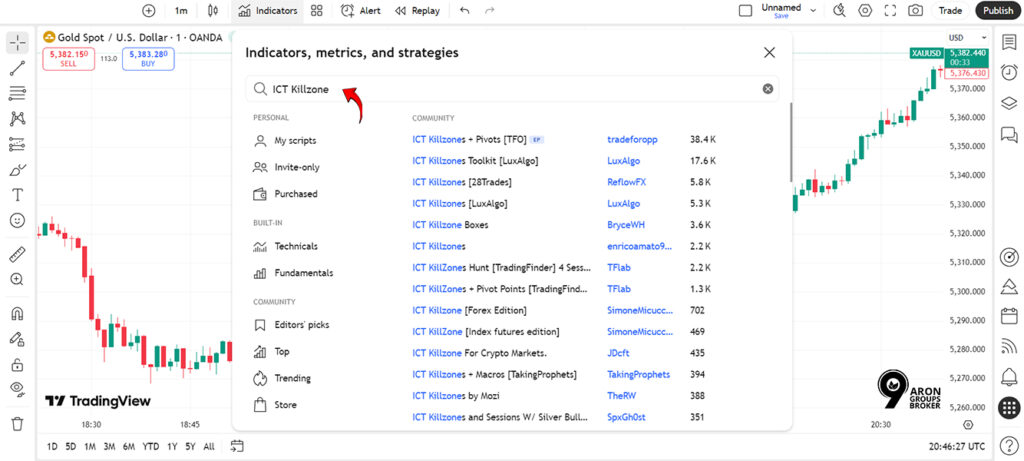
Use “ICT killzone indicator for MT5 (free download)” carefully, because “free” can mean trial access or a limited version. If sessions misalign, check the broker server time first, because chart time is anchored to the server clock.

Q: How do I change the displayed session times on MT5?
A: Edit the indicator Inputs for session hours, then match those hours to the broker server time reference.

ICT Killzone Indicator for TradingView

  • Step 1: Open TradingView and load the chart for the symbol you trade most often during sessions.
  • Step 2: Click Indicators, then search for the script name and confirm it matches the author and description.
ICT Killzone Indicator
  • Step 3: Add the script to your chart, then open its settings panel immediately.
  • Step 4: Check the chart time zone shown on TradingView, because session boxes follow that selected time.
ICT Killzone Indicator
  • Step 5: In the script settings, enable only the sessions you actually trade to keep comparisons consistent.
  • Step 6: If the tool includes extra modules, disable them unless you explicitly want those overlays.
  • Step 7: Save the layout, so your session settings persist across charts and devices.

Use the ICT killzone indicator for TradingView as a platform label, not as a claim of forecasting capability.

sms-star

Key Point:
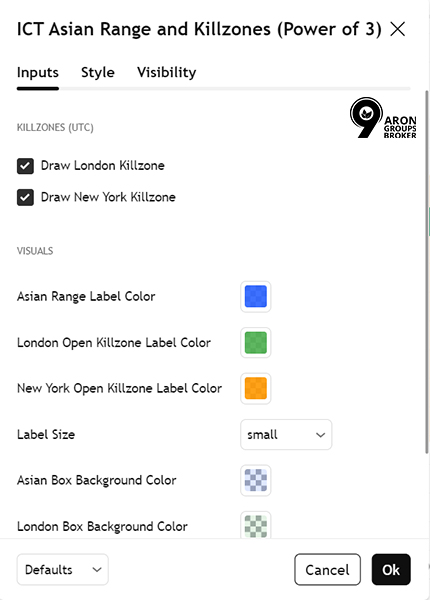
Disable non-session modules if you only want time windows.

How to Trade Kill Zones Without Turning Them Into False Signals

ICT Killzone Indicator

Use kill zones to narrow when you look for trades, while your bias comes from structure and liquidity context. Treat the window as an execution constraint, not a reason to trade.

False entries usually occur when traders act on timing alone and skip confirmation work. Your process should require evidence first, then execution inside the window with defined risk.

Minimum workflow

The “No-Go” Filter Before taking a trade inside a Killzone, ask these 3 questions. If any answer is NO, stand down.

  • Structure: Is the Higher Timeframe (H1/H4) supporting this move?
  • Liquidity: Did price just sweep a clear High/Low before entering the zone?
  • Trigger: Do I have a confirmed entry pattern (e.g., MSS + FVG) inside the box?
FilterWhat to confirmWhat to avoid
Kill zone windowClear session boundaryTaking every touch
StructureTrend or range stateIgnoring the higher timeframe
LiquidityObvious pools and sweepsCalling every wick “smart money”
ExecutionSpread and slippageMarket orders in thin moments
Q: Which timeframe is best for kill zone marking? A: Mark sessions on one consistent timeframe, then execute on a lower timeframe only after your higher-timeframe conditions stay intact.

Execution Risks Inside Kill Zones

  • Spreads can widen briefly at session opens because liquidity providers re-quote and pull stale prices during the first minutes.
  • Slippage increases when price accelerates through levels, so market orders often fill worse than expected during early volatility.
  • Prefer limit orders when your entry level is clear, because you control price and reduce variance in realised risk.
  • Use market orders only when the delay invalidates the setup, and the live spread still fits your stop distance.
  • Avoid placing stops at obvious equal highs or lows, because early-session probing often reaches those levels without reversing.
  • Place stops where the trade idea is invalidated structurally, then size the position to keep cash risk constant.
  • Skip the first minutes if spreads are unstable or candles are unusually large relative to the recent range.
  • Resume only after the price forms a stable structure that you can define without relying on one spike candle.
sms-star

Warning:

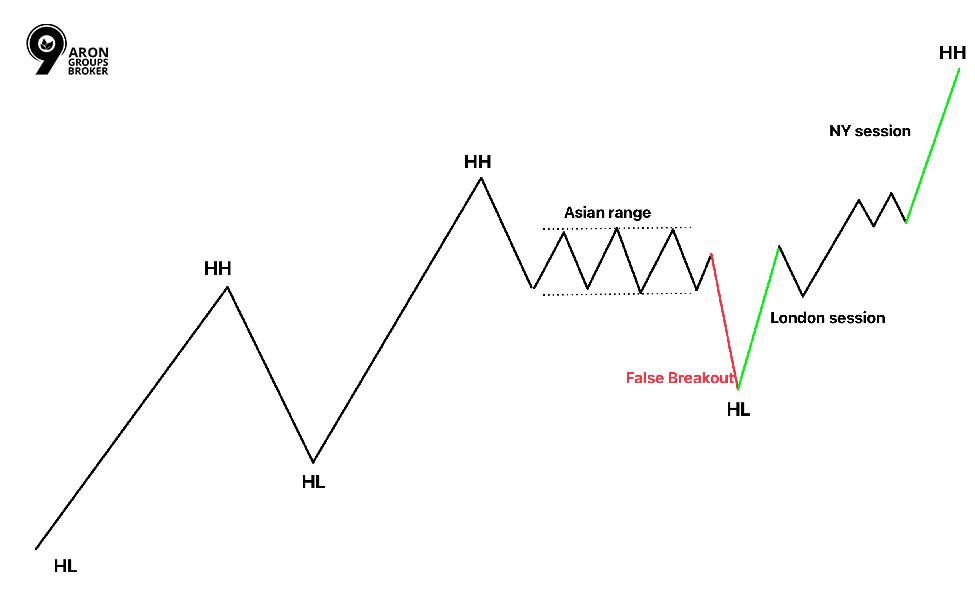
 The "Opening Flush" The first 5-15 minutes of the London and New York opens are notorious for "Stop Hunts".

The Risk: Spreads widen, and price often "wicks" violently to clear liquidity before the real move.

The Fix: Wait for the first 15 minutes (M15 candle) to close before entering a limit order.

Q: Should I avoid trading the first minutes of a session open?
A: Often yes, because spreads stabilise after initial repositioning, and your structure conditions are easier to judge.

Common Mistakes Traders Make With the ICT Killzones Indicator

  • Entering simply because the session highlight is present, without structure alignment or a defined liquidity objective.
  • Ignoring execution conditions, then blaming the idea when spread and slippage change the realised risk.
  • Misreading session boundaries because of time zone settings, broker server time, or DST transitions.
  • Copying session templates from another broker without converting to the chart’s actual clock.
  • Overfitting rules to “perfect” historical windows, then being surprised when volatility regimes change.
  • Trading every session without a regime filter, even when the structure is unclear, and the price is choppy.

Conclusion

Use the ICT Killzone indicator as a fixed timetable, then judge your results by session rather than by individual trades. Run a two-week implementation cycle, keeping position size constant and limiting yourself to one planned setup per session window.

Log each attempt with five fields: 

  • session, 
  • entry type, 
  • stop distance, 
  • realised slippage, 
  • and the specific invalidation level you used. 

At the end of two weeks, remove the worst-performing window, keep the best one, and retest with the same rules.

Continue Reading
not-found
calendar 31 January 2026
Rate this article
Plugin not installed

Leave a Reply

Your email address will not be published. Required fields are marked *

No thanks