Mastering market reversals requires more than just identifying shifts; it demands high-confluence evidence. The ICT Unicorn Model stands out as a precision framework by bridging the gap between structural breakers and price imbalances.
If you have struggled with look-alike setups or false breakouts, this mechanical strategy offers a clear, multi-step sequence to track institutional intent.
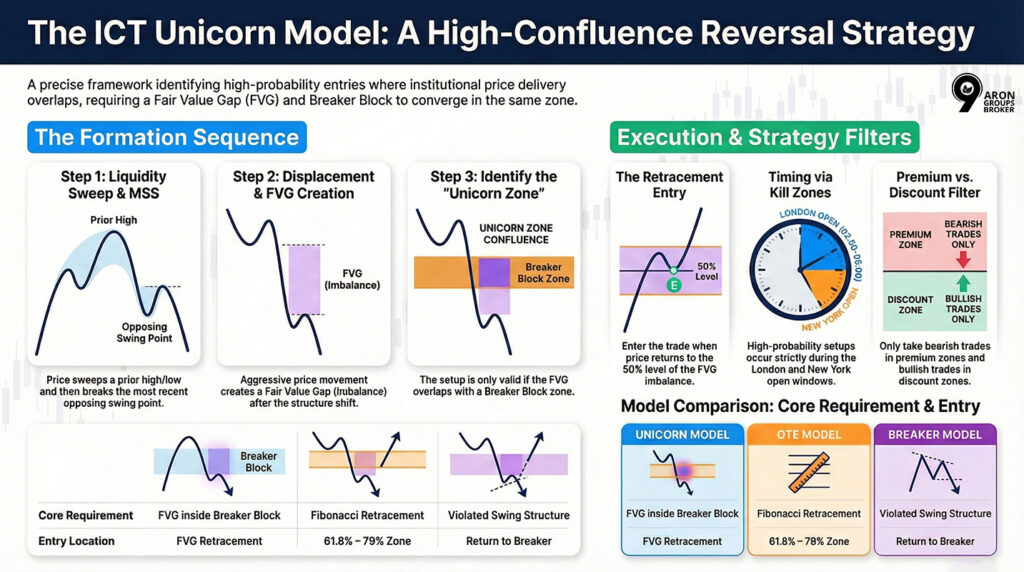
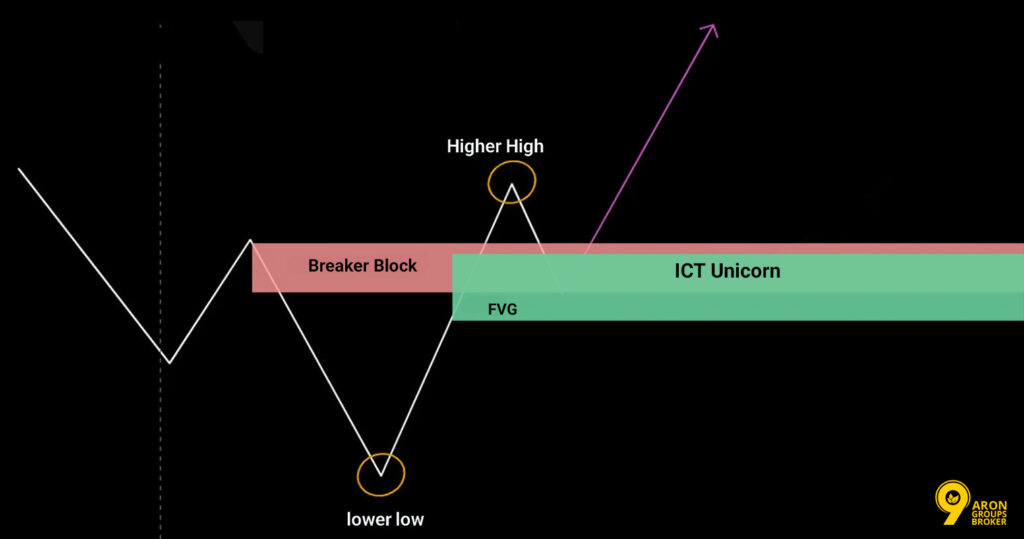
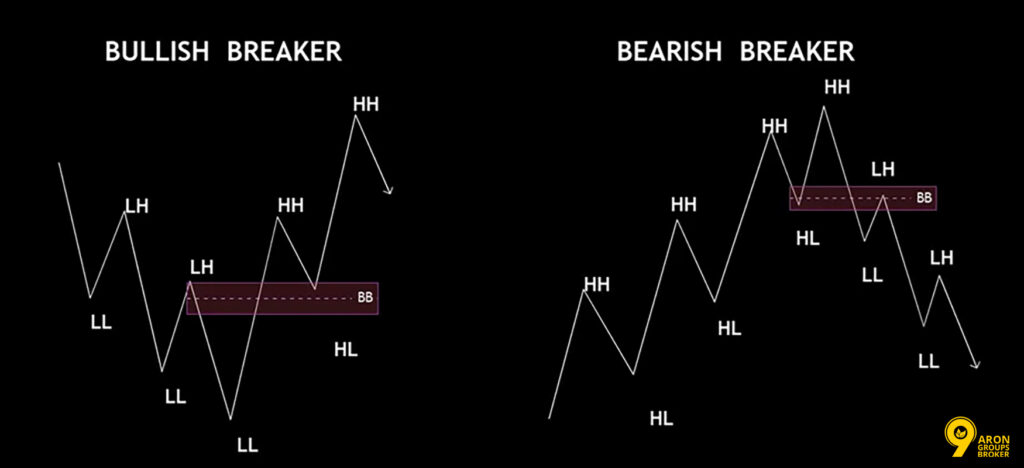
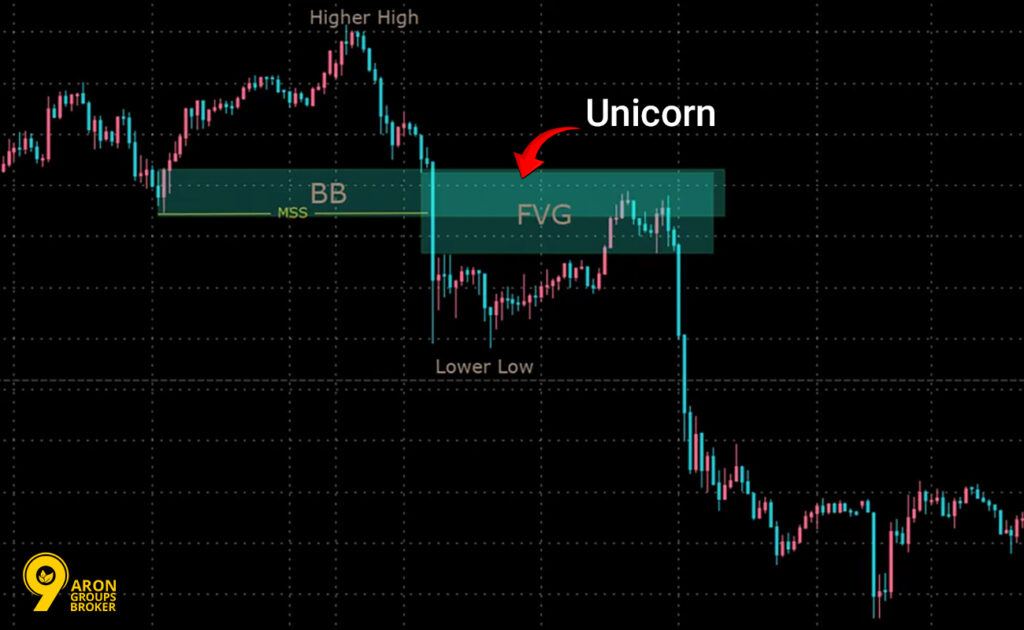
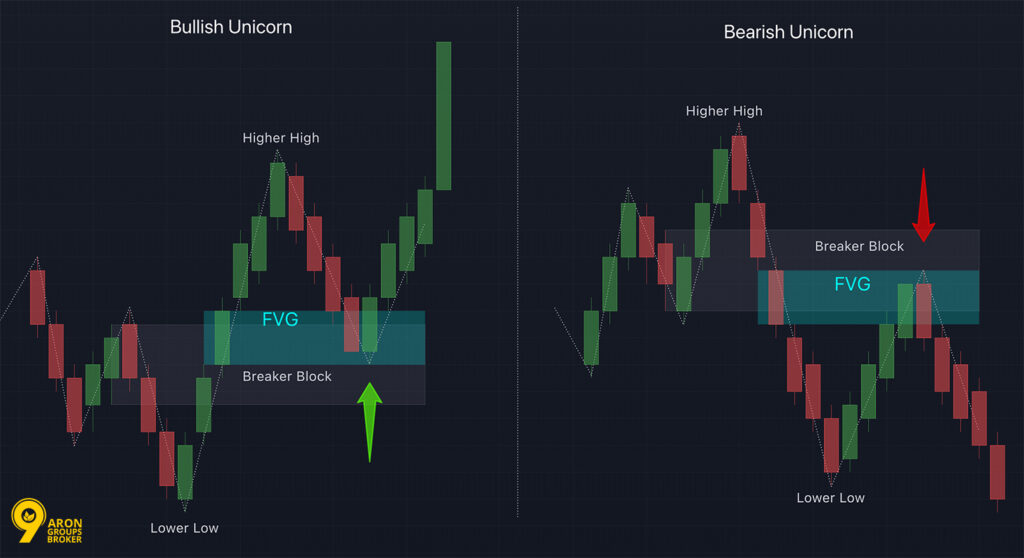
- The Unicorn Model is a precision entry strategy that requires a Fair Value Gap to sit directly inside a Breaker Block.
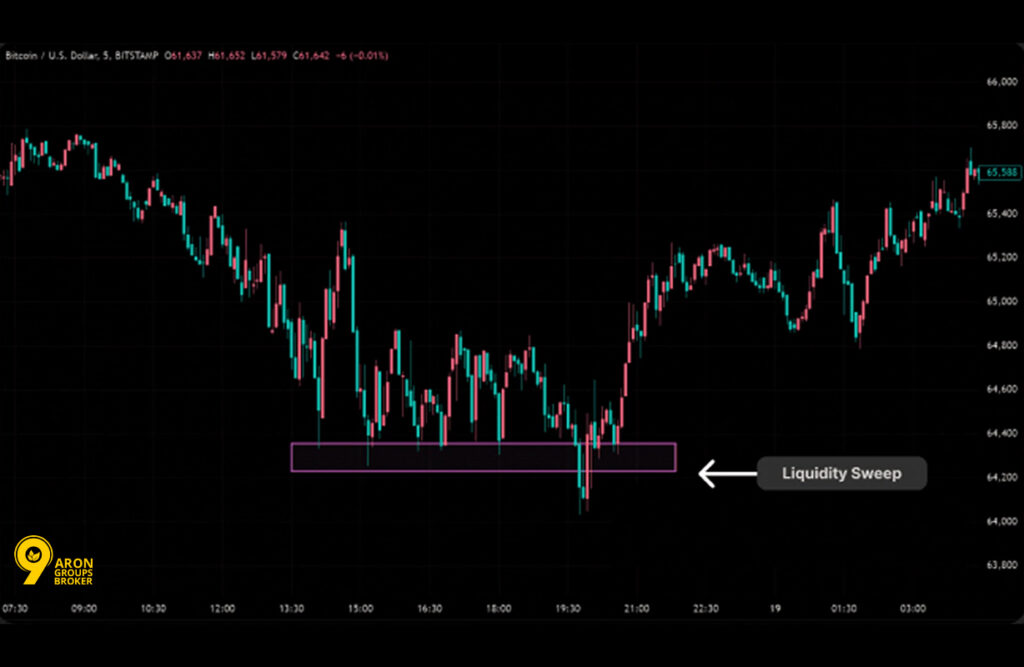
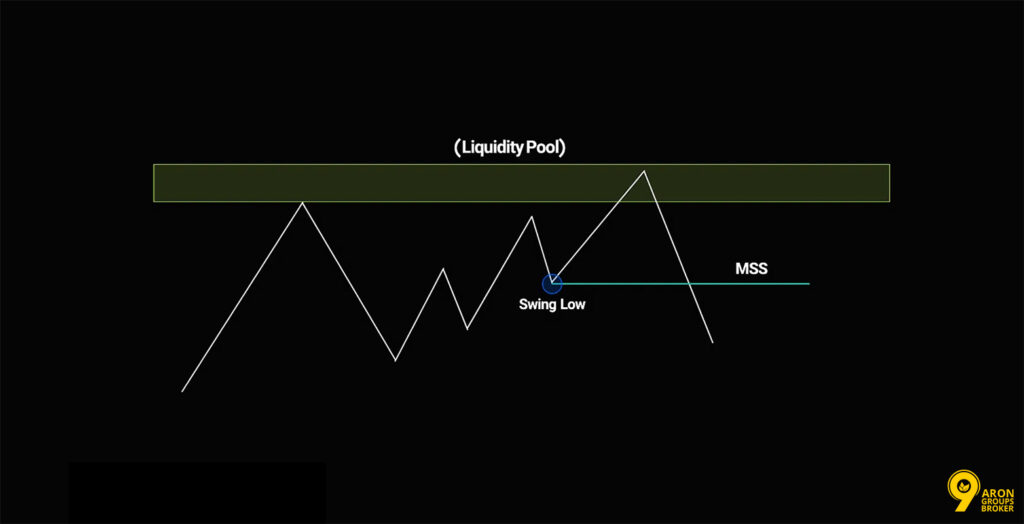
- High-probability setups begin with a clear liquidity sweep of prior highs or lows to reveal institutional intent.
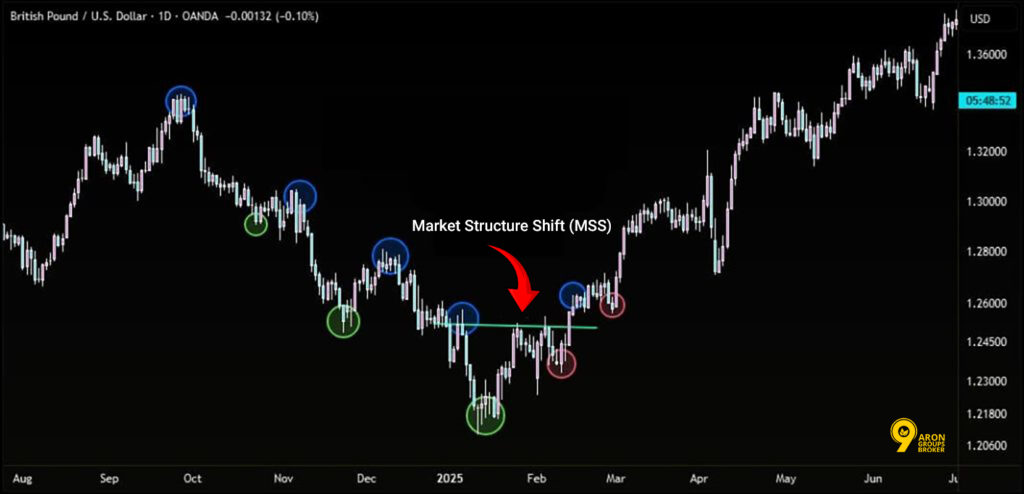
- A valid setup must feature an aggressive Market Structure Shift followed by energetic price displacement.
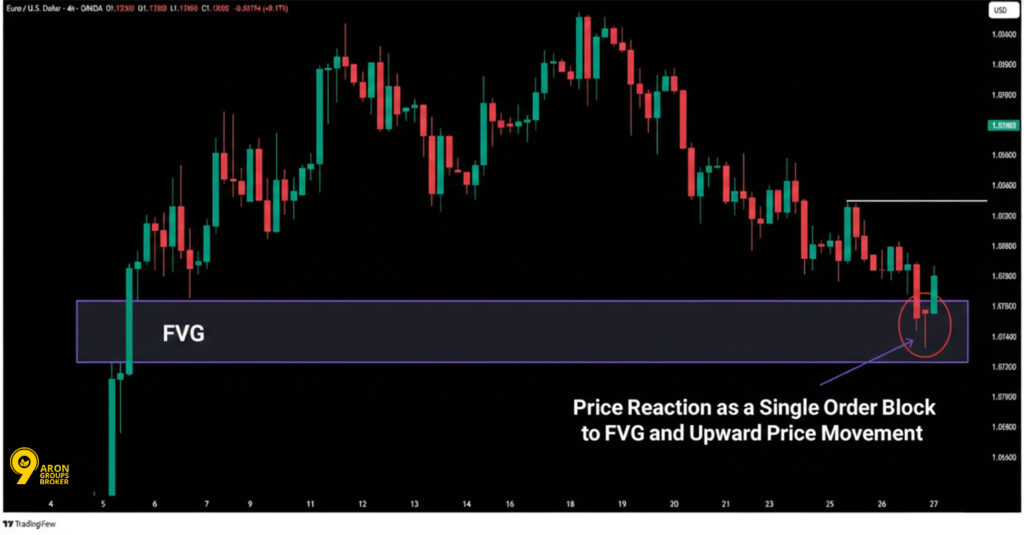
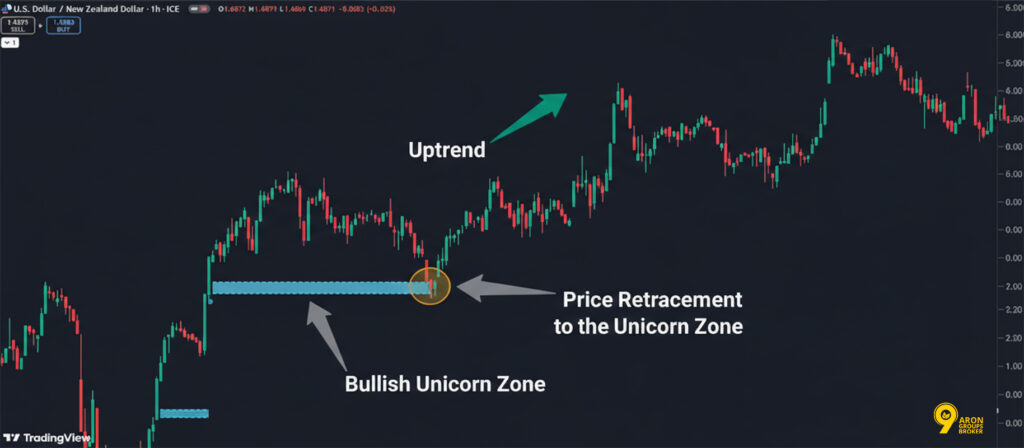
- Entries are only executed upon a retracement into the Unicorn zone, rather than chasing the initial price move.
Understanding the ICT Unicorn Model
The ICT Unicorn model is a high-precision entry framework. It relies on two structural components:
- a Fair Value Gap (FVG)
- and a Breaker Block.
FVG and Breaker Block Confluence Explained
An FVG is a three-candle imbalance. It forms when the price moves so quickly that it leaves a gap between candle highs and lows.
A Breaker Block is a failed swing point. It is a level the market previously respected but has now broken through with speed.
When these two elements overlap in the same price zone, they create a “Unicorn.” This convergence acts as a powerful magnet for institutional repricing.
Key Point:
A Unicorn setup only exists when a Fair Value Gap sits directly inside the range of a Breaker Block.
How the Unicorn Setup Works in ICT Reversals
This model identifies where smart money is likely to reverse the current trend. The process follows a specific sequence:
- Liquidity Sweep: Price hunts stops above a high or below a low.
- Market Structure Shift: Price breaks the previous swing point aggressively.
- Displacement: This fast move creates an FVG within the newly formed Breaker Block.
- The Entry: Traders wait for the price to return to this FVG-Breaker zone before trading the reversal.
How the Unicorn Pattern Forms
According to InnerCircleTrader, the Unicorn pattern follows a strict, mechanical sequence. Each step must be confirmed before moving to the next. Skipping these steps often leads to poor-quality entries and unnecessary losses.
Liquidity Sweep and MSS Confirmation
The first requirement is a liquidity sweep (or stop hunt). This happens when the price moves above a prior swing high (BSL) or below a prior swing low (SSL).
The sweep must be clear and decisive. It signals that the market has collected resting orders before reversing. After the sweep, a Market Structure Shift (MSS) must occur.
An MSS is confirmed when the price breaks the most recent opposing swing point. For a bearish Unicorn, price sweeps BSL and then breaks a prior swing low. This shift confirms the trend change.
Important:
A liquidity sweep without an MSS is not a valid Unicorn setup. You must see both happen in sequence on the same timeframe.
Displacement That Creates the Fair Value Gap
Following the MSS, the price must move with high momentum. This is known as displacement. You want to see strong, impulsive candles rather than a slow drift.
This aggressive movement creates the Fair Value Gap (FVG). A high-quality FVG is easy to spot; the candles should have large bodies, leaving a clear gap between the first and third candle.
Warning:
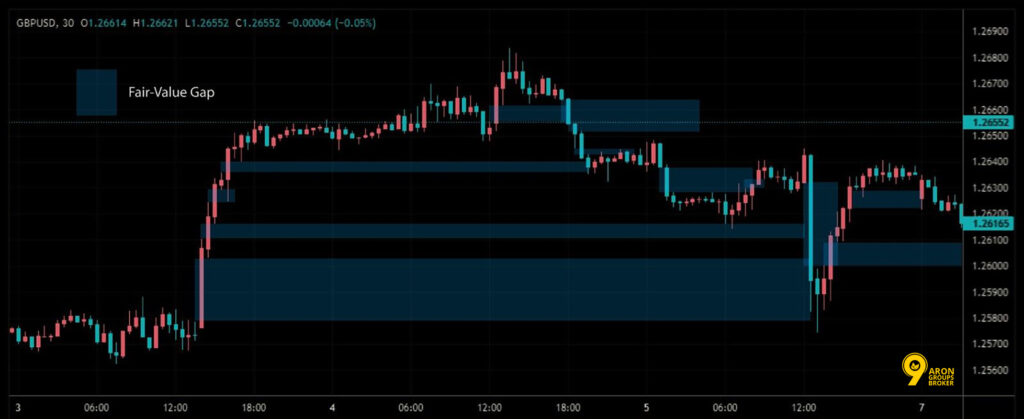
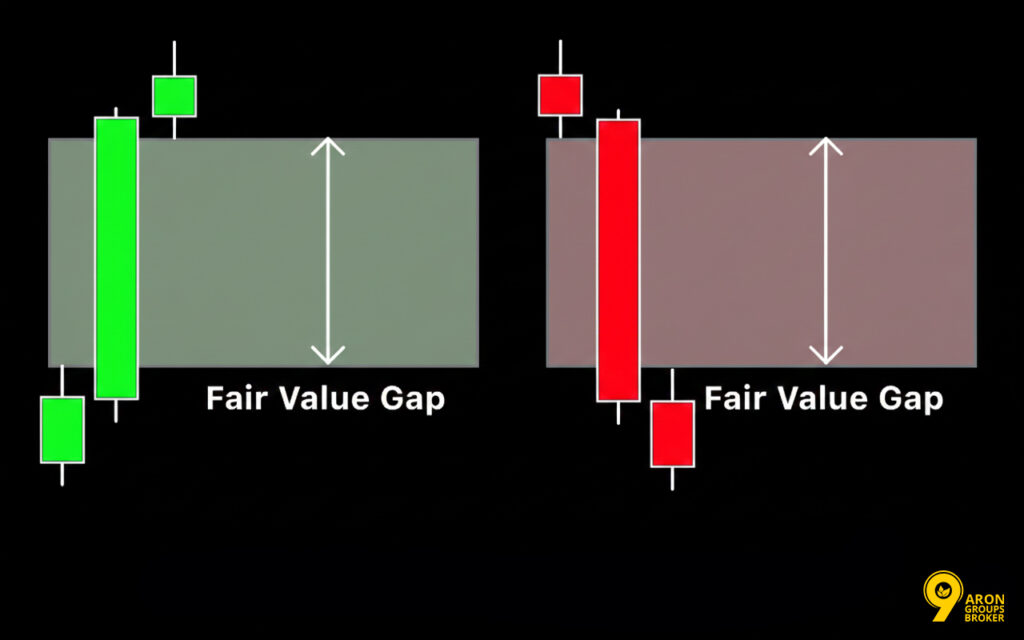
A weak FVG, created by small, hesitant candles, reduces the setup's reliability. Look for "energetic" price action to confirm institutional interest.
Breaker Blocks and FVG Alignment
Once an FVG forms after the Market Structure Shift, you must check for a Breaker Block in the same price zone. This step requires you to find the origin of the swing that was taken out during the initial liquidity sweep.
Origin and Validation of the Breaker Block
The Breaker Block is the failed swing point.
- Bearish Scenario: It is the last up-close candle before a swing low that was later swept.
- Bullish Scenario: It is the last down-close candle before a swing high that was later swept.
For a Breaker to be valid, the original swing must be swept cleanly, followed by an MSS. Most importantly, the Breaker Block must overlap with the FVG created by the displacement. If they do not share the same price range, the ICT Unicorn model does not apply.
Why FVG Inside a Breaker Signals Repricing
When an FVG sits inside a Breaker, the zone becomes twice as significant. The Breaker represents a structural level where institutions previously placed orders. The FVG represents a price imbalance that needs to be filled.
When price returns to this Unicorn zone, it experiences two types of pressure:
- Imbalance Mitigation: The market’s natural urge to fill the gap.
- Structural Support/Resistance: The historical importance of the Breaker level.
This dual pressure makes the zone much stronger than a standard FVG or a lone Breaker Block.
Key Point:
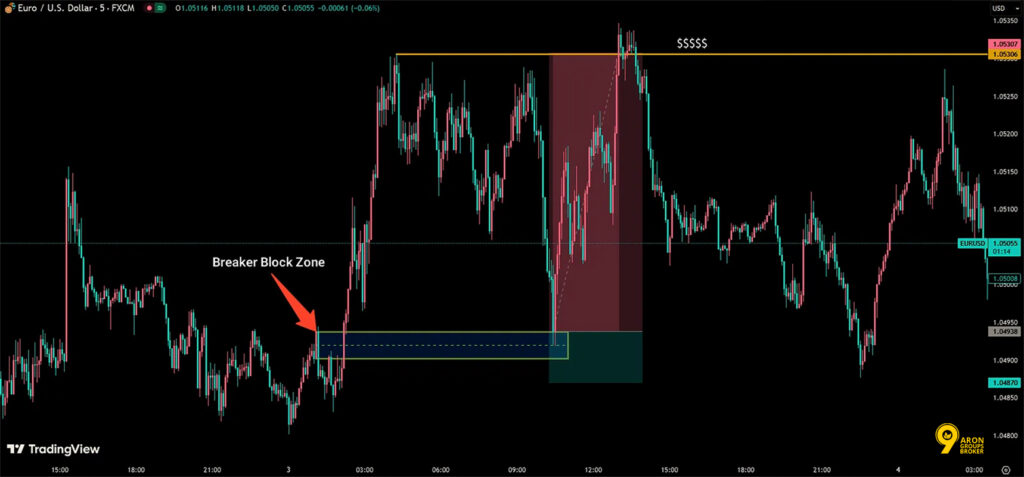
The Breaker Block shows where institutional orders are located. The FVG shows where the price is inefficient. Together, they create a high-confluence Unicorn entry.
Q: Is a Breaker Block the same as a Rejection Block?
A: No. A Rejection Block focuses on the wicks of a swing, while a Breaker Block focuses on the candle body and the failed structural high/low.
Step-by-Step Entry Setup
Understanding the structure is the first step, but the entry itself requires a precise sequence. Below is the logic for a bearish Unicorn model (the bullish version is the exact opposite).
Entry Logic: Returning Into the FVG
Do not chase the price during the initial move. The trade is only taken when the price retraces back into the FVG zone.
- Wait for the Return: After the displacement, wait for the price to “fill” the gap.
- Execution: Many traders place a limit order at the FVG midpoint (the 50% level) or at the gap boundary.
- Confirmation: You can also wait for a rejection candle to form within the FVG before entering with a market order.
Stop-Loss Placement and Invalidation
Your stop-loss (SL) protects you if the structural premise fails.
- Bearish Setup: Place the SL above the high of the Breaker Block or the high of the FVG (whichever is higher).
- Bullish Setup: Place the SL below the low of the Breaker or the FVG (whichever is lower).
The setup is invalid if:
- Price closes past the Breaker Block high or low.
- Price takes out liquidity in the opposite direction before hitting your entry.
- Price fails to return to the zone and continues to move away.
Warning:
Never widen your stop-loss to stay in a trade. If the price breaks the structural rules of the Breaker, the "Unicorn" logic is dead.
Profit Targets: Internal vs External Liquidity
ICT traders target specific draws on liquidity to lock in gains.
- Internal Liquidity: Your first target (TP1) should be the nearest short-term swing point or an FVG in the direction of your trade.
- External Liquidity: Your second target (TP2) is a major swing high or low, or the high/low of a previous session.
Aiming for a risk-to-reward ratio of 1:2 or higher is a standard goal for this model.
Filters and Trade Context
The Unicorn Model works best when combined with specific market filters. Using this setup without context significantly reduces your success rate. Three main filters are essential:
- premium/discount zones,
- time-of-day alignment,
- and multi-timeframe structure.
Premium and Discount in the Dealing Range
The dealing range is the space between a major swing high and swing low on a higher timeframe. The midpoint of this range is known as the equilibrium.
- Premium Zone: The upper 50% of the range. Only look for bearish Unicorn setups here.
- Discount Zone: The lower 50% of the range. Only look for bullish Unicorn setups here.
A setup forming in the wrong zone, such as a bearish Unicorn in a discount area, is a low-probability trade that you should generally avoid.
Key Point:
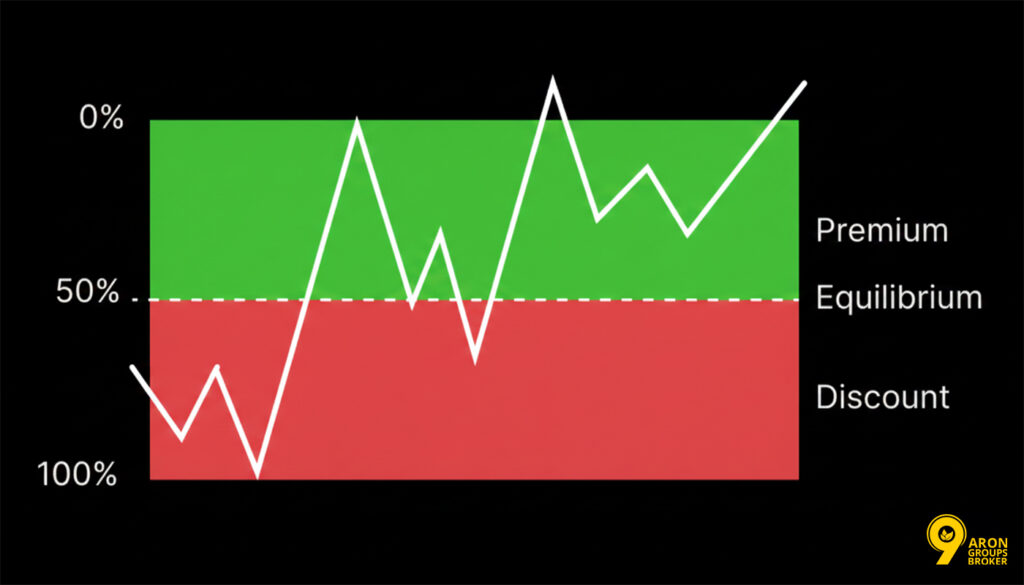
Always identify the higher timeframe dealing range (4-hour or Daily) before entering. Entering the correct zone is a non-negotiable filter for high-probability results.
Timing Trades: Kill Zones and Sessions
The market moves with the highest volume during Kill Zones. These are specific time windows when institutional activity is most intense. Unicorn setups that trigger during these periods are more likely to reach their targets.
| Kill Zone | Time (EST) | Reliability |
|---|---|---|
| London Open | 02:00 - 05:00 | High |
| New York Open | 07:00 - 10:00 | High |
| London Close | 10:00 - 12:00 | Moderate |
| Asian Session | 20:00 - 00:00 | Low (Avoid) |
Avoid entering trades outside these windows. Trading during low-volume periods increases the risk of fakeouts and choppy price action.
Multi-Timeframe Alignment for High-Probability Trades
A 5-minute Unicorn setup is much stronger if the 15-minute or 1-hour chart confirms the same direction. For the best results, ensure your timeframe logic matches:
- Bearish Bias: The 1-hour chart shows a downward trend.
- Alignment: The 5-minute chart forms a bearish Unicorn in a premium zone during the New York Kill Zone.
When all these filters align, you have a “High-Probability” setup. Removing a filter doesn’t always make a trade fail, but it does lower your statistical edge.
Q: Can I use the Unicorn model if the higher timeframe is in a range?
A: It is risky. The model works best when the higher timeframe has a clear “draw on liquidity” (a specific high or low it wants to reach).
Q: Should I change my Kill Zone times for Daylight Saving?
A: Yes. ICT concepts rely on New York local time. Always ensure your charts are synced to the correct EST/EDT offset.
Reversal vs Continuation Applications
The ICT Unicorn model is primarily a reversal framework, but it also works for continuation trades. Knowing the difference helps you read market conditions more accurately.
Classic Reversal Unicorn Trades
This is the most common use of the model. You take a trade against the current short-term trend after a liquidity sweep and MSS.
- Process: In an uptrend, price sweeps Buy-Side Liquidity, shifts structure to bearish, and creates an entry at the FVG-within-Breaker zone.
- Goal: Capture the trend change, often targeting Sell-Side Liquidity or discount levels.
- Why it works: The liquidity sweep shows that institutions collected buy-stops before pushing the price lower.
Continuation Unicorns in Trending Markets
You can also use the ICT unicorn strategy to join a strong existing trend after a pull-back.
- Process: In a bullish trend, price sweeps short-term Sell-Side Liquidity (a minor retracement), shifts back to the upside, and forms a Unicorn in a discount zone.
- Requirement: The higher-timeframe structure must remain bullish.
- Risk: The main danger is mistaking a major trend reversal for a simple continuation pull-back.
Important:
Always check the higher-timeframe structure for continuation trades. If the 1-hour chart has shifted bearish, a 5-minute bullish Unicorn is a dangerous counter-trend trade, not a continuation.
Q: Why is the continuation setup often faster than a reversal setup?
A: Because you are trading with the established momentum of the higher timeframe. The market already has a clear “Draw on Liquidity” in that direction.
Risk Management and Common Mistakes
Even a high-probability setup like the ICT Unicorn model requires discipline. Avoiding common errors is the key to maintaining a steady ICT unicorn model win rate.
Recognising Look-Alike Setups
The most common mistake is entering a trade that looks like a Unicorn but misses key structural rules.
- Missing Liquidity Sweep: Many traders spot an FVG inside a swing point and enter. If the original swing was never swept, it is not a Breaker Block. Without a sweep, the zone lacks institutional backing.
- Proximity vs. Confluence: A Breaker and an FVG near each other are not a Unicorn. The FVG must overlap or sit directly inside the Breaker Block range. Proximity alone does not equal confluence.
Avoiding Early Entry, Weak FVGs, and Ignoring Filters
Three major errors often lead to failed trades:
- Early Entry: Never enter at the moment of the Market Structure Shift (MSS). You must wait for the retracement back into the FVG. Entering early worsens your risk-to-reward ratio.
- Weak FVGs: Avoid gaps created by small, low-momentum candles. A valid Unicorn ict model requires “energetic” displacement that shows clear market intent.
- Ignoring Filters: A setup forming at 14:00 EST (outside a Kill Zone) or a bearish setup in a discount zone is low probability. Stick to the premium/discount and time filters strictly.
Performance Metrics and Win Rate
There is no fixed win rate for the ICT Unicorn model, as success depends on your discipline and the market you trade.
Many traders in the ICT community report win rates between 50% and 70% when every filter is used correctly. However, these figures are anecdotal and should be viewed as estimates rather than guaranteed projections.
Conditions That Improve Statistical Edge
Your “edge” increases when multiple factors align at once. A high-probability ICT unicorn setup usually features:
- A Clear Liquidity Sweep: A sharp, decisive wick taking out a high or low.
- Timeframe Alignment: An MSS occurring on the same timeframe as the liquidity sweep.
- Strong Displacement: An FVG created by an aggressive, high-momentum candle.
- Perfect Confluence: The FVG sits directly within the Breaker Block range.
- Ideal Timing: Entry triggered during a London or New York Kill Zone.
- Pricing Context: Proper alignment within the Premium or Discount zone.
- Trend Confirmation: Support from the higher-timeframe market structure.
Removing two or more of these conditions significantly weakens the structural logic of your trade.
Market Phases That Reduce Win Rate and Position Sizing
The unicorn model ict performs poorly in certain environments:
- Consolidation: Avoid low-volatility, choppy phases where price has no clear direction.
- News Events: Unscheduled news can cause spreads to widen, hitting stop-losses before the setup can play out.
- Low-Liquidity Windows: The period between the New York close and London open often produces false signals.
In these phases, it is best to reduce your position sizing or stay out of the market entirely.
Q: How much of my account should I risk on a single Unicorn setup?
A: While ICT does not set a fixed rule, standard risk management suggests risking 0.5%-1% of your account equity per trade. Your stop-loss distance should always define your position size, not the other way around.
Comparison and Backtesting
The ICT Unicorn model is a specialised tool. Understanding how it differs from other setups is key to mastering the ICT unicorn strategy.
Comparing Unicorn Model With Other ICT Trades (OTE, Breaker)
While many ICT setups share similarities, the Unicorn is unique due to its strict confluence requirements.
| Model | Core Requirement | Entry Location | Primary Context |
|---|---|---|---|
| Unicorn | FVG inside Breaker | FVG retracement | Reversal after sweep + MSS |
| OTE | Fibonacci zone | 61.8%-79% Fib | Continuation of the trend |
| Breaker | Broken swing structure | Return to Breaker | Reversal or continuation |
The Unicorn is more selective than a standard Breaker Block because it requires an FVG alignment. Unlike Optimal Trade Entry (OTE), which focuses on trend continuation, the Unicorn is primarily built for high-probability reversals.
Backtesting Tips: Sample Selection and Data Mark-Up
To verify the ict unicorn model’s win rate, you need a solid data set. Aim for 50-100 qualifying setups across various markets.
- Filter Strictly: Only include trades that meet all rules: sweep, MSS, displacement, and FVG-Breaker overlap.
- Avoid Hindsight: Mark charts from left to right as if trading live. Do not work backwards from a known winning trade.
- Track Variables: Record the session, premium/discount zone, and timeframe for every sample.
Conclusion
The ICT Unicorn Model is one of the most structured frameworks in the ICT toolkit. Its power comes from the required sequence: a liquidity sweep, a market structure shift, and the convergence of a Breaker Block and an FVG.
This model requires a deep understanding of why prices move. A swept liquidity level reveals institutional intent, while the FVG-within-Breaker zone shows where the market is likely to reprice.
When used within Kill Zones and aligned with higher-timeframe bias, the Unicorn provides a repeatable, high-probability approach to trading market reversals.