


Many indicators are either too reactive or give delayed signals, but the KST indicator combines multiple rate of change (ROC) averages. This method aims to provide a balanced and reliable view of the overall trend. The indicator shows both the strength and direction of price movement. Its multi-layered structure also produces accurate entry and exit signals.
Whether you trade stocks, Forex, or cryptocurrencies, understanding the KST indicator can improve your trading strategy. This article covers all aspects of this tool, including its practical uses. Stay with us until the end.

- The KST indicator, short for Know Sure Thing, is a momentum oscillator designed to interpret price rate of change data.
- Trading signals are generated when the KST line crosses the signal line; traders also monitor overbought and oversold conditions.
- Many traders combine the KST indicator with other technical analysis tools to increase their chances of successful trades.
What is the KST Indicator?
The KST indicator, or Know Sure Thing, is a momentum oscillator used to identify price trends and their strength. It was developed by Martin Pring, a renowned financial market analyst, in the early 1990s.
The KST indicator measures the rate of price change across multiple timeframes. It combines these measurements to provide a clearer view of market trends. Simply put, when prices move strongly, the KST indicator detects this momentum and shows whether a trend is developing.
In technical analysis, the KST indicator helps traders spot potential trend changes before they appear on price charts. It typically includes a main line and a signal line. When these lines cross, it can signal a buying or selling opportunity.
Compared to the MACD indicator, which uses only two time periods, the KST indicator incorporates more data. This makes it a better tool for analysing complex trends. As a result, the KST indicator is highly favoured by professional traders and trend analysts.
How the KST Indicator is Calculated
To understand how the KST indicator works, we must first learn about the rate of change (ROC). ROC measures the price change from today compared to several days ago.
The KST indicator uses four different rates of change to combine short- and long-term price fluctuations. These timeframes are usually 10, 15, 20, and 30 days. For example, the price change over the past 10 days is measured, and the same is done for the other periods.
The calculation doesn’t stop here. Each rate-of-change value is smoothed using a simple moving average. A 10-period moving average is applied to the first three ROC values, and a 15-period moving average is applied to the fourth ROC.
Next, each value is multiplied by a specific coefficient. The first ROC is multiplied by 1, the second by 2. The third ROC is multiplied by 3, and the fourth by 4. These values are then added to produce the KST indicator, which shows price movement strength.
For example, suppose the smoothed values are 2, 1.5, 1, and 0.5. After multiplying and adding them, the result is 10. This number represents the KST indicator value. A 9-period moving average is then applied to this number, creating the signal line. This line helps traders identify entry and exit points.
Traders don’t need to perform these calculations manually, as tools like TradingView and MetaTrader automatically calculate them. However, those interested in learning more can visit websites such as Stockcharts for detailed resources.

Key Insight
The KST indicator combines multiple rate of change values and uses moving averages to provide a clearer picture of market momentum and direction. This helps traders identify trends more effectively.
How the KST Indicator Works
The KST indicator is a simple and practical tool in technical analysis that helps traders understand market trends. It also helps identify optimal buy and sell points. The indicator provides information about trend strength and direction through its main lines.
- the KST line,
- the signal line.
Below, we explain how to analyze these lines and identify trend changes.
How to Interpret the Main Lines of the KST Indicator
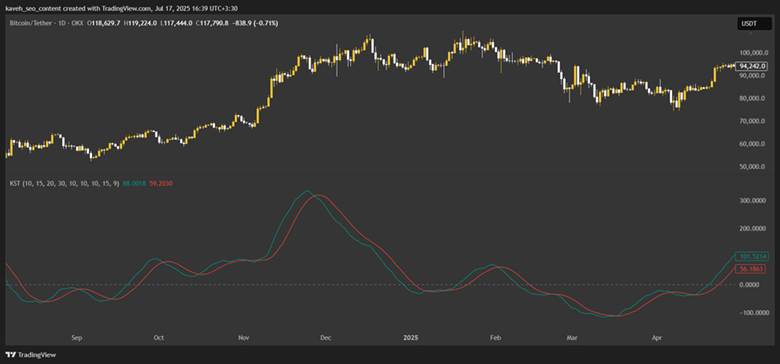
The KST indicator consists of two main lines: the KST line (usually green) and the signal line (typically red). These lines oscillate around the zero line. When the KST line is above zero, it signals a bullish trend. When it is below zero, it indicates a bearish trend. A positive KST line indicates buyers are in control, while a negative KST line suggests sellers are in control.
A key aspect of interpreting the KST lines is identifying divergence. Divergence occurs when price forms a new peak or trough, but the KST moves in the opposite direction. This may signal a weakening trend. For instance, if the price reaches a new low but the KST line doesn’t confirm it, this forms a bullish divergence. This often signals a potential market reversal and is valuable for traders.
Read more: Know Sure Thing (KST)
How to Identify Trend Changes and Receive Trading Signals in the KST
To identify trend changes, focus on the crossover between the KST and signal lines. When the KST line crosses above the signal line from below, it generates a potential buy signal. This is especially valid when both lines are above the zero line.
Conversely, if the KST line crosses below the signal line, it may indicate a selling opportunity. The KST indicator, when used alongside trend indicators such as moving averages or the ADX, can provide stronger confirmation of market trends.
However, unlike indicators such as the RSI, the KST does not precisely identify overbought or oversold levels because it lacks specific upper and lower bounds. This limitation means traders may need to use additional tools to confirm signals. For example, in a stock chart, if the KST line creates an upward crossover in the positive zone, it may signal the continuation of an uptrend.
Q: How can the slope of the KST indicator be used to filter out weak trading signals?
A: Most traders focus only on KST crossovers, but the slope of the KST line is often more critical. A crossover with a flat or weak slope usually signals low momentum and a higher risk of false entries. In contrast, crossovers accompanied by a sharp upward or downward slope indicate strong acceleration and higher-quality trading opportunities.
How to Receive Buy and Sell Signals with the KST Indicator
The KST indicator gives buy and sell signals using the KST line and the signal line. Below, we explain how to interpret buy and sell signals and the importance of combining KST with other tools.
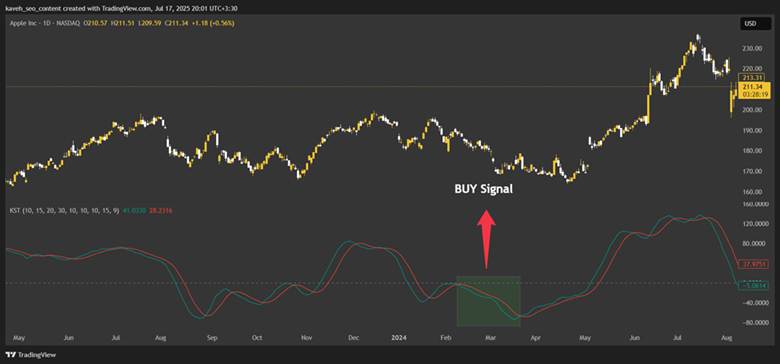
Buy Signal with KST
A buy signal occurs when the KST line (green) crosses above the signal line (red) in the positive zone (above the zero line). This crossover signals increasing bullish momentum. For example, on Apple’s daily chart, if the KST line crosses above the signal line in the positive zone, a buy opportunity arises.
A steeper, vertical crossover makes the signal stronger, showing high market acceleration. Stronger signals perform better in trending markets. For confirmation, volume analysis or price patterns can be checked.
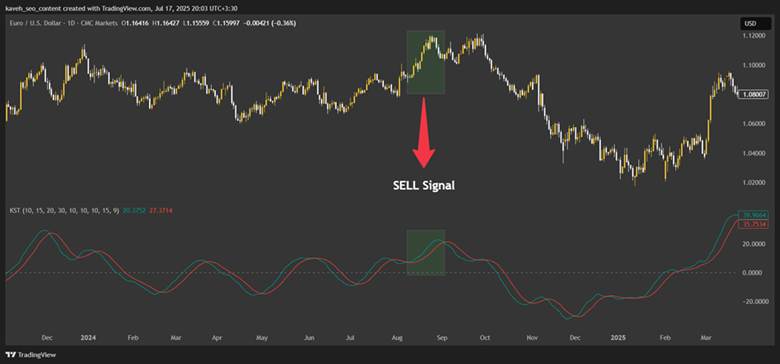
Sell Signal with KST
A sell signal occurs when the KST line crosses below the signal line from above, and both are in the negative zone (below zero). This indicates bearish momentum. For example, in the EUR/USD one-hour chart, if the KST line crosses below the signal line in the negative zone, a sell signal appears.
Note that zero line crossovers may have a delay. It’s better to focus on signal line crossovers. Checking candlestick patterns or resistance levels can strengthen the signal.
Combining the KST Indicator with Other Technical Tools for Signal Confirmation
To reduce false signals, combine the KST indicator with tools like RSI, MACD, or Bollinger Bands. For example, if the KST gives a buy signal and the RSI exits the oversold zone, the trade’s success probability increases. If Bollinger Bands indicate a price breakout, the KST signal becomes stronger. Combining tools helps make more accurate decisions and avoid costly mistakes.
Advantages and Disadvantages of Using the KST Indicator
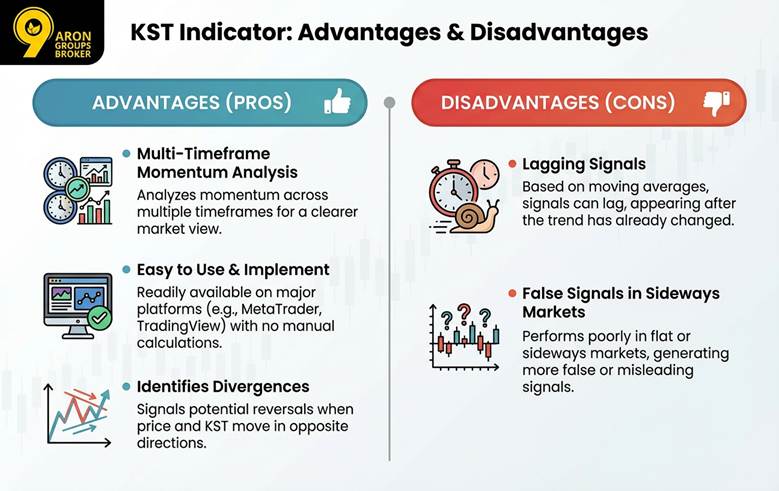
The KST indicator is a useful tool in technical analysis with several key advantages. One key benefit is its ability to analyse momentum across multiple timeframes. This helps traders get a clearer picture of market direction. Additionally, the KST indicator is easy to use on most trading platforms, such as MetaTrader and TradingView, with no need for manual calculations.
Another advantage of the KST indicator is its ability to identify divergences between price and the indicator. When price creates a new peak or trough, but the KST doesn’t follow, this divergence may signal weakening momentum and a potential reversal. Many traders find this feature highly valuable.
However, the KST indicator has its limitations. Since it’s based on moving averages, it tends to lag, and signals may appear after a trend change. It also performs poorly in flat or sideways markets, where it may generate more false signals.
Below is a table summarising the advantages and disadvantages of the KST indicator:
| Advantages | Disadvantages |
|---|---|
| Analyzes momentum across multiple timeframes | Inherent delay due to moving averages |
| Easy to use on trading platforms (e.g., TradingView) | Weaker performance in sideways or range-bound markets |
| Identifies divergences between price and indicator | Higher chance of false signals in imbalanced conditions |
| Useful for identifying and confirming trend changes | Needs to be combined with other tools for higher accuracy |
| Helps better understand market direction and strength | Cannot be used alone as the sole basis for trading decisions |
Q: Can the KST indicator help identify accumulation or distribution phases before major breakouts?
A: Yes. When price moves sideways while the KST forms higher lows or lower highs, it often signals hidden accumulation or distribution. This behaviour suggests smart money positioning and often precedes strong directional breakouts, especially in Forex and crypto markets.
Key Insight
Although the KST indicator is inherently lagging, it can exhibit semi-leading characteristics when rate of change (ROC) periods are selected with asymmetrical intervals.
Key Tips for Optimizing and Accurately Using the KST Indicator
To use the KST indicator effectively in technical analysis, select the right settings, avoid false signals, and choose suitable timeframes. Below are three key tips to enhance the accuracy of the KST indicator.
Best KST Indicator Settings for Accurate Signals
The default settings of the KST indicator include four ROC periods: 10, 15, 20, and 30. It also uses four simple moving averages (SMA) with periods of 10, 10, 10, and 15. Additionally, a 9-day period is used for the signal line.
This setup works well on daily or weekly charts. For Forex or short-term trades, you can fine-tune these parameters. For instance, reduce the periods for scalping or increase them for long-term strategies to improve signal accuracy.
Methods to Reduce Errors and Avoid False Signals in KST
To avoid false signals, analyze line crossovers carefully. Crossovers with vertical angles or high fluctuations are more reliable. Using additional filters like volume, support or resistance lines, and checking divergences between the KST indicator and price can improve signal strength. The KST indicator alone isn’t enough; it should be combined with market data and complementary tools.
Choosing the Right Timeframes for Analysis with the KST Indicator
The timeframe you select impacts the accuracy of the KST indicator signals. For Forex day trading, shorter timeframes, like 15-minute or 1-hour charts, offer quicker signals. For long-term stock trading, daily or weekly timeframes reduce market noise.
Using multiple timeframes (e.g., 1-hour and 4-hour charts in Forex) is also recommended for confirming trends. For example, if the KST indicator signals a buy on the 4-hour chart and the daily chart is bullish, success chances improve.
Q: How can the KST indicator be used as a timing filter to avoid low-quality trades?
A: The KST indicator can highlight periods when traders should avoid entering the market. When KST contracts around the zero line and volatility is reduced, the market is typically in a transition or waiting phase. Even valid price patterns tend to perform poorly in these conditions. Using KST as a timing filter helps eliminate low-probability trades and improves overall consistency.
Conclusion
The KST indicator is valuable for traders, especially in analysing hidden trends and momentum. Its effectiveness comes from combining it with other tools and experience. Beginners should practice on a demo account to simulate market conditions and better understand the KST indicator. Continuous learning and referring to reliable resources are key to becoming a professional trader.


