A liquidity trap is a strategic market setup that misleads traders into positions benefiting larger participants. These traps often occur near key support and resistance levels, exploiting behavioral biases and stop-loss clusters. Mastering how to identify liquidity traps can help you avoid costly mistakes and turn deceptive market moves into profitable opportunities—making this guide essential for every serious trader.

- In a liquidity trap, traders often mistake cheap credit for opportunity, but in reality, capital gets stuck rather than flowing.
- High liquidity with low velocity of money creates fake confidence for short-term traders.
- Liquidity traps punish leverage traders the most, as borrowed capital fails to generate expected returns.
- For swing traders, liquidity traps distort signals, making overbought or oversold conditions appear meaningless.
- Liquidity traps teach traders that sometimes the biggest risk isn't volatility, but stagnation.
Liquidity Trap vs. Fake Breakout: Key Differences
At first glance, a liquidity trap and a fake breakout may seem similar, but the critical distinction lies in intent and market mechanics.
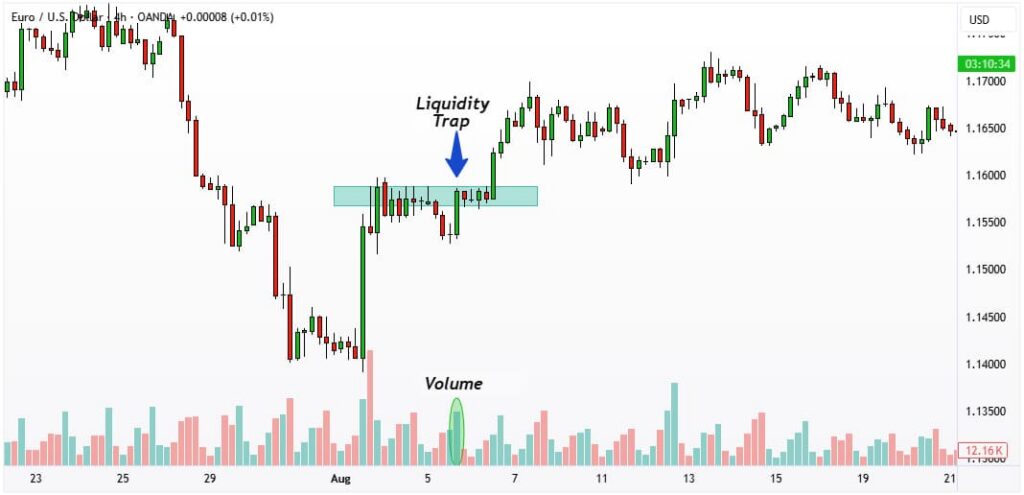
- A liquidity trap is a deliberate market setup designed to target stop-loss levels and liquidity pools, allowing large traders, often referred to as “whales,” to profit from the positions of retail traders. It usually occurs near key support or resistance zones and exploits common behavioral biases, such as chasing breakouts or clustering stop-loss orders.
- A fake breakout, by contrast, is usually a temporary violation of support or resistance that may appear convincing but does not inherently aim to capture liquidity. Fake breakouts can result from normal market volatility or insufficient momentum, rather than deliberate manipulation.
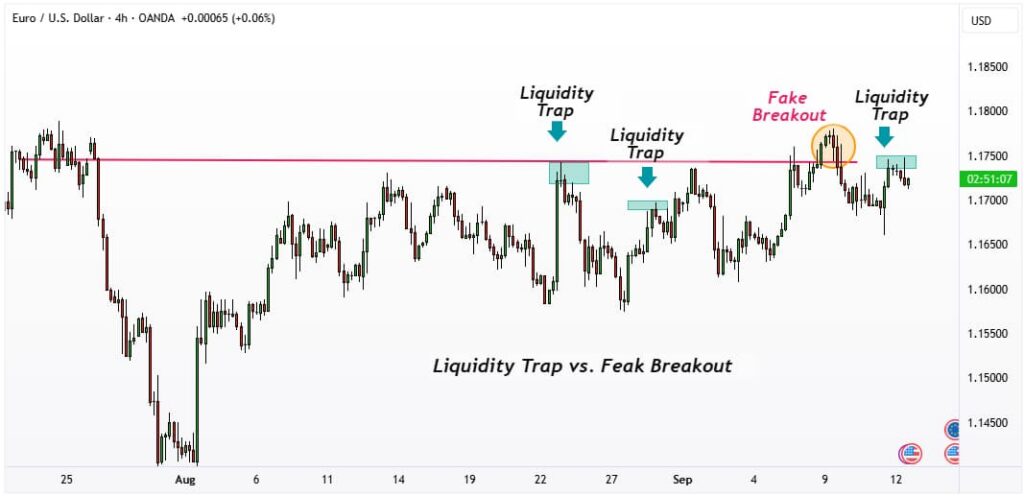
Understanding these differences is crucial for price action traders, as it enables them to distinguish between genuine trading opportunities and deceptive market moves, reducing the likelihood of losses and improving risk management.
Types of Liquidity Traps in Financial Markets
Buy Trap
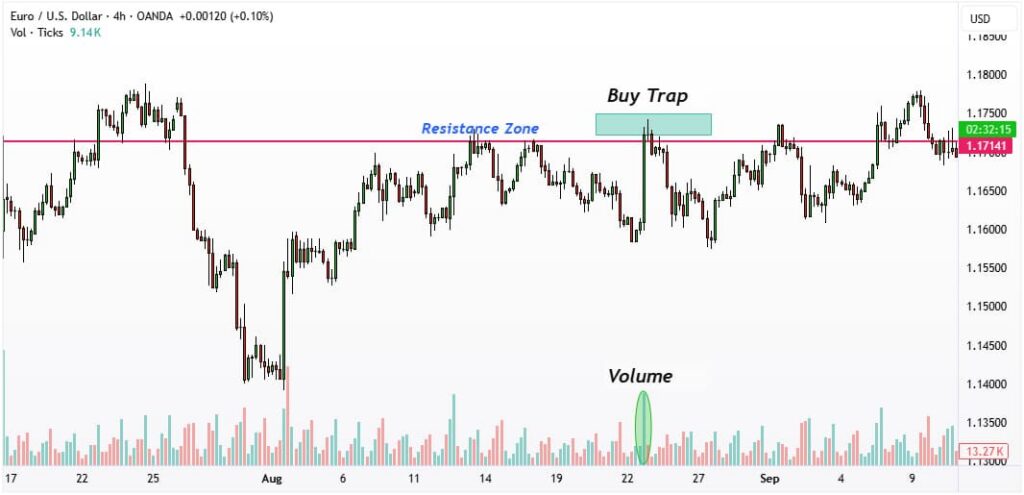
A buy trap occurs when the price briefly breaks above a resistance level, enticing traders to enter long positions prematurely. Once liquidity is captured—often from clustered stop-loss orders above the breakout—the price sharply reverses, causing losses for retail traders while benefiting larger participants.
Key Identification Factors:
- Volume spikes that are disproportionate to regular trading activity;
- Rapid reversals immediately after the breakout candle closes;
- Candlestick rejection patterns, such as long upper Shadows or bearish engulfing formations.
Sell Trap
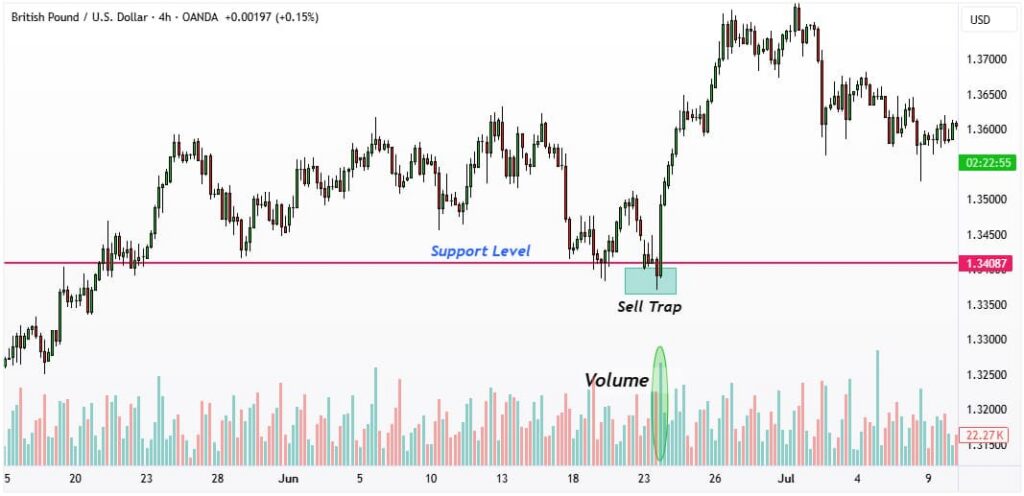
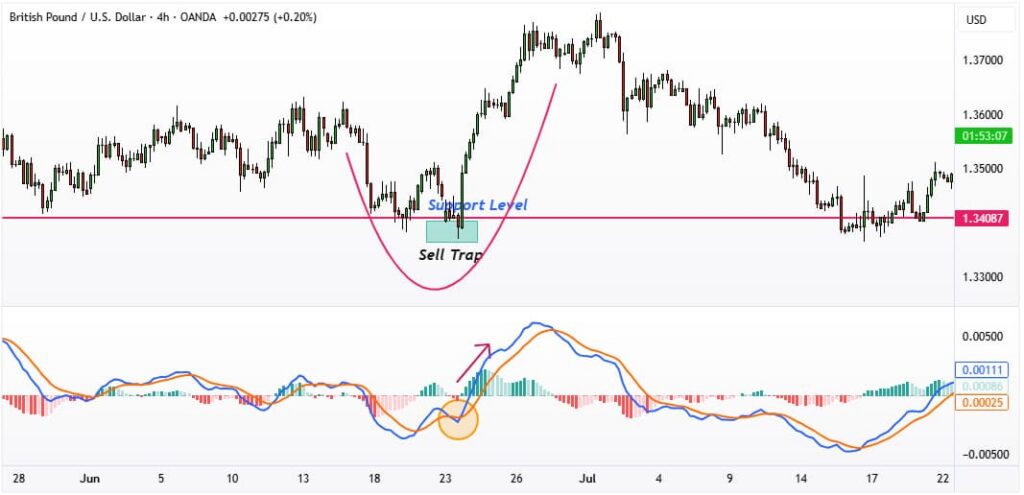
A sell trap forms when the price briefly breaks below a support level, enticing traders to initiate short positions. Once stop-loss orders are triggered, larger traders absorb liquidity, and the price often reverses sharply back above its support level.
Best Practices to Confirm a Sell Trap:
- Analyze the trend context to determine if the breakout aligns with the overall market direction.
- Look for candlestick rejection patterns, such as hammer or bullish engulfing candles, near the support zone.
- Verify with volume analysis; low or unusually high volume can indicate manipulation or liquidity capture.

Scalpers suffer in liquidity traps because spreads tighten, but price action remains dead.
How Liquidity Traps Deceive Traders
Liquidity traps are carefully orchestrated market setups designed to mislead traders into taking positions that generate liquidity for larger participants. Understanding how these traps work is crucial for retail traders to avoid being caught in false breakouts and protect their capital. These traps exploit behavioral biases, clustered stop-loss orders, and the tendency of traders to chase momentum. By analyzing volume patterns, candlestick formations, and key support/resistance levels, traders can recognize potential liquidity traps before entering trades.
Liquidity Traps Created by Whales Using High Volume
Large market participants, often called “whales”, can manipulate price by generating unusually high trading volume during breakouts. This high-volume manipulation attracts retail traders to enter positions prematurely, creating a pool of liquidity that whales can use to execute their orders. The result is often a rapid price reversal that traps inexperienced traders.
Key Points for Traders:
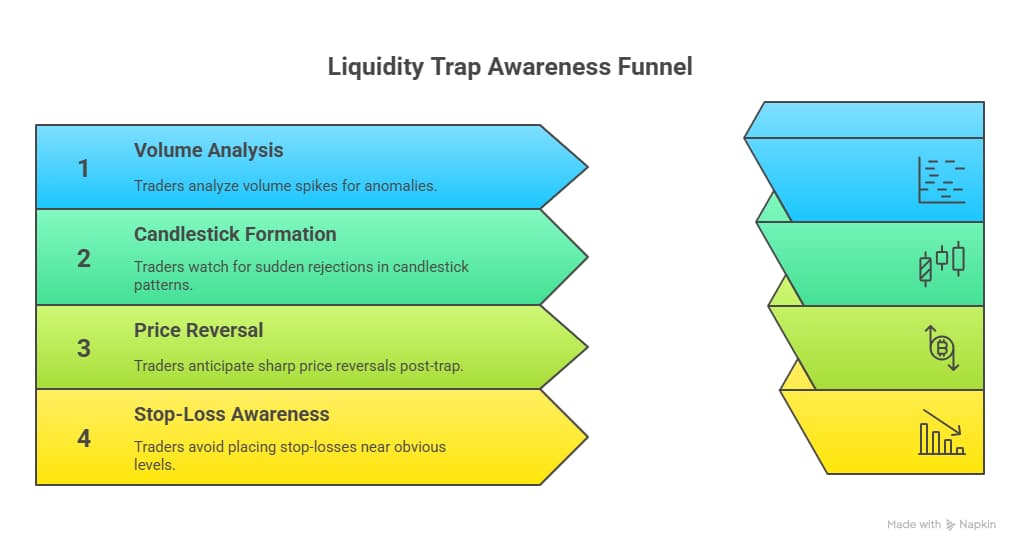
- Look for abnormal volume spikes that do not correspond with news or market fundamentals.
- Observe candlestick formations for sudden rejections near key levels.
- Use charts to identify repeated patterns of whale-driven liquidity traps.
Price Behavior After a Liquidity Trap and Misleading Fakeouts
After a liquidity trap, prices often retrace sharply in the opposite direction of the initial breakout. Traders who misinterpret the first move as a true breakout may experience losses or get caught in fakeout patterns. Recognizing post-trap price behavior is crucial:
- Watch for rapid reversals immediately after stop-loss clusters are triggered.
- Confirm trend continuation using volume analysis and secondary indicators, such as RSI or MACD.
- Identify when the market has absorbed liquidity before planning the next trade entry.
Stop-Loss Orders as Liquidity Targets
Stop-loss orders of retail traders often form liquidity pools that larger participants exploit. By pushing prices toward these levels, market whales can fill large orders efficiently before resuming the primary trend. Traders should:
- Be cautious of price movements targeting standard stop-loss zones.
- Use technical analysis to predict where liquidity clusters are likely to form.
- Avoid placing tight stop-losses near obvious support/resistance levels in highly manipulated markets.

Options traders often misprice volatility during liquidity traps, expecting moves that never come.
How Traders Can Avoid Liquidity Traps
To avoid liquidity traps, traders should:
- Avoid chasing breakouts unthinkingly;
- Combine price action analysis with volume signals to enhance your trading strategy;
- Identify clusters of stop-loss orders;
- Wait for confirmation signals before entering trades.
These methods reduce the risk of falling into traps and help preserve trading capital.
Trading Strategies Based on Liquidity Traps
Entering Trades After a Fakeout
Wait for confirmation after a fake breakout before entering trades.
- Example: After a buy trap above resistance, enter a long position once support is confirmed.
- Use charts and visual examples to identify ideal entry points.

Liquidity traps highlight the danger of confusing monetary supply with actual market demand.
Using Liquidity Traps as Reversal Signal Confirmation in Trends
Liquidity traps can also serve as confirmation for trend reversals.
- Example: A sell trap at the end of a bullish trend signals a potential short opportunity.
- Combining traps with technical indicators, such as RSI or MACD, can enhance accuracy and timing.
Conclusion
Liquidity traps are powerful tools used by large market participants to capture liquidity and mislead traders. By recognizing buy and sell traps, analyzing volume patterns, and applying confirmation-based trading strategies, traders can protect their capital, avoid false breakouts, and improve profitability in financial markets.


