Traders seek ways to easily identify market trend changes and make more confident decisions for buying or selling. One effective method is the MA Cross Indicator. This tool compares moving averages across different timeframes to show when a price reversal is likely. Its simplicity makes it popular with both beginners and professional traders.
In this article, we explain how the MA Cross Indicator works and how it helps you get more accurate signals for entry and exit. We recommend reading until the end.
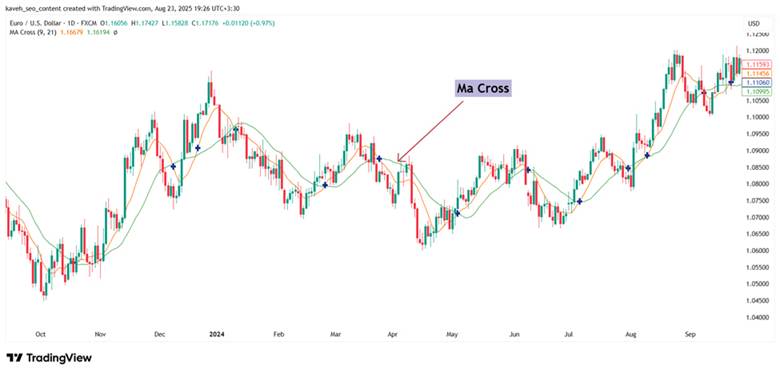
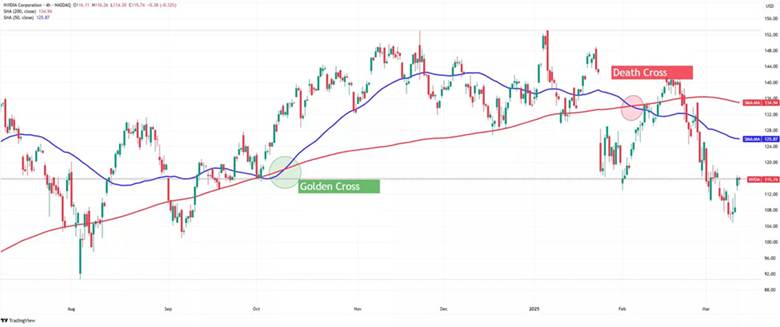
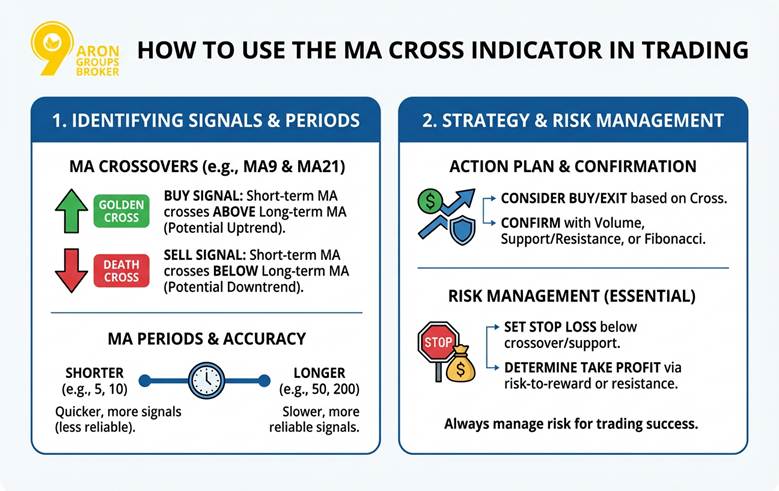
- The MA Cross Indicator is based on the crossover of two moving averages and helps identify potential price trend reversals.
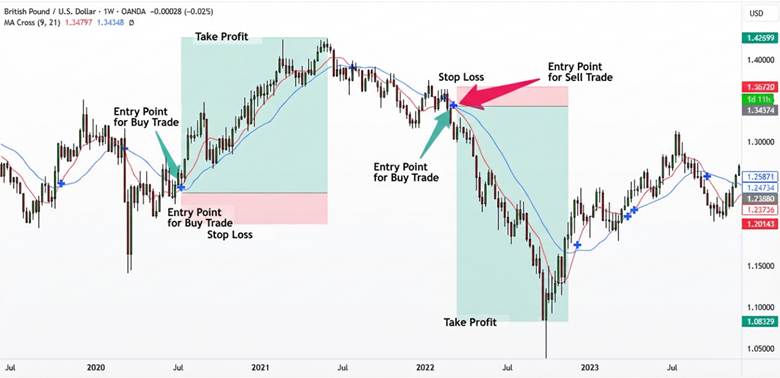
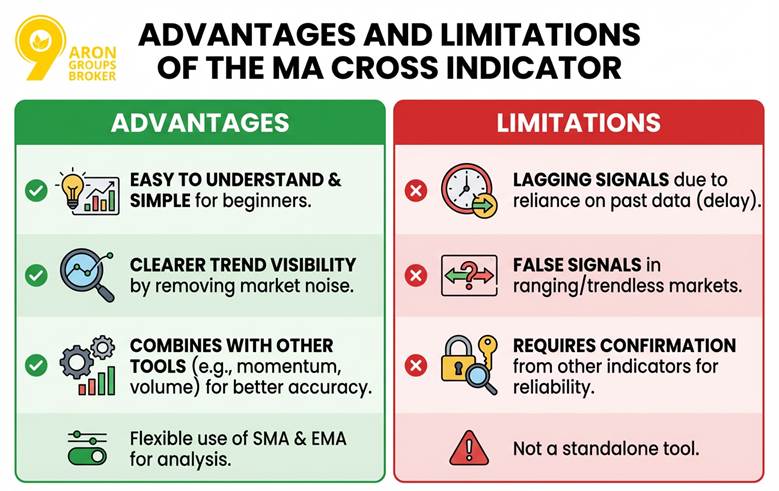
- This indicator allows traders to easily mark potential entry and exit points on the chart, providing a clearer market view.
- The accuracy of signals depends on choosing the right type of moving average, such as SMA or EMA, and their timeframes.
- Using the MA Cross alone is not enough; for more reliable decisions, it should be combined with other technical analysis tools and risk management principles.
What is the MA Cross Indicator and How Does It Work?
Traders often use the MA Cross Indicator to identify price trend reversals in the market. This indicator works by comparing two moving averages with different timeframes:
- The short-term moving average responds faster to recent price changes.
- The long-term moving average shows the overall market trend.
When these two lines cross, signals for entry or exit appear.
Different methods are used to calculate the averages. The Simple Moving Average (SMA) gives equal weight to all price data, producing a smooth result. The Exponential Moving Average (EMA) gives more weight to recent data and reacts more quickly to market changes. This difference allows traders to choose the most suitable type of moving average.
Advanced Key Insight:
A confirmed MA crossover is usually a lagging signal, reflecting structural market imbalance after passive liquidity is absorbed, rather than predicting reversals.
The MA Cross Indicator is primarily used to identify bullish and bearish trends. However, it also helps traders spot entry and exit points. This tool can help avoid the influence of short-term market noise. For beginners and experienced traders, it’s a simple yet effective tool for confirming trends in professional trades.
Source Box
According to LuxAlgo, adding a third moving average (Triple MA) instead of the usual two can improve trend confirmation and reduce the likelihood of false signals.
How to Use the MA Cross Indicator in Trading
Traders use the MA Cross Indicator to identify new trends or confirm ongoing price movements. It compares two moving averages with different timeframes, making it easy and practical. This tool helps traders spot price reversals and make more confident entry or exit decisions.
How to Identify and Analyze Moving Average Crossovers (MA Cross)
When a short-term moving average crosses above a long-term moving average, it indicates buyer strength and a potential uptrend. This is called the Golden Cross. In contrast, when the short-term moving average crosses below the long-term one, it signals a potential downtrend, known as the Death Cross.
On platforms like TradingView, combinations such as MA9 and MA21 are used to detect these crossovers quickly. This helps traders spot early signs of market change and prepares them for better decision-making.
How to Identify Bullish and Bearish Signals in MA Cross
The Golden Cross usually marks the start of a long-term uptrend, and many investors view it as a buying signal. On the other hand, the Death Cross signals a price decline and may indicate the need to exit or begin selling.
Both signals are based on past data and may have some delay. Traders often confirm these signals with other tools, such as volume or support/resistance levels, for more accuracy.
The Impact of Choosing Different Moving Average Periods on Signal Accuracy
A key aspect of using the MA Cross Indicator is selecting the right moving average periods. Shorter periods, like 5 or 10 days, generate quicker signals but may also produce more false signals. Longer periods, like 50, 100, or 200 days, respond more slowly but yield more reliable and stable signals.
Shorter periods suit short-term traders or swing traders, while longer periods are ideal for those focusing on major, long-term trends. The choice depends on trading style and risk tolerance.
Q: How does timeframe selection affect the reliability of MA Cross signals?
A: Timeframe selection plays a critical role in the effectiveness of MA Cross signals. Higher timeframes such as daily or weekly charts generally produce fewer but more reliable signals due to reduced market noise. Lower timeframes generate more frequent crossovers, but many of them may lack follow-through. Professional traders often align MA Cross signals across multiple timeframes to ensure that short-term entries are supported by higher-timeframe trends.
Determining Entry and Exit Points with the MA Cross Indicator
The MA Cross Indicator helps determine optimal entry and exit points. A Golden Cross often leads traders to consider buying. Some traders wait until the crossover is confirmed, meaning the price stays above the averages for several candles.
The Death Cross signals a potential exit. Some traders close their position entirely, while others secure partial profits and leave part open, minimizing losses if the downtrend continues. Combining these signals with support/resistance levels or Fibonacci tools makes decision-making more accurate.
Pro Tip
According to the ForexTester website, to improve entry points, use the "Pullback" strategy. After a crossover, wait for the price to return to the moving average before entering the trade to avoid false signals.
Setting Stop Loss and Take Profit Levels in MA Cross Trades
Take-profit and stop-loss levels are crucial. Traders typically place a stop loss just below the crossover point or near a support level. This helps limit losses if the trend reverses.
Take profit levels can be determined using risk-to-reward ratios or key resistance levels, including Fibonacci retracements. Risk management is essential for ensuring steady trading success. Even with strong signals, ignoring risk management increases the chances of loss.
Advantages and Limitations of the MA Cross Indicator
The MA Cross Indicator is popular among many traders due to its simplicity and ease of understanding. It helps traders better spot market trend changes and make more confident decisions for entry or exit. However, like any tool, the MA Cross Indicator has both strengths and limitations that are important to understand.
Advantages of the MA Cross Indicator:
There are several reasons why this indicator is popular among both beginner and professional analysts:
- Easy to understand, especially for beginners with limited market experience.
- Allows clearer visibility of the main price trend by removing short-term market noise with two moving averages.
- Can be combined with other tools, such as momentum indicators or volume, to increase signal accuracy.
- Choosing between the Simple Moving Average (SMA) and Exponential Moving Average (EMA) can further enhance analysis quality.
Limitations of the MA Cross Indicator:
Despite these advantages, there are limitations that traders need to consider:
- Since the calculations are based on past data, signals appear with some delay, making the indicator lag.
- In markets without a clear trend, where prices are in a range, there is a higher chance of false signals.
- The indicator requires confirmation through other tools or indicators to ensure more reliable signals.
Q: Can the MA Cross Indicator be used effectively in different market conditions such as trending vs ranging markets?
A: The MA Cross Indicator performs best in trending markets where price moves directionally for a sustained period. In strong uptrends or downtrends, crossovers tend to be more reliable and lead to longer-lasting trades. However, in ranging or sideways markets, frequent crossovers can occur without meaningful price movement, increasing the risk of whipsaws. In such conditions, traders often filter MA Cross signals by first identifying market structure or using trend-strength indicators like ADX.
Source Box
According to Stockcharts, although crossovers are a simple tool, they may provide false signals in ranging markets. Therefore, they should not be relied upon solely and should always be used alongside market conditions.
Q: Is the MA Cross Indicator more suitable for trend-following or reversal trading strategies?
A: The MA Cross Indicator is primarily designed as a trend-following tool rather than a pure reversal indicator. Crossovers usually confirm that a trend has already begun rather than predicting the exact turning point.
While early crossovers may appear near reversals, traders use the MA Cross to stay aligned with established momentum. For reversal trading, additional confirmation tools, such as divergences or price action patterns, are usually required.
Conclusion
Overall, the MA Cross Indicator is a vital technical analysis tool that helps traders identify trend direction and potential entry or exit points. Combining two moving averages with different timeframes provides a clearer view of price behaviour. However, this tool has limitations due to its nature and cannot guarantee success in trading on its own. The best results are achieved when this indicator is used alongside complementary methods and proper risk management principles.