The MACD and alligator strategy is a simple method that helps traders understand when a market may start moving up or down. It combines the MACD indicator, also called Moving Average Convergence Divergence, with the Bill Williams Alligator indicator to spot trends and measure momentum.
Even if you are new to trading, this approach can help you read price movements with more confidence. In this guide, you will learn how these tools work together and how to apply them step by step, so keep reading to build a clearer trading foundation.
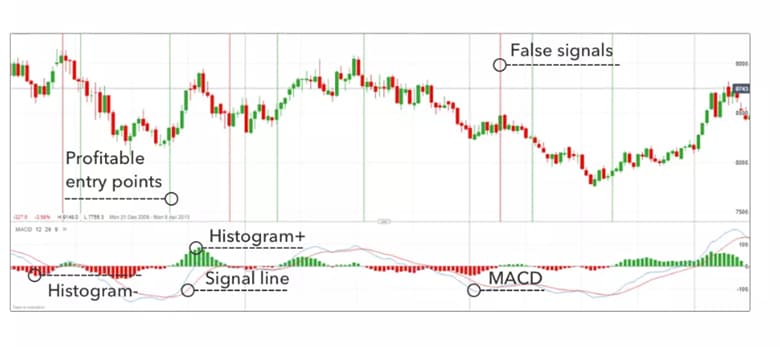
- Combining the MACD indicator with Alligator enhances trend filtering, reducing risks in dynamic financial markets.
- The MACD and alligator strategy builds trader confidence through momentum confirmation and clear market phases.
- Prioritising aligned signals from both tools minimises false entries, promoting sustainable trading practices.
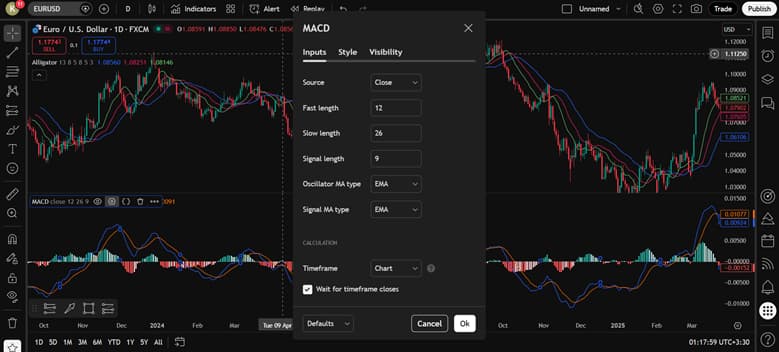
- Optimising settings for Alligator lines and MACD crossover improves decision-making across various assets.
How the MACD and Alligator Strategy Works
The MACD and Alligator strategy combines trend detection with momentum analysis. The Alligator indicator spots market trends and ranges. The MACD indicator confirms entry points through momentum shifts.
Default settings include MACD at 12, 26, and 9 periods. Alligator uses 13, 8, and 5 periods for its lines. In real-time, Alligator filters non-trending markets, while MACD triggers signals during pullbacks.
According to TradingRush, the Alligator on higher timeframes effectively filters range markets for MACD entries. This synergy enhances signal reliability in trending conditions.
Key Point:
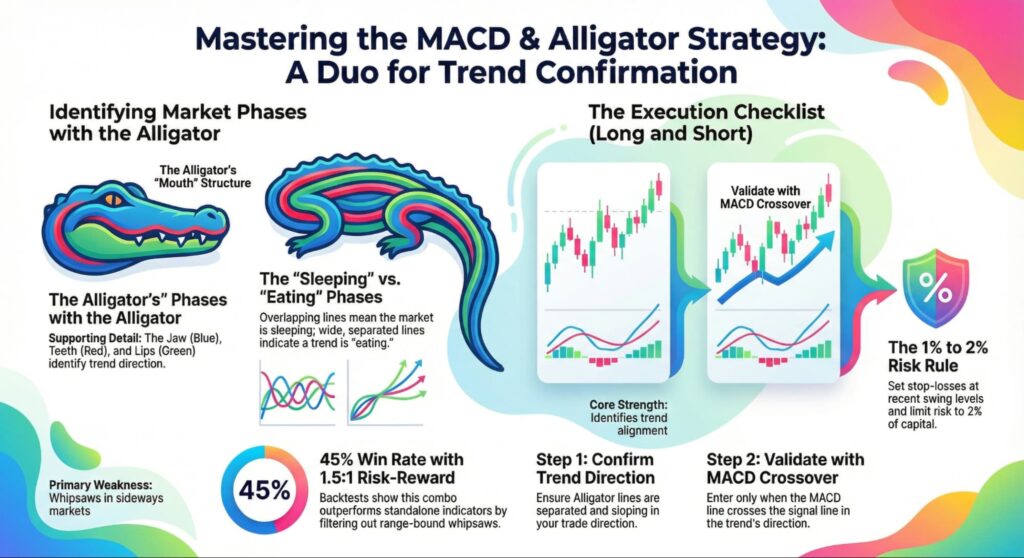
This duo achieved a 45% win rate in backtests with a 1.5:1 risk–reward.
| Aspect | Standalone MACD | Standalone Alligator | Combined MACD and Alligator |
|---|---|---|---|
| Strengths | Detects momentum shifts via crossovers. | Identifies trends through line alignment. | Filters false signals in ranges. |
| Weaknesses | Prone to whipsaws in sideways markets. | Lags in fast reversals. | Improves accuracy but requires multi-timeframe setup. |
| Win Rate Example | Around 40% in tests. | Varies by market phase. | Up to 45% with proper filtering. |
Among bill williams indicators, the Alligator stands out for its trend-filtering role.
Understanding the MACD Indicator: Signal Line and Histogram
The MACD indicator relies on two exponential moving averages. These are the 12-period fast EMA and 26-period slow EMA. Subtracting the slow from the fast creates the MACD line.
The signal line is a 9-period EMA of the MACD line. Crossovers occur when MACD crosses this line. Bullish crossovers suggest buying momentum.
The histogram shows the difference between MACD and the signal line. Positive bars indicate upward strength. Negative bars show downward pressure.
In forex, for EUR/USD, a bullish crossover above zero signals uptrends. For GBP/JPY, bearish crossovers below zero highlight downtrends.
Q: How does the histogram predict reversals?
A: Widening bars show building momentum in the current direction. Narrowing bars indicate weakening trends. This helps avoid early exits. Always confirm with volume indicators for accuracy.
Bill Williams Alligator: Jaw, Teeth, and Lips Structure
The Alligator consists of three smoothed moving averages. The jaw is a 13-period line shifted by 8, often blue. It represents the slowest component.
The teeth use an 8-period line shifted by 5, typically red. This middle line follows market balance. The lips are a 5-period line shifted by 3, usually green, as the fastest.
Shifts project lines forward for smoother visuals. The metaphor mimics an alligator: sleeping when lines intertwine, awakening as they separate.
Colours aid quick identification: blue jaw, red teeth, green lips. Uptrends form when lips cross above the teeth and jaw.
The usual colours help fast identification: blue for the Jaw, red for the Teeth, and green for the Lips.
Forex adjustment idea for beginners:
- Keep defaults on higher timeframes to reduce noise.
- Consider only minor tweaks on very low timeframes, then retest.
Warning:
Faster settings can increase signals, but also increase false starts in choppy ranges.
Why Combining MACD and Alligator Improves Accuracy
Used together, the Alligator avoids many sideways conditions, and MACD improves entry timing once a trend is active. This reduces “late entries” and cuts some false signals that appear during consolidation.
Benefits traders typically seek:
- Fewer trades during range markets, thanks to the Alligator filter
- More structured entries, using MACD crossover confirmation
- Clearer trend participation while the Alligator mouth opening stays wide
According to Fidelity, MACD is derived from the relationship between EMAs and helps assess momentum shifts, which complements a trend filter.
More Info:
In crypto, this combo can help interpret volatility spikes more clearly than using MACD alone, because the Alligator highlights whether a move is likely trending.
Market Phases and Trend Alignment
The MACD and alligator strategy synchronises with market cycles by identifying ranges and trends. Alligator detects phases, while MACD validates momentum within them.
This alignment aids traders in stocks like Apple, where upward phases signal buys during earnings-driven rallies.
For Tesla stock, downward phases indicate shorts amid volatility spikes. The approach suits various assets, enhancing decision-making. This strategy proves versatile for forex and crypto markets.
Alligator Market Phases Explained
The Bill Williams Alligator maps three simple stages you can spot at a glance. When Alligator lines overlap, the market is “sleeping,” and price often chops sideways.
When the lines separate, the Alligator is “awakening,” and a directional move may be starting.
When the separation becomes wide and stable, the market is “eating,” which suggests a strong trend phase.
According to StockCharts, these phases help avoid false signals in non-trending conditions.
Q: What if lines intertwine mid-trend?
A: It signals potential consolidation or weakening momentum. Exit partially to lock profits. Follow risk rules by setting stops at recent lows. Reassess with volume for continuation.
Identifying Trend Direction with Alligator Mouth Opening
Trend direction is easiest to read when the Alligator mouth opening becomes clear. In an upward trend, the Lips lead above the Teeth and Jaw, and the lines fan upward.
In a downward trend, the Lips drop below the Teeth and Jaw, and the lines fan downward. Think of it as the “fast line” pointing first, with the slower lines confirming behind it.
Key Insight:
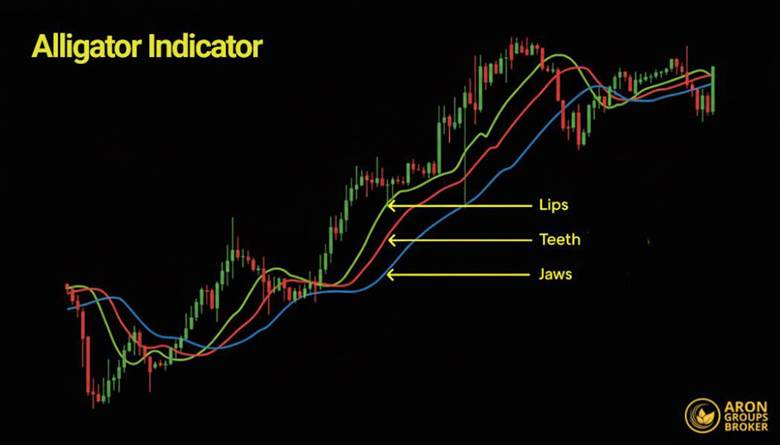
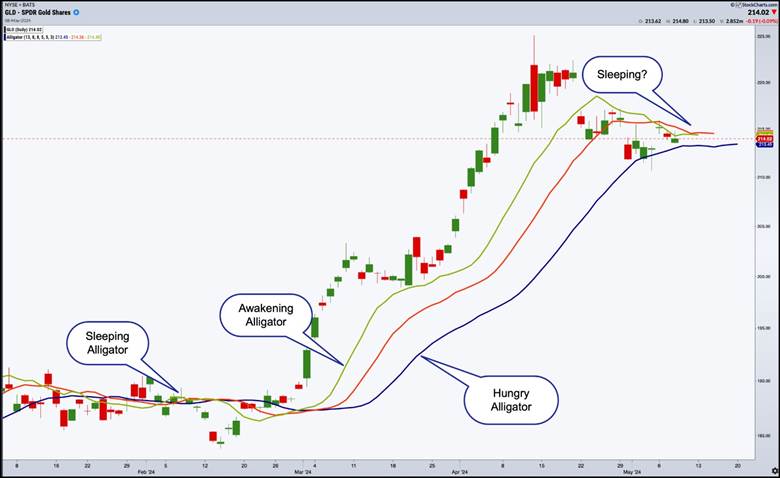
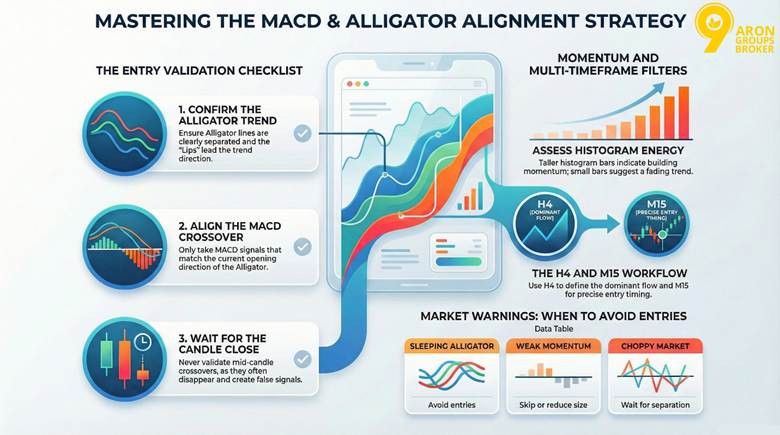
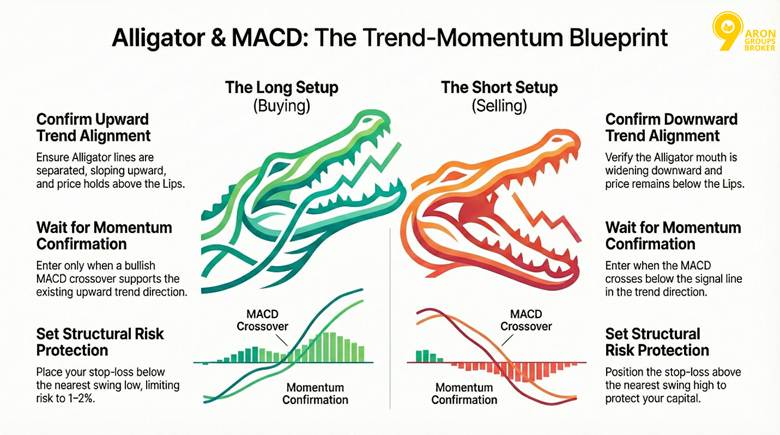
When the Lips cross and lead the Jaw and Teeth, direction becomes clearer, especially after a sleeping phase ends.
Use the Jaw Teeth Lips indicator structure as a visual filter, not a prediction tool. You are confirming what price is already beginning to do.
Confirming Trend Strength with MACD Crossovers
The MACD line crossing above signal strengthens bullish alligator signals. Histogram expands positively. Zero line acts as a threshold.
For bearish confirmation, the MACD crosses below the signal. Histogram contracts negatively. Alignment boosts reliability.
Steps include:
- Check the alligator’s mouth direction first.
- Wait for the MACD crossover in the same path.
- Monitor the histogram for sustained bars.
- Enter if both agree.
How Volatility Affects MACD and Alligator Signals
High volatility boosts signal amplitude in the MACD and alligator strategy. Histogram bars widen dramatically. However, it raises whipsaw risks.
Low volatility dampens signals, leading to fewer trades. Alligator lines stay closer. MACD reacts sluggishly.
In trending markets, volatility enhances accuracy. Sideways conditions amplify false alerts.
Understanding why crypto is so volatile helps apply this to digital assets effectively.
Warning:
During high-volatility spikes, wait for the candle to close before trusting a crossover, or you may enter on a temporary surge.
Entry Rules and Signal Validation in MACD and Alligator
Entry quality improves when you treat signals as a checklist, not a single trigger. The goal is to confirm direction with the Alligator lines, then validate timing with a MACD crossover.
You can apply these rules to any charting forex trading platform, but keep the same process each time to reduce impulsive trades.
According to ThinkMarkets, the Alligator is a trend tool and tends to work better when you add momentum confirmation, such as MACD, especially on higher timeframes.
Note:
Wait for the candle to close before you validate a signal. Mid-candle crossovers can disappear and create false confidence.
Valid MACD Crossovers Within an Alligator Trend
A valid MACD crossover should agree with the current Alligator direction. If the alligator’s mouth opening is upward, focus on bullish MACD crossover signals. If it is downward, focus on bearish signals. This rule alone filters many low-probability entries.
Validation checklist:
- Alligator lines are separated, not tangled.
- The Lips lead in the trend direction.
- The MACD crossover occurs in the same direction as the trend.
- Price is not trapped inside a tight, sideways band.
Q: How do you spot invalid crossovers?
A: Ignore them when the Alligator is “sleeping” and the lines overlap. Use a higher timeframe to confirm direction before trusting a lower timeframe crossover.
Many traders interpret MACD through crossovers and divergence, but signals are stronger when aligned with the broader trend context.
Timing Entries Using the MACD Signal Line
After the Alligator opens, use the MACD signal line to time a cleaner entry. The idea is to avoid entering at the very first burst, where pullbacks are common.
Practical timing examples:
- Uptrend: wait for a pullback, then enter when the MACD line crosses above the MACD signal line again.
- Downtrend: wait for a bounce, then enter when the MACD line crosses below the signal line again.
- If the crossover is small and flat, treat it as weak confirmation.
Tip:
If the crossover happens far from the last swing level, you may be late. Consider waiting for the next pullback.
Assessing Momentum Strength with MACD Histogram
The MACD histogram helps you judge whether a crossover has energy behind it. Taller bars usually mean stronger momentum and better follow-through.
Smaller bars often mean hesitation, which increases the chance of a quick reversal.
How to read it during entries:
- Histogram expands after crossover: momentum is building.
- Histogram contracts immediately after crossover: momentum is fading.
- Histogram near zero with frequent flips: conditions are choppy.
Did You Know:
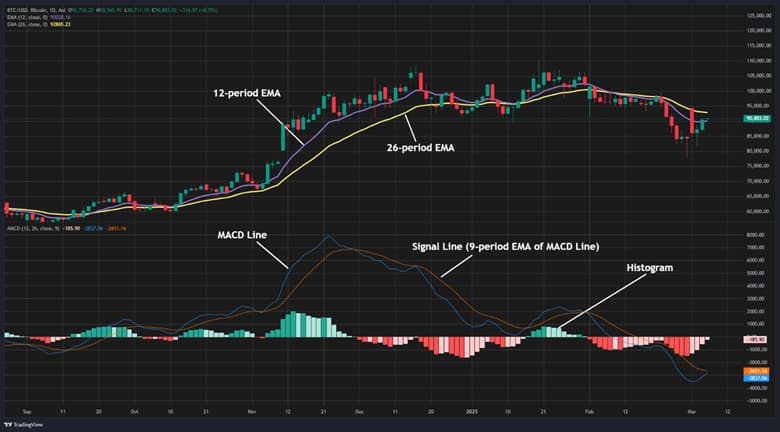
Histogram divergence often precedes reversals by 2–3 bars, so it can warn you when a trend is overextending.
Multi-Timeframe Confirmation with MACD and Alligator Lines
Multi-timeframe validation reduces noise. A simple approach is to use H4 to define direction and M15 to plan entries. H4 shows the dominant flow, while M15 provides more precise timing.
Suggested workflow:
- H4: Confirm the Alligator lines are clearly trending.
- H4: Check whether Moving Average Convergence Divergence is broadly supportive of that direction.
- M15: wait for an entry-style MACD crossover that matches the H4 bias.
- M15: manage risk tightly, because lower timeframes fluctuate more.
According to TradingView, this H4-on-M15 MACD framework is used to keep lower timeframe entries aligned with higher timeframe MACD structure.
Warning:
If H4 is neutral and M15 is active, you are likely trading noise. Stand aside until the higher timeframe clarifies.
Filtering False Signals in Ranging Markets
Ranges are where the Alligator indicator is most valuable as a “no-trade” filter. When it is sleeping, the MACD and alligator strategy is vulnerable to repeated whipsaws.
Range-market filter table:
| Filter | What you observe | What it means | Action |
|---|---|---|---|
| Sleeping Alligator | Alligator lines overlap tightly | No trend structure | Avoid entries |
| Weak histogram | MACD histogram is small or flat | Little momentum | Reduce size or skip |
| Rapid crossovers | Frequent MACD crossover flips | Choppy conditions | Wait for separation |
| No follow-through | Price returns to mid-range quickly | Breakout failed | Treat as invalid |
Trade Execution and Risk Management
Trade execution in the MACD and alligator strategy requires precise alignment of signals from the MACD indicator and Bill Williams’ Alligator. Long and short setups focus on trend confirmation with momentum.
Risk management rules, such as stop-loss placement and position limits, protect capital. Remember, trading involves the risk of loss of capital. Consider whether you understand how CFDs work.
Long Setup Using MACD and Alligator Signals
A long setup focuses on trend alignment first, then momentum confirmation. The clearest entries occur when the alligator’s mouth opening widens upward, and MACD confirms improving momentum.
Step-by-step long rules
- Confirm the Alligator lines are separated and sloping upward.
- Ensure price is holding above the Lips and Teeth most of the time.
- Wait for a bullish MACD crossover that supports the trend direction.
- Place a stop-loss beyond the nearest swing structure, not inside noise.
- Set a target that supports your planned risk-to-reward.
According to Trading Compass, the Jaw, Teeth, and Lips structure is designed to help traders identify when a trend is developing, rather than guessing early.
Short Setup Using MACD and Alligator Signals
A short setup mirrors the long logic, but in the opposite direction. You want the Alligator lines to fan downward, then use the MACD signal line behaviour to time the entry with momentum.
Step-by-step short rules
- Confirm the alligator’s mouth opening is downward and widening.
- Prefer entries where price fails to regain the Lips on a pullback.
- Wait for MACD to cross below the signal line in the trend direction.
- Avoid entries when the MACD is flat and the crossover is shallow.
Q: What is the ideal stop-loss?
A: For longs, place it below a recent swing low. For shorts, place it above a recent swing high. Adjust the distance using volatility so each loss stays near 1% to 2% of capital.
Position Sizing and Risk–Reward Ratios
Position size controls how much a single mistake can cost. A common planning rule is to aim for at least a 1:2 risk-to-reward ratio, then adjust position size so the stop-loss equals your chosen risk.
According to Myfxbook, a position size calculator estimates trade size using risk level and stop-loss distance in pips. Babypips also provides a position sizing tool for managing risk exposure.
Risk-to-reward examples:
| Account size | Risk per trade | Stop size | Cash risk | Target for 1:2 |
|---|---|---|---|---|
| GBP 2,000 | 1% | 40 pips | GBP 20 | GBP 40 |
| GBP 5,000 | 1% | 60 pips | GBP 50 | GBP 100 |
| GBP 10,000 | 2% | 50 pips | GBP 200 | GBP 400 |
Tip:
If the MACD histogram weakens before the target, consider reducing exposure rather than waiting for a full stop.
Exit Strategy: Managing Momentum Loss and Signal Reversals
Exits should react to momentum loss and structural changes. In the MACD and alligator strategy, two common warnings are a MACD reversal and a closing Alligator mouth. Both suggest the trend is losing energy.
Exit triggers to consider
- MACD histogram contracts for several bars after an advance.
- A MACD crossover appears against your position direction.
- Price closes through the Lips, then fails to reclaim it.
- The Jaw Teeth Lips indicator begins compressing, signalling consolidation.
Some sources note that momentum traders often confirm exits with complementary tools such as RSI, especially when momentum fades.
The RSI can be used alongside MACD to help confirm momentum shifts and reduce emotional exits.
Optimisation, Settings, and Strategy Limits
Optimising this approach is about matching indicator sensitivity to market behaviour. The Alligator indicator helps you stay focused on trend phases, while the MACD indicator helps confirm whether momentum supports a trade.
Settings changes should be tested, logged, and kept consistent for each asset type. Keep your adjustments small, and always evaluate portfolio-level exposure, not just one trade.
Warning:
Trading CFDs involves risk of loss of capital. Consider whether you understand how CFDs work.
Optimising MACD and Alligator Settings for Accurate Signals
Default settings are popular because they balance speed and stability. MACD commonly uses 12, 26, 9, while the Alligator uses 13, 8, 5 with forward shifts. Faster settings can react earlier, but they can also increase false triggers.
Common MACD settings include 12,26,9, and faster variants such as 8,17,9 for more responsive trading.
Practical tweak ideas to test:
- Keep Moving Average Convergence Divergence at 12,26,9 on H1 and above.
- Try faster MACD only on lower timeframes, then retest results.
- Leave Alligator defaults on major forex pairs to reduce noise.
- If signals lag, adjust only one parameter at a time.
- Record win rate, drawdown, and average R multiple, not opinions.
Best Conditions for MACD and Alligator Strategy Performance
The MACD and alligator strategy performs best when price trends cleanly and liquidity is high.
Strong liquidity often produces smoother swings and fewer random spikes. This tends to improve both MACD confirmation and Alligator trend structure.
The Alligator works well as a range filter, while MACD can be used for timing once a trend is active.
Key Insight:
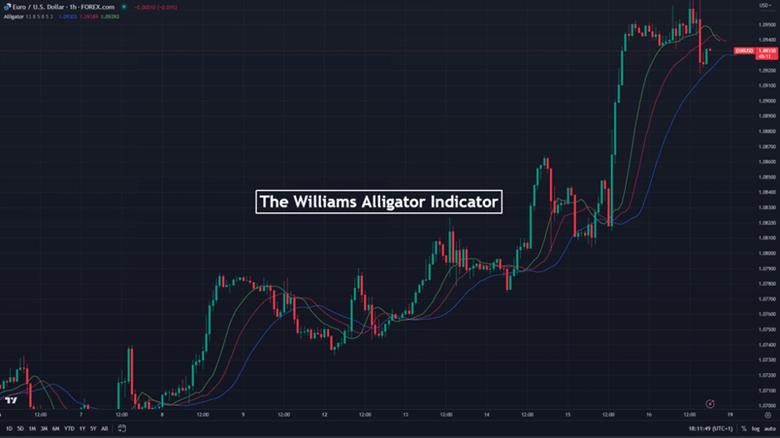
Excels in forex majors like EUR/USD, where liquidity often supports steadier trend phases.
Good environments to prioritise:
- Trending markets with clear higher-timeframe direction
- High-liquidity instruments with tighter spreads
- Sessions with reliable participation, not thin trading hours
- Stocks after earnings, when trends often persist for several sessions
Strategy Limitations: When MACD and Alligator Fail
The biggest weakness is sideways trading and sudden news shocks. In ranges, Alligator lines compress, and signals lose reliability. In news spikes, crossovers can appear and vanish quickly.
According to Investopedia, MACD is a lagging indicator and can produce false signals, especially in volatile or range-bound markets.
Common failure conditions:
- Tight consolidations where the Alligator lines overlap repeatedly
- High-impact news releases that distort candles and momentum readings
- Late-stage trends where momentum fades, but price still drifts
- Low-volatility sessions where MACD crossovers whipsaw
Note: If the Alligator lines keep tangling, treat it as a “no trend” label.
Common Mistakes to Avoid with MACD and Alligator
Most errors come from impatience, not settings. Traders often take every crossover, even when the trend filter is unclear. Others ignore higher timeframes and get trapped by lower-timeframe noise.
Avoid these habits:
- Overtrading every MACD crossover without trend alignment
- Ignoring the multi-timeframe structure before entering
- Treating the MACD histogram as a prediction, not a momentum gauge
- Changing settings after a small losing streak
MACD crossovers behave differently in trending and ranging conditions, so context and confirmation matter.
Q: Why avoid relying on this setup alone?
A: Both tools lag in low volatility and can misread ranges. Add volume checks for confirmation, and keep risk small until conditions improve.
Conclusion
Mastering the MACD and alligator strategy cultivates the discipline essential for thriving in volatile markets. The Alligator indicator reveals clear trends, while the MACD indicator validates momentum, teaching traders patience and precision.
Practise regularly on platforms with low spreads to refine execution without unnecessary costs. Integrating AI tools can enhance backtesting efficiency, revealing hidden performance patterns. Nevertheless, trading CFDs involves the risk of loss of capital. Consider whether you understand how CFDs work before proceeding.