


Financial market movements are never random. Behind every major uptrend or downtrend on the chart lie the footprints of institutional investors who accumulate quietly at market bottoms and distribute at market tops. But how can one track these footprints? The Market Cycle Indicator is designed to reveal the activity of these major players.
This tool helps you understand which stage of the institutional game the market is in and whether it’s time to align with the flow of smart money or trade against it. If you want to evolve from an emotional trend follower into a structural analyst, continue reading.

- The ideal way to use the Market Cycle Indicator is to enter trades at the beginning of the markup (uptrend) and markdown (downtrend) phases.
- To avoid false signals, always confirm the indicator's signals with other tools like trading volume, the RSI, and price action patterns.
- Keep in mind that this is a lagging indicator; it confirms a phase change only after it has already begun.
- Customize the indicator's settings to match your specific trading strategy and timeframe.
What Is the Market Cycle Indicator?
The Market Cycle Indicator is a technical analysis tool developed based on market cycle theory, particularly the principles of Richard Wyckoff. This theory posits that markets consistently move through four primary phases:
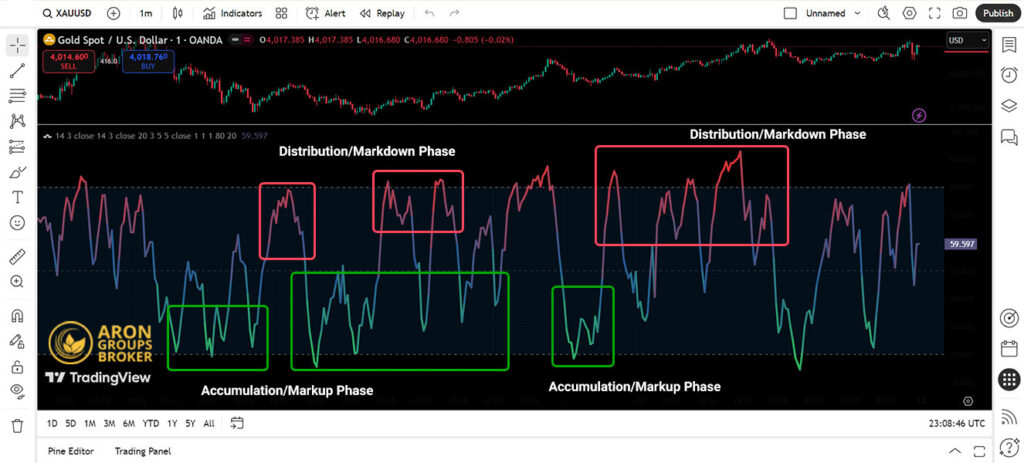
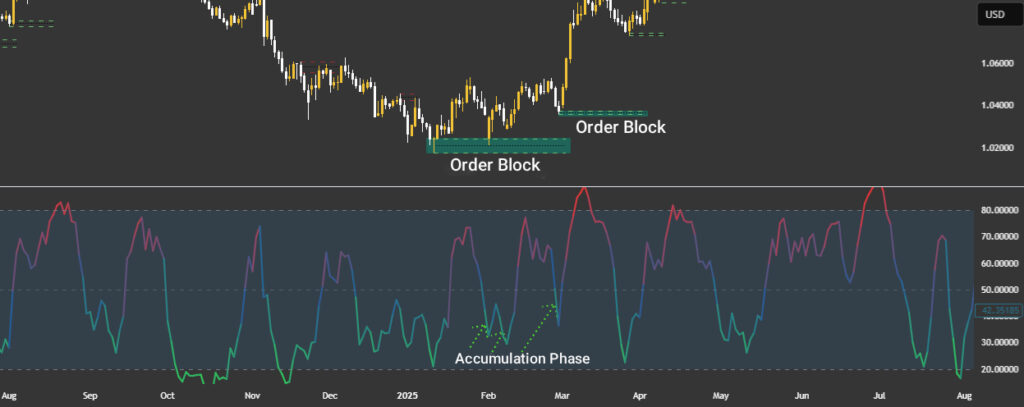
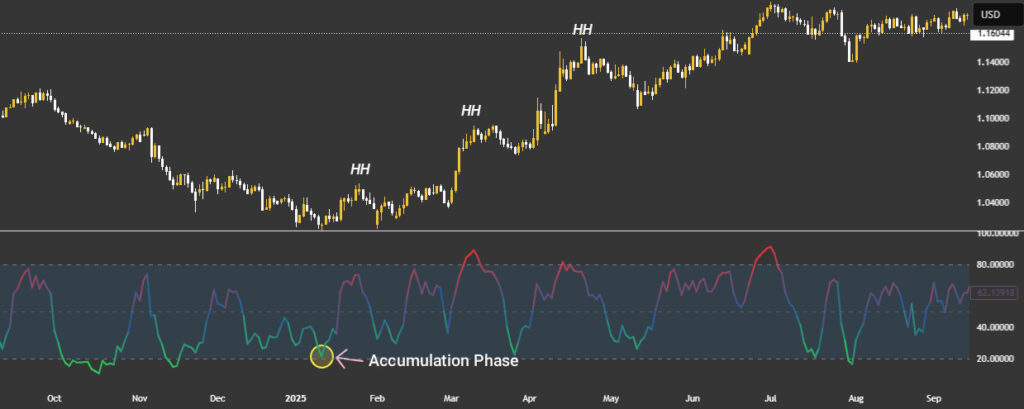
- Accumulation Phase (Green): Following a prolonged downtrend, large investors and “smart money” begin buying an asset at low prices. During this stage, price action shows little volatility as the market appears to be bottoming out or forming a base.
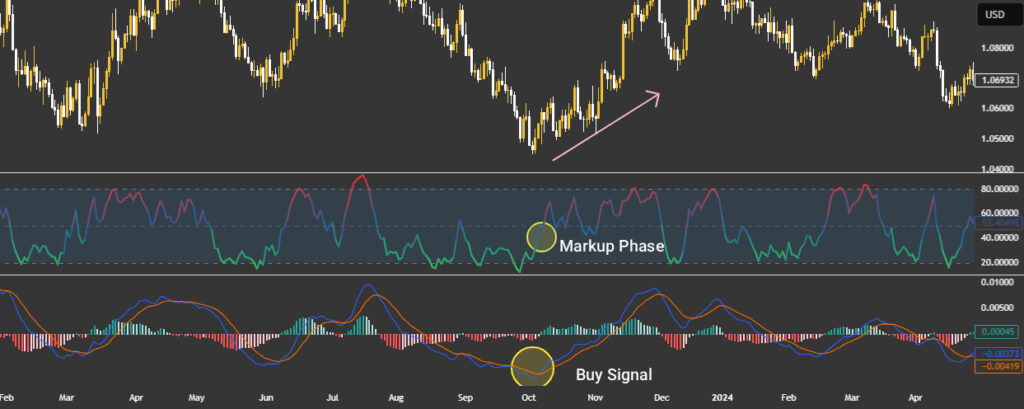
- Markup Phase (Blue): As demand increases, the price breaks out of the accumulation range and begins a strong uptrend. This phase is characterized by general market optimism and the entry of retail traders.
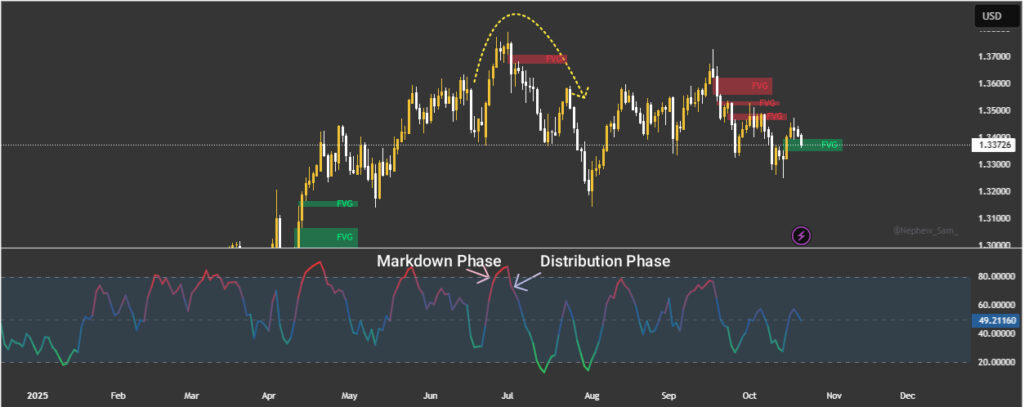
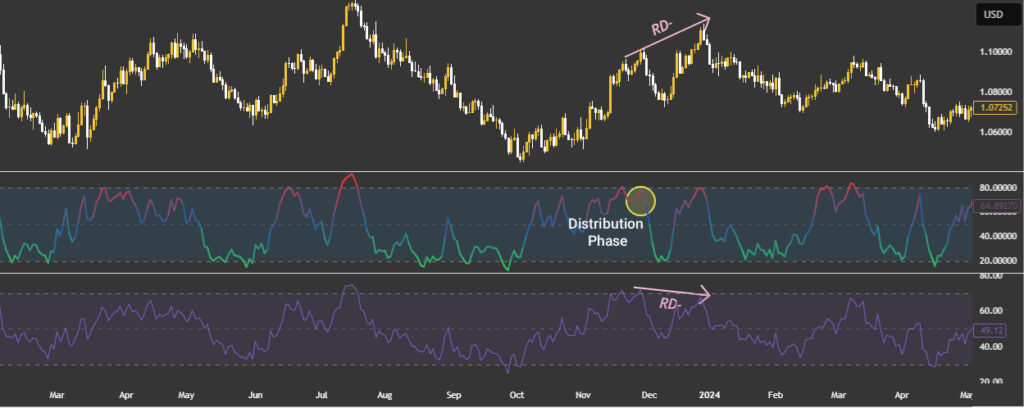
- Distribution Phase (Purple): After a significant price advance, institutional investors begin to sell their holdings and realize profits. In this phase, the price typically moves sideways within a range, lacking the momentum to break new highs.
- Markdown Phase (Red): When supply overcomes demand, the trend reverses, and a downtrend begins. This stage is driven by fear and panic selling, eventually leading to a new accumulation phase.
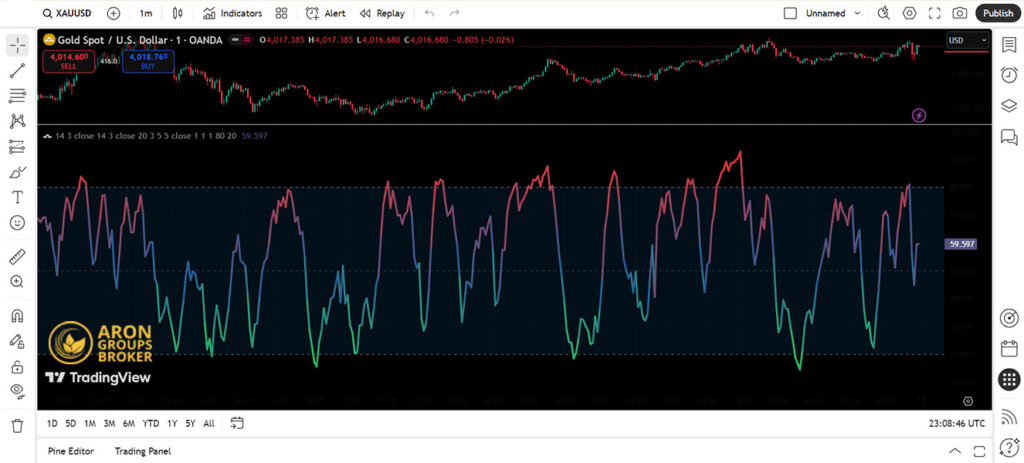
The Market Cycle Indicator typically uses different colors to display these four phases on a chart, allowing traders to quickly identify the current market condition.

According to TradingView, the indicator's calculation is based on a combination of two key factors: 1) a Moving Average (MA) to determine the overall trend direction and 2) the Average True Range (ATR) to measure market volatility and momentum.
How to Analyze and Identify Signals with the Market Cycle Indicator
The primary function of this indicator is to provide a macro view of market conditions, helping traders identify potential entry and exit signals based on the current market phase.
Identifying Uptrends and Downtrends
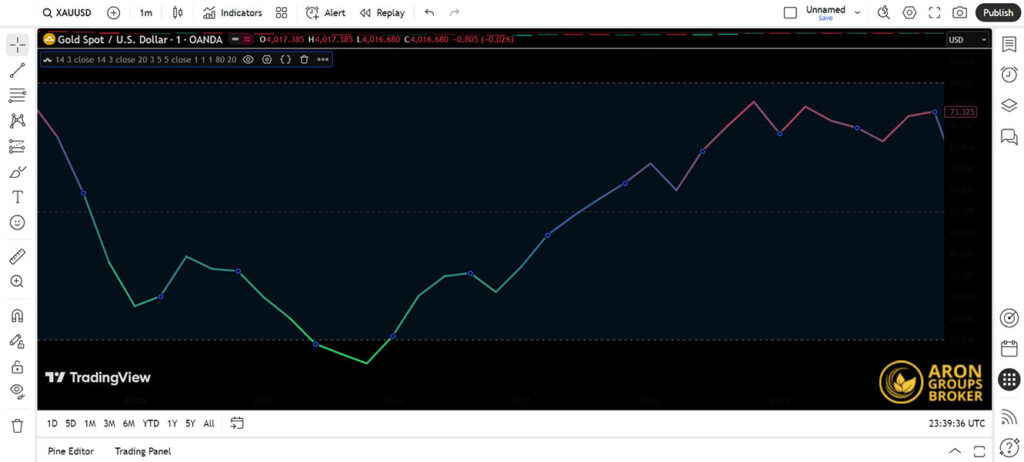
The most straightforward application of this tool is to identify the prevailing trend. When the indicator enters the Markup Phase (typically colored green or blue), it signals a strong uptrend. Under these conditions, trading strategies should be long-biased.
Conversely, when the indicator enters the Markdown Phase (usually colored red), it signals a downtrend, and short positions are preferable. Trading during the accumulation and distribution phases is generally higher risk, as the market is often trendless or ranging.
Finding Reversal Points and Entry/Exit Signals
The most opportune moments to use this indicator are during the transitions from one phase to another:
- Entry Signal: The shift from the Accumulation to the Markup phase is a strong signal to enter a long position. This indicates that buying pressure is beginning to overwhelm sellers.
- Exit Signal: The transition from the Distribution to the Markdown phase is an ideal time to exit long positions or enter a short position. This moment signals the start of significant selling pressure.
Customizing Settings for Precise Signals
Most versions of the Market Cycle Indicator (such as those found on TradingView or MetaTrader) feature customizable parameters. The most critical setting is typically the “lookback period” or “length,” which determines the indicator’s sensitivity.
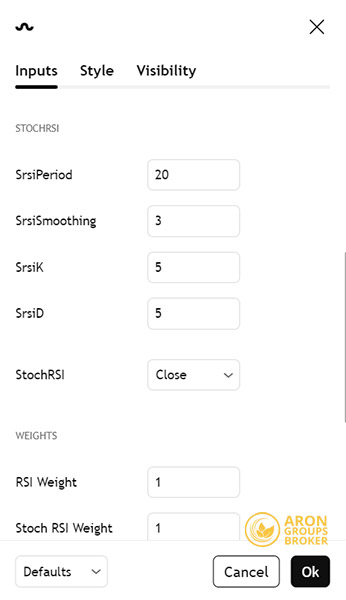
Shorter periods will generate more signals, but they may also be less reliable. Longer periods produce fewer but more validated signals, making them better suited for analyzing long-term trends. The optimal settings will depend on your specific trading strategy, timeframe, and the asset being analyzed.
Combining the Market Cycle Indicator with Smart Money Concepts for Market Cycle Confirmation
Combining the Market Cycle Indicator with Smart Money Concepts (SMC) is one of the most powerful methods to enhance analytical precision. These two approaches are complementary:
- Market Cycle Indicator: Provides the macro picture and overall market context. It answers the question: “Which phase (accumulation, markup, distribution, markdown) is the market likely in?”
- Smart Money Concepts: Reveal the precise details and footprints of major players within the price chart. These concepts tell us: “In which key areas are large orders located, and where is the price most likely to react?”
These specialized indicators help you automatically identify key areas on your chart, rather than relying on visual searching alone.
In global market analysis, comparing the market cycle phase between the U.S. Dollar Index (DXY) and risk assets can reveal institutional capital inflows earlier than fundamental data does.
Order Block Indicator
An Order Block Indicator automatically identifies potential order block candles by drawing a box around them.
When a bullish signal from the Market Cycle indicator aligns with a reinforcing order block during the accumulation phase, the likelihood of a strong upward trend is very high. Conversely, when the market enters the distribution phase and the order block indicator highlights a strong supply zone, a decline or deep correction can be expected.
Fair Value Gap (FVG) Indicator
This indicator automatically highlights areas of price inefficiency or FVG, to which price tends to revert in the future.
When a Fair Value Gap (FVG) appears in the phase transition zone of the market cycle (for example, between distribution and markdown), it usually indicates the inflow of new liquidity and a potential change in price direction.
In such cases, the FVG acts as a confirmation of a supply or demand zone, and entering trades in the direction of the prevailing market cycle tends to offer higher accuracy.
For instance, during the distribution phase, if the market cycle indicator shows weakness in the bullish trend while a bearish FVG forms in the same area, the likelihood of a price drop and continuation of the markdown phase increases.
Conversely, in the accumulation phase, the presence of a bullish FVG may serve as an early signal of a potential upward move.
Liquidity Levels Indicator
These indicators identify significant highs and lows, especially equal highs and equal lows, where substantial liquidity is often accumulated.
The Liquidity Levels Indicator highlights zones where a large number of pending orders or stop-losses are concentrated.
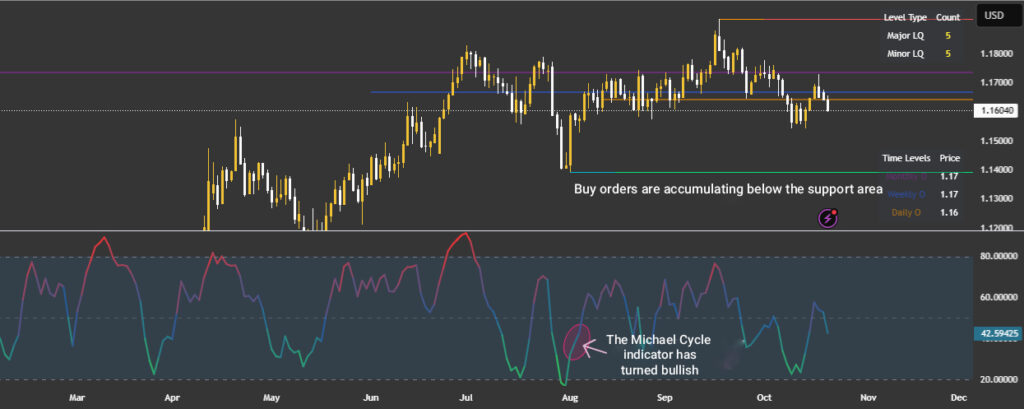
During the accumulation or distribution phases, when significant liquidity builds up above or below a price range, the likelihood of a market manipulation event (Liquidity Grab) increases substantially. In such cases, combining two indicators can help traders distinguish between a genuine breakout and a fake breakout.
When the Market Cycle Indicator signals the start of a bullish phase and, at the same time, the Liquidity Indicator confirms an accumulation of orders below a key support zone, it suggests a strong probability of a price rally following a liquidity sweep. Conversely, in a bearish phase, if liquidity clusters above a resistance level, it often indicates a liquidity trap for sellers before the downtrend resumes.
Market Structure Indicator
A Market Structure Indicator automatically marks Break of Structure (BOS) and Change of Character (CHoCH) points on the chart.
The Market Structure Indicator identifies actual changes in highs and lows, helping you determine the market trend (bullish or bearish) with greater accuracy.
When combined with the Market Cycle, this tool allows you to pinpoint entry and exit points more confidently at the beginning or end of each market phase. For example:
If the Market Cycle indicates an accumulation phase and the Market Structure Indicator simultaneously forms a new Higher High, it suggests the potential start of a strong bullish trend.
Conversely, if the Market Cycle enters a distribution phase and the structure forms a Lower Low, it may signal the beginning of a bearish trend.
To enhance accuracy, many traders use this combination alongside confirmatory tools such as trading volume or the OBV (On-Balance Volume) indicator to assess the real strength of each market phase.
Combining the Market Cycle Indicator with Volume and Price Action
The combination of these three tools creates a highly powerful strategy, as each illuminates a different piece of the forex market puzzle.
Let’s imagine this combination with a simple analogy:
- The Market Cycle Indicator is like a roadmap. It tells us which stage of the journey we are likely in (starting, peaking, consolidating, or reversing).
- Trading Volume is like the vehicle’s fuel level. It shows us whether there’s enough energy and momentum to continue the journey.
- Price Action is like traffic signals. It gives us immediate cues for “go,” “caution,” or “stop.”
When you use all three together, you not only understand the overall direction but also gain insight into the strength of the move and the precise timing for reactions.
In the transition phase from accumulation to uptrend, if the market cycle peak is lower than the price peak, there’s a high probability of a “false bullish phase.”
Here are the recommended indicators for combining with the Market Cycle Indicator:
Combining with Volume-Based Indicators
Volume represents market “effort.” A price movement (result) without high volume (effort) is suspicious. According to Wyckoff’s theory, the activities of major players are always accompanied by high trading volume.
Suggested Indicator: Volume Profile
Instead of displaying volume over a time period (like a conventional volume indicator), the Volume Profile indicator shows at which price levels the most volume was traded. Its most important level is the “Point of Control (POC),” where the highest trading volume occurred.
Combining with Price Action
Price Action narrates the real-time battle between buyers and sellers through candlestick patterns and price structure.
Suggested Indicator: Candlestick Patterns Indicator
These indicators automatically identify and mark important candlestick patterns on the chart, such as Pin Bars, Engulfing patterns, and Dojis.
Combining the Market Cycle Indicator with the MACD
The Moving Average Convergence Divergence (MACD) indicator can be used to confirm the strength of a trend. If the Market Cycle Indicator enters an uptrend phase and, simultaneously, the MACD line is above its signal line with a positive histogram, the bullish trend is confirmed.
Combining the Market Cycle Indicator with the RSI
Divergences in the Relative Strength Index (RSI) can anticipate reversal signals. A bearish divergence in the RSI, while the Market Cycle Indicator is in the distribution phase, serves as a strong warning for the potential end of an uptrend.
Customizing the Market Cycle Indicator with Custom Indicators for Individual Strategies
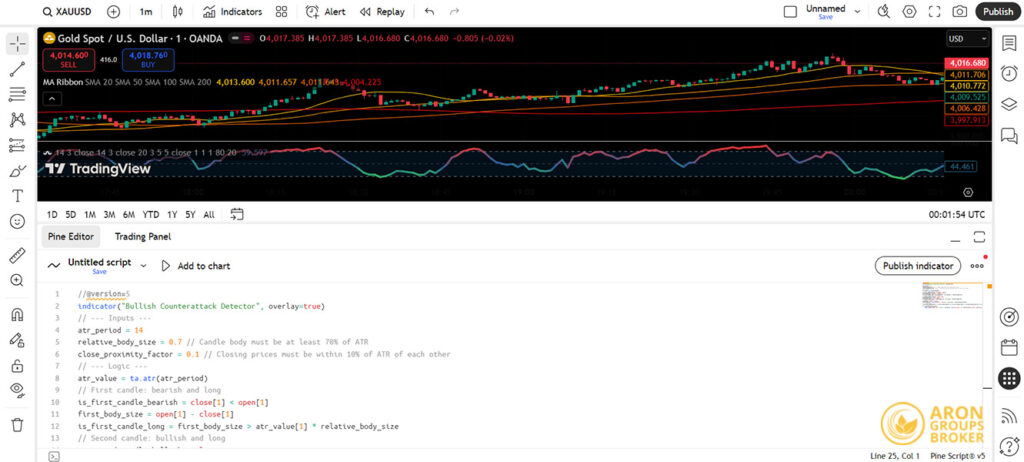
Many platforms, such as TradingView, allow users to modify indicator codes or combine them with other tools. An advanced trader can implement specific conditions (e.g., combining a Market Cycle signal with a particular moving average) as a custom indicator, ensuring that the signals are fully aligned with their individual trading strategy.
Advantages and Limitations of the Market Cycle Indicator
Like any other tool, using the Market Cycle Indicator comes with its own advantages and limitations.Advantages of the Market Cycle Indicator
The advantages of the Market Cycle Indicator include:- Provides a Macro Perspective: This indicator helps you shift focus from short-term fluctuations to understanding the broader market picture. By knowing the overall market phase, you can align your trades with the primary and more powerful trend.
- Establishes a Mental Framework and Reduces Emotional Biases: By offering a mental model of the four market phases, this indicator aids in emotional control. For instance, when the market is in the “Distribution” phase, it helps prevent buying euphoria and the fear of missing out (FOMO). Conversely, during the “Accumulation” phase, it discourages panic selling at market bottoms.
- Improves Entry and Exit Timing: By identifying transition points between phases, it helps you better time potential entries (transition from accumulation to markup) and exits (transition from distribution to markdown), preventing late entries or premature exits.
- Visual Simplicity and Quick Comprehension: Most versions of this indicator display market status in a very simple and understandable way using different colors. This feature allows traders to get an initial assessment of market conditions quickly.
- Assists in Risk Management: Understanding the current market phase contributes to better risk management. For example, during a distribution phase, a cautious trader might tighten their stop-loss or reduce their buying volume. In an uptrend phase, they can more confidently allow their profits to run.
Limitations of the Market Cycle Indicator
The disadvantages of the Market Cycle Indicator include:- Lagging Indicator: This is the indicator’s biggest drawback. The Market Cycle Indicator confirms a phase after a significant portion of it has already unfolded. This means you will almost always miss part of the initial move.
- False Signals in Ranging Markets: In markets that lack a clear trend and oscillate within a sideways range, the indicator may frequently switch between phases, generating numerous false buy and sell signals.
- High Sensitivity to Settings: The indicator’s performance is highly dependent on its input settings (such as the lookback period). A minor change in settings can completely alter the indicator’s output and the displayed phase, which can lead to confusion.
- Ambiguity in Phase Transitions: In real-world trading, transitions between phases are not always clear-cut or swift. The market may linger at the boundary between a distribution and markdown phase for an extended period, issuing conflicting signals that result in poor decision-making.
- Essential Need for Confirmation: This indicator alone does not constitute a complete trading system. Relying solely on its signals without confirmation from other tools (such as trading volume, price action, or other oscillators) carries a very high risk and is not recommended.
According to Investopedia, market cycles are not solely determined by trader behavior, but also significantly influenced by government economic and monetary policies (such as central bank interest rate changes). For example, a sharp interest rate cut can prolong an uptrend phase for several years, deviating from its typical pattern.
Conclusion
The Market Cycle Indicator is a powerful tool for understanding market structure and underlying psychology. It is not a complete trading system on its own, but when integrated as part of a comprehensive strategy and combined with other confirming tools like volume analysis, price action, and oscillators, it can significantly enhance your decision-making and trade timing. The key to successful trading lies in a deep understanding of the four market phases and using this indicator to align with the flow of smart money.
References: mql5.com