


Market Structure Shift (MSS) is one of the key tools in technical analysis, enabling traders to identify structural changes in market trends and make more precise trading decisions.
In this article, we provide a comprehensive exploration of MSS, including its types, identification methods, and practical applications for determining optimal entry and exit points. You will discover actionable strategies designed to enhance profitability while mitigating trading risks.
If you want to stay ahead of market shifts and manage your trades intelligently, this guide is essential reading.

- MSS highlights significant structural changes in the market, helping traders identify emerging trends more quickly.
- Utilizing tools such as Fair Value Gaps (FVG), order blocks, volume indicators, and candlestick patterns can significantly increase the reliability of detecting MSS.
- MSS can be applied both for spotting short-term reversals and for identifying major trend changes on higher timeframes, offering traders a comprehensive market perspective.
What Is Market Structure and How Is It Applied in Technical Analysis?
Market structure refers to the organization and behavior of price movements within a financial market. This concept explains how prices behave and how supply and demand interact in the market. In technical analysis, understanding market structure helps traders identify various market trends and gain deeper insight into potential future price behaviors.
Generally, market structure in technical analysis is categorized into three main states:
- Uptrend: Prices consistently move higher. In this scenario, each successive peak and trough is higher than the previous ones, indicating bullish momentum.
- Downtrend: Prices consistently move lower. Here, each new peak and trough is lower than the preceding ones, reflecting bearish pressure.
- Sideways/Range-bound Trend: Prices move within a defined range without a clear upward or downward direction, indicating market indecision.

According to Writofinance, it is generally recommended to use higher timeframes to identify the market structure and then execute trades on shorter timeframes.
What Is a Market Structure Shift (MSS) and Why Does It Matter?
A Market Structure Shift (MSS) refers to technical patterns that, when they appear on a price chart, signal imminent significant changes in the price trend. According to HowToTrade, an MSS occurs when the market structure transitions from one state to another—for example, shifting from an uptrend to a downtrend or vice versa.
Market Structure Shift can result from changes in the balance between supply and demand, major economic news, or adjustments in monetary and fiscal policies. Recognizing MSS patterns allows traders to anticipate trend reversals or major price movements and make more informed, timely trading decisions.

According to InnerCircleTrader, a Market Structure Shift (MSS) not only signals the pause of the current market trend but also indicates that the short-term or long-term market trend is likely to reverse soon.
Why Is Market Structure Shift Important?
The significance of Market Structure Shift in technical analysis can be summarized as follows:
- Identifying Price Reversal Points:
MSS helps traders pinpoint potential reversal points in the market. These points often occur at support or resistance levels and provide strategic opportunities for buying or selling. For instance, if the price hits a resistance level and reverses, it may signal the beginning of a downtrend. - Making Better Trading Decisions:
Accurately recognizing the timing of a Market Structure Shift allows traders to capitalize on market opportunities effectively. By detecting these changes promptly, traders can make informed decisions, such as entering a new trend at the right moment or exiting a weakening trend. - Risk Management:
Market trend changes inherently carry higher risk. MSS enables traders to manage risk by identifying trend shifts in time, helping to prevent significant losses and preserve capital.
Difference Between Regular Market Structure (BOS) and Shifted Market Structure
A regular market structure, often referred to as BOS (Break of Structure), represents the main framework of the market, usually observed as a clear and continuous trend. In this scenario, prices move along a predictable path, and the overall market trend is generally foreseeable.
In contrast, a shifted market structure occurs when the previous trend is lost, and a new trend takes over.
Key Differences Between Regular (BOS) and Shifted Market Structures
- Price Trends:
- In a regular market structure (BOS), prices typically move along a defined trend—whether upward or downward.
- In a shifted market structure, the previous trend halts, and the market enters a completely new trend. This transition can be sudden or gradual and is usually accompanied by breaks of trendlines and key support/resistance levels.
- Signals:
- In BOS, prices remain within a relatively stable range, and buy or sell signals are derived from minor breakouts or subtle trend changes.
- In a shifted market structure, trend change signals are clearer and more pronounced, often coupled with significant shifts in trading volume and price behavior.
- Market Behavior Forecasting:
- In a regular market structure, traders can anticipate market movements using technical patterns such as triangles, price channels, or trendlines.
- In a shifted market structure, accurate forecasting becomes more challenging. Traders need to continuously monitor price levels and trading volume to identify the emerging trend.
- Psychological and Economic Impact:
- In a regular market structure, changes are gradual and predictable, allowing traders to operate confidently using established strategies.
- In a shifted market structure, sudden and unexpected shifts can generate market excitement and volatility. This scenario requires more careful analysis to capitalize on market changes effectively.
Features: Regular Market Structure (BOS) vs. Shifted Market Structure
| Feature | Regular Market Structure (BOS) | Shifted Market Structure |
|---|---|---|
| Price Trends | Prices move within a steady trend (either upward or downward) | Overall price trend has shifted, entering a new directional trend |
| Signals | Signals typically arise from minor breakouts or small trend changes | Trend change signals are clearer and more pronounced |
| Market Behavior Forecasting | Market behavior is predictable using technical patterns such as triangles or trendlines | Accurate forecasting is more challenging and requires continuous monitoring of price and volume changes |
| Psychological & Economic Impact | Changes are gradual and predictable, allowing traders to operate confidently with established strategies | Sudden and unexpected changes that can cause strong market emotions and volatility |
| Trend Stability | Trend generally continues steadily until a specific point is reached | Previous trend halts, and the market enters a new, often reversed trend |
| Price Breaks | Minor price breakouts occur within a specific range | Larger price breakouts and shifts at key support/resistance levels take place |
| Trading Strategies | Traders can rely on established strategies and familiar patterns | Traders must continuously monitor the market and adapt their strategies to the evolving trend |
Types of Market Structure Shift
In general, there are three types of Market Structure Shift (MSS):
- Bullish Shift (Upward Shift)
- Bearish Shift (Downward Shift)
- Sideways or Neutral Shift
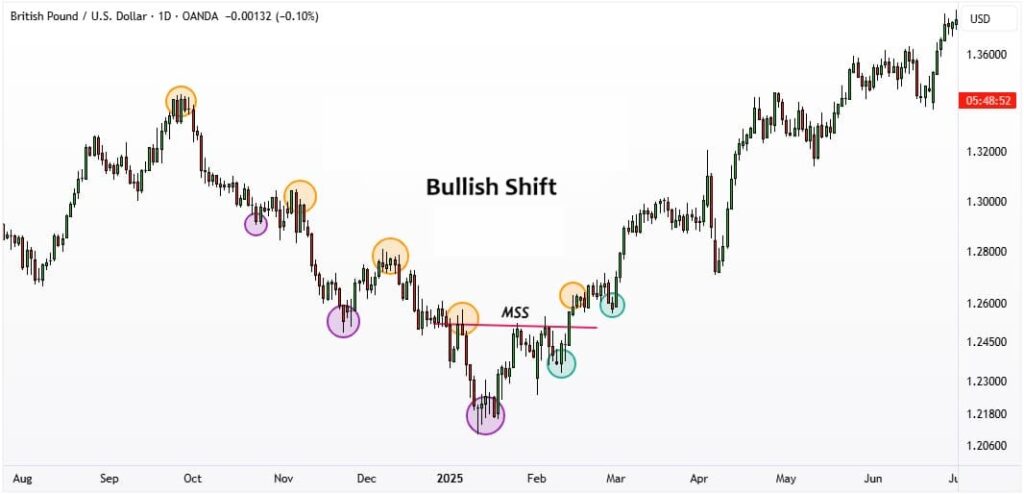
Bullish Shift
A Bullish Shift occurs when the market transitions from a downtrend or sideways/range-bound movement into an uptrend. This change typically happens when resistance levels are broken or a downtrend line is breached, often accompanied by an increase in trading volume. During a bullish shift, market demand rises, prompting investors to increase their purchases of stocks or other assets.
How to identify a bullish shift: The price forms a new higher high above the most recent low high.
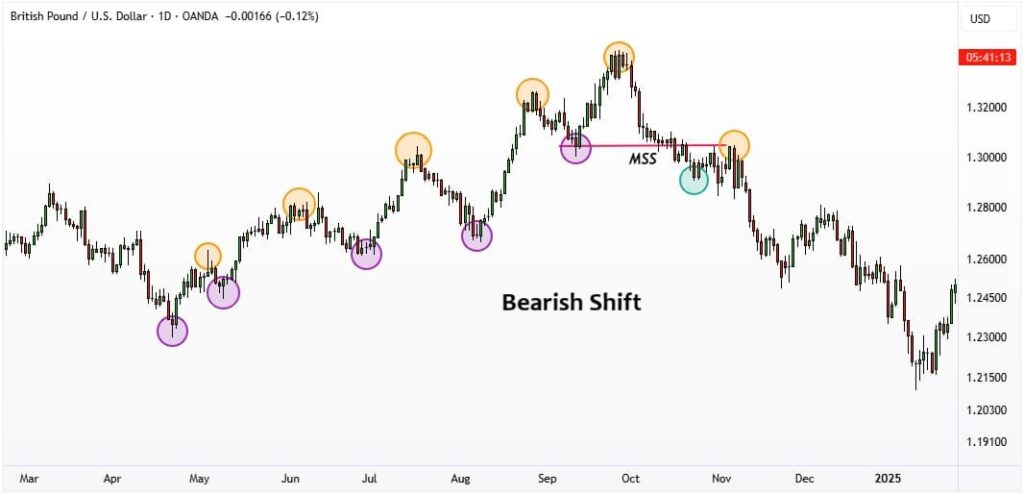
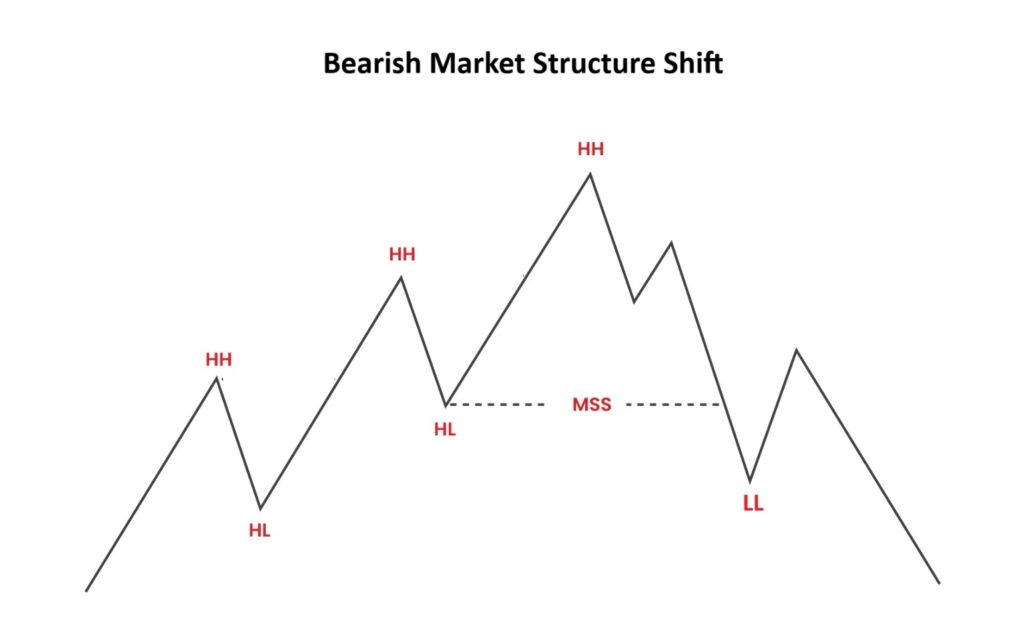
Bearish Shift
A Bearish Shift takes place when the market moves from an uptrend or sideways range into a downtrend. This shift generally occurs when prices break below support levels or an uptrend line is violated. In this scenario, market supply surpasses demand, and investors begin selling assets.
How to identify a bearish shift: The price forms a new lower low below the most recent high low.
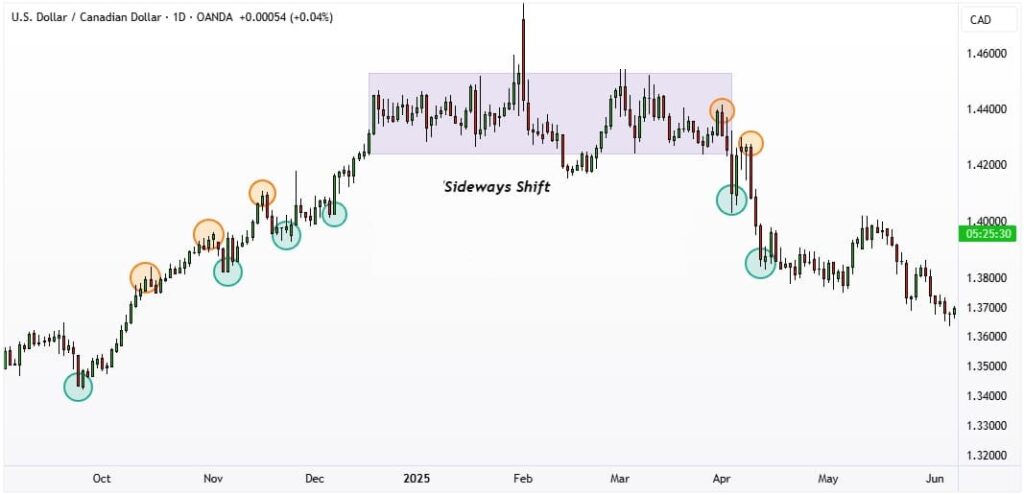
Sideways or Neutral Shift
A Sideways (Neutral) Shift happens when the market moves from an uptrend or downtrend into a range-bound or neutral state. In this phase, prices oscillate between support and resistance levels, showing no clear upward or downward trend. This condition usually arises from market uncertainty or a balance between supply and demand. Traders often employ strategies such as range trading to capitalize on these movements.
How to identify a sideways shift: Prices move within a clearly defined channel, bounded by upper and lower levels.
How to Identify a Market Structure Shift on the Chart
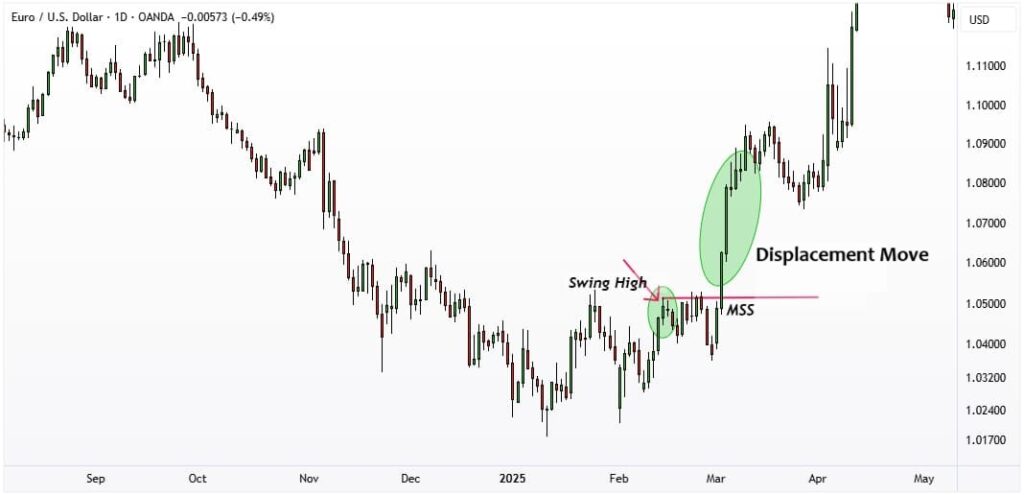
Any break of a swing high or swing low can be considered a Market Structure Shift (MSS), especially when this break is accompanied by a displacement move. A displacement move refers to a sudden and strong price movement, signaling significant liquidity entering the market, often associated with smart money activity.
Valid Swing Highs: Formed when the highest price of the middle candlestick is higher than the highest prices of the two adjacent candlesticks.
Valid Swing Lows: Formed when the lowest price of the middle candlestick is lower than the lowest prices of the two adjacent candlesticks.
Recognizing these patterns helps traders identify potential trend reversals, confirm the presence of institutional activity, and improve the timing of entries and exits in both short-term and long-term trading strategies.
How to Detect a Market Structure Shift by Analyzing New Highs and Lows in Market Trends
One of the fundamental methods to identify a Market Structure Shift (MSS) is through the analysis of new highs and lows on the price chart.
- In an uptrend, if prices create a new low that is lower than the most recent low, this may signal a potential trend reversal from bullish to bearish.
- Additionally, in a downtrend, if prices form a new high that exceeds the previous high, this may indicate a potential trend reversal from bearish to bullish.
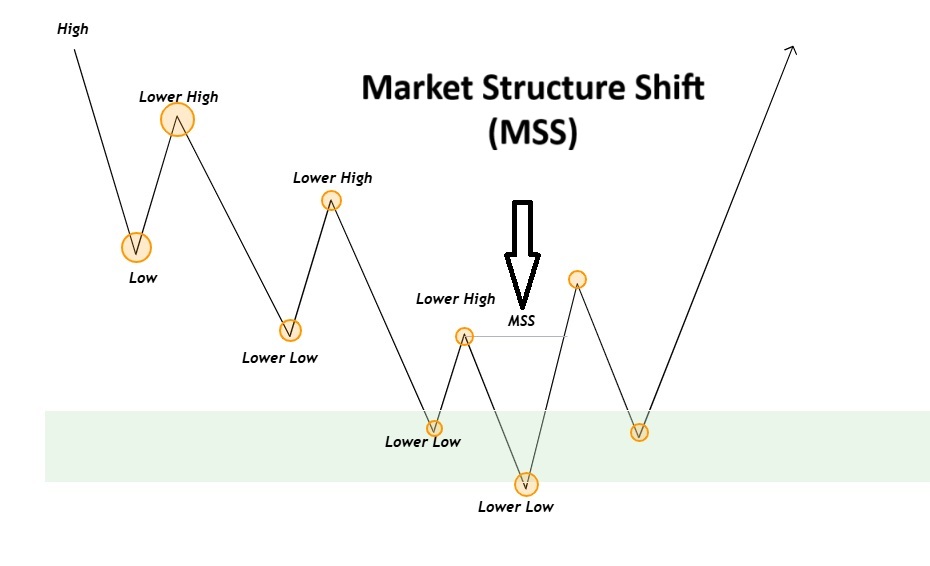
By observing these formations of new highs and lows within ongoing trends, traders can identify shifts in market structure early and adjust their trading strategies to capitalize on emerging opportunities.
Auxiliary Tools for Identifying Market Structure Shift
To identify a Market Structure Shift (MSS) on a chart, traders and analysts can rely on various tools that enhance accuracy and confidence. Some of the key auxiliary tools include:
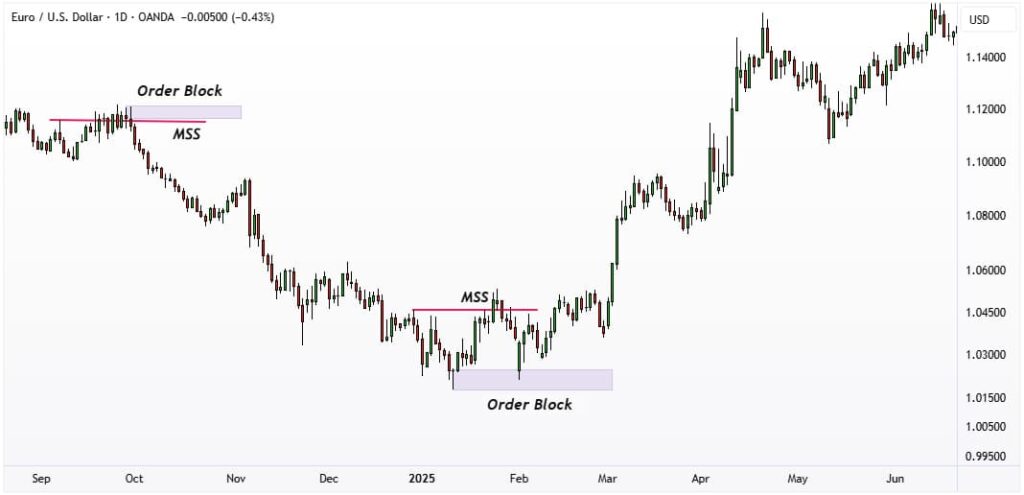
Order Blocks
Order blocks are zones where significant buy or sell orders have accumulated. These areas typically form after a strong price movement, either upward or downward, and can act as new support or resistance levels, serving as a reliable signal for an impending Market Structure Shift.
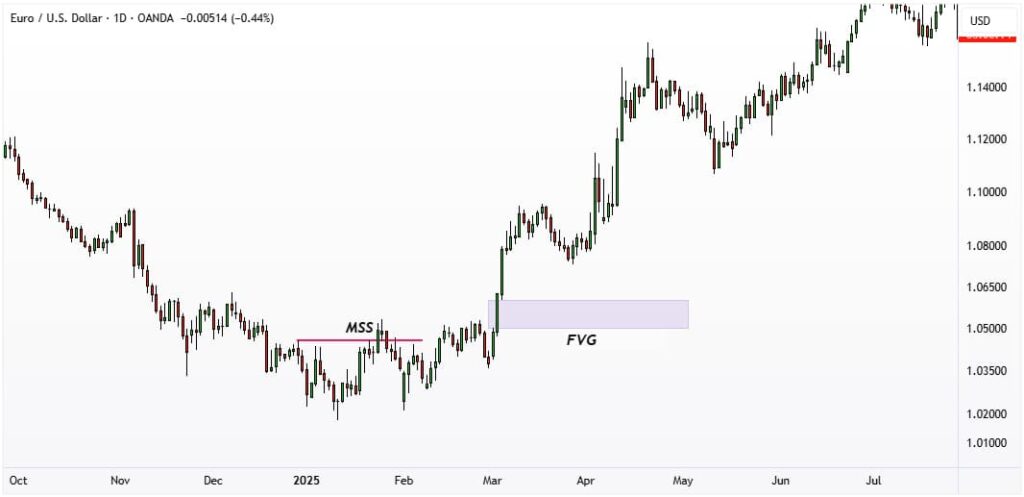
Fair Value Gap (FVG)
A Fair Value Gap (FVG) on a price chart occurs when the market moves from one price level to another without any trades taking place between those levels. FVGs can indicate an imbalance in the market and serve as a signal for price displacement and the identification of emerging trends. Once formed, these areas can act as new support or resistance levels. When the price revisits these zones, the market may react, which can be recognized as a Market Structure Shift (MSS).
For example:
- If the price suddenly rises from a support level and creates a gap, it may signal buyer entry and the start of a bullish trend.
- If the price drops from a resistance level and forms a gap, this can indicate a bearish trend shift.
Steps to identify a Market Structure Shift using FVGs:
- Formation of a fast and strong price movement;
- Creation of a gap between candlesticks;
- Price returns to the gap area and reacts, confirming the market shift.
Using Technical Indicators
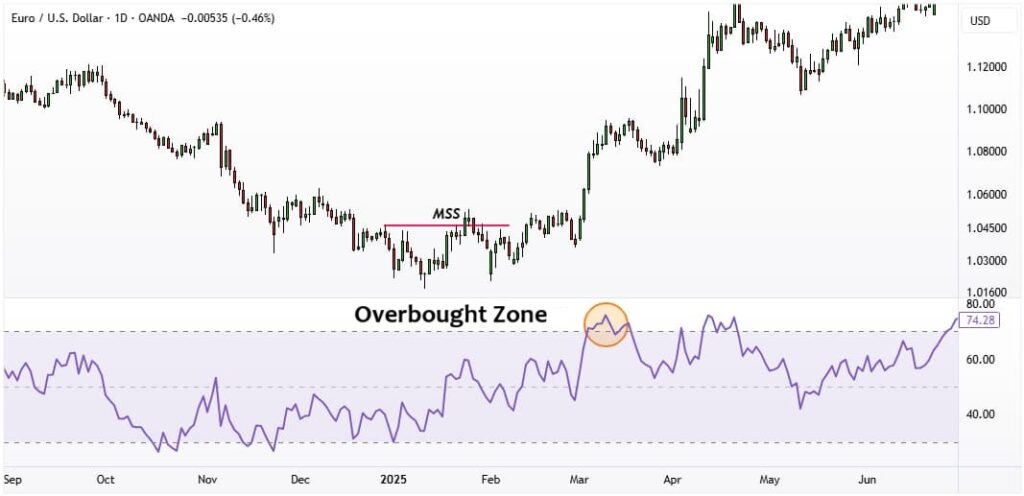
Utilizing indicators such as RSI (Relative Strength Index) can help traders assess market conditions and the strength of the current trend.
When the RSI enters overbought/oversold zones or shows divergence with the price chart simultaneously with a Market Structure Shift (MSS), the validity of the signal is significantly enhanced.
Common Trader Mistakes in Identifying Market Structure Shift and How to Avoid Them
One of the major challenges in analyzing Market Structure Shift is the potential for trader errors. Some of the most common mistakes include:
- Ignoring sufficient confirmations: Many traders attempt to identify an MSS based on a single indicator or signal, whereas it is essential to use multiple tools to confirm a trend change.
- Predicting shifts before they occur: Anticipating a major shift before it actually happens carries substantial risk. Traders should wait for final confirmation from price movements and key breakouts.
- Neglecting trading volume: In many cases, volume can serve as a reliable indicator of an impending trend change.
One of the most common mistakes traders make when identifying a Market Structure Shift (MSS) is attempting to do so without a clear displacement.
How to Determine More Accurate Entry and Exit Points by Identifying Market Structure Shift
By identifying a Market Structure Shift (MSS) and confirming its validity, traders can determine their entry and exit points more accurately:
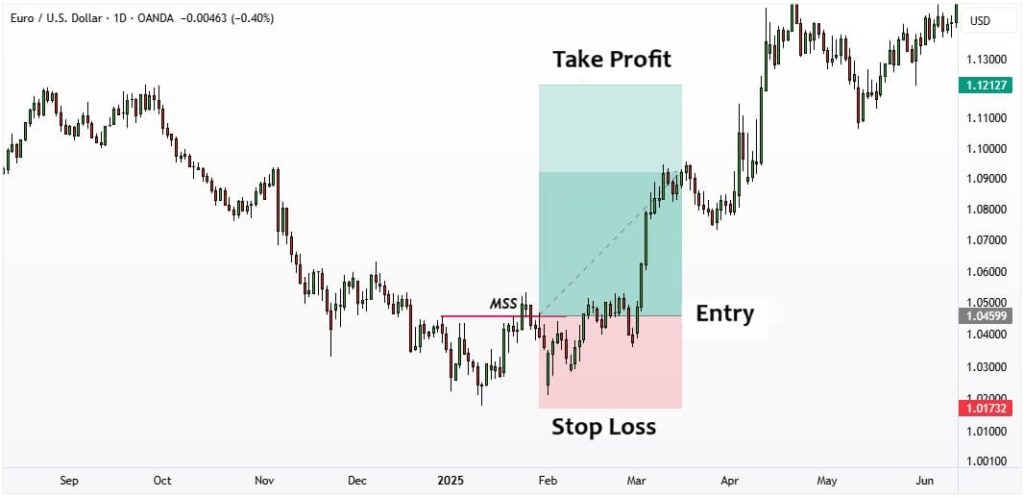
Entry Points:
When a Market Structure Shift is confirmed — for example, through the break of support or resistance levels with high volume, the formation of an FVG (Fair Value Gap), or the development of a classic reversal pattern — it can serve as a valid entry point for buying or selling.
In a bullish Market Structure Shift, consider entering a Buy position.
In a bearish Market Structure Shift, consider entering a Sell position.
Exit Points:
To determine exit points when trading using Market Structure Shift (MSS):
- In a bearish Market Structure Shift, place your stop loss above the previous swing high before the MSS formation.
- In a bullish Market Structure Shift, place your stop loss below the most recent swing low prior to the MSS formation.
Profit Target:
Set the take-profit level at extreme levels, meaning areas where prices reached their highest or lowest points in the previous trend.
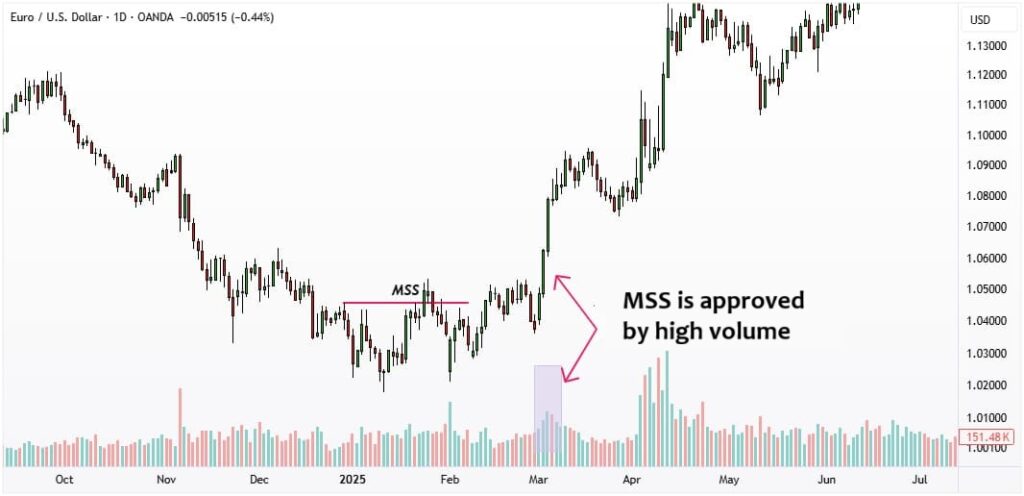
Combining Market Structure Shift with Volume Indicator
The volume indicator is a key tool in technical analysis that helps identify changes in market trend strength. When a Market Structure Shift (MSS) occurs, trading volume serves as one of the most important signals to confirm this change. Here’s how to interpret the volume indicator to validate a market shift:
- High Volume: If the trend change is accompanied by increased volume, it indicates the strength of the new trend and can be used as a signal to enter a trade.
- Low Volume: If the trend change occurs with low volume, it may suggest weakness in the new trend and the market could soon revert to its previous
Combining Market Structure Shift with Supply and Demand
Supply and demand are fundamental concepts in financial markets. Changes in supply and demand can indicate potential shifts in price trends and help identify Market Structure Shift:
- Increasing Demand: If demand suddenly rises, prices move upward, signaling the potential start of a new bullish trend.
- Increasing Supply: If supply suddenly increases, prices move downward, indicating the potential onset of a new bearish trend.
Combining Market Structure Shift with Candlestick Patterns
Candlestick patterns are an essential tool for identifying changes in market structure and can assist in spotting Market Structure Shift (MSS), especially when prices are reversing from key levels. Some commonly used candlestick patterns in this context include:
- Doji: This pattern represents market indecision and may act as an early indication of a forthcoming market structure shift.
- Engulfing: This pattern occurs when a large candlestick completely engulfs the previous one, potentially signaling a trend reversal.
Conclusion
Market Structure Shift (MSS) is a powerful tool in price action trading, enabling traders to anticipate trend reversals and make more precise, strategic trading decisions. By leveraging MSS, traders can optimize entry and exit points, set stop-loss levels, and define profit targets more effectively, thereby minimizing unnecessary risk.


