


The price fluctuations we see in financial markets are only the tip of the iceberg. What happens behind these movements is the flow of liquidity, also known as smart money. The MFI indicator is exactly the tool that helps you identify these hidden yet powerful flows and trade alongside the major market players instead of against them. Unlike many indicators that analyze only price, the MFI combines both price and trading volume to provide a deeper picture of investor behavior. If you are looking for a tool that can give you a clearer understanding of the inflow and outflow of liquidity in the market so you can identify more professional entry points, stay with us.

- Unlike the RSI, the MFI indicator considers both price and trading volume, providing more accurate signals.
- A divergence between the MFI and price movement can indicate a potential trend reversal, even before it becomes visible on the price chart.
- Like other technical tools, the MFI may produce false signals, so it’s recommended to use it alongside other indicators.
- The default time frame for the MFI is typically 14 periods, but it can be adjusted according to your trading strategy.
What Is the MFI Indicator and How Does It Work?
The Money Flow Index (MFI) is a popular technical analysis tool that helps traders evaluate the inflow and outflow of money in a particular asset. This indicator combines price and volume data, making it a unique tool compared to many other technical indicators that rely solely on price action.
The MFI was developed by Gene Quong and Avrum Soudack and is considered an enhanced version of the Relative Strength Index (RSI). The main difference between the two is that the RSI focuses only on price changes, while the MFI incorporates both price and volume. This gives the MFI a more comprehensive view of market dynamics and provides more accurate insights into the true strength of trends. Because of this, some analysts refer to it as the “volume-weighted RSI.” For more detailed calculation methods, you can refer to StockCharts.
The MFI indicator has a wide range of applications, including:
- Identifying Overbought and Oversold Conditions: When the MFI rises above 80, it indicates overbought conditions, suggesting a potential price decline. Conversely, when it drops below 20, it signals oversold conditions, which may precede a price increase.
- Spotting Divergences: If the price and the MFI move in opposite directions, a divergence occurs, which can serve as an early warning of a potential trend reversal.
- Trend Confirmation: By analyzing trading volume, the MFI helps confirm the strength of bullish or bearish trends and reduces the likelihood of false signals.
How to Calculate the MFI Indicator
Calculating the Money Flow Index (MFI) is a step-by-step process that analyzes the flow of money in an asset using both price and volume data. You do not need to memorize the complex MFI formula, but understanding its general steps helps you better grasp how it works. Here, without going into heavy mathematical details, we will explain the calculation process in simple terms and clarify it with a numerical example.
Step 1: Calculate the Typical Price (TP)
Formula:

Typical Price = (High + Low + Close) ÷ 3
Example:
- High = 50
- Low = 40
- Close = 45
Calculation:
Typical Price = (50 + 40 + 45) ÷ 3 = 135 ÷ 3 = 45
✅ This number is the basis for all further calculations in the MFI indicator.
Step 2: Calculate the Money Flow (MF)
Formula:
Money Flow = Typical Price × Volume
Example:
- Typical Price = 45
- Volume = 1000
Calculation:
Money Flow = 45 × 1000 = 45000
✅ This number represents the amount of money that entered the market that day.
Step 3: Determine Positive and Negative Money Flow
Rule:
- If today’s Typical Price > yesterday’s → Positive Money Flow
- If today’s Typical Price < yesterday’s → Negative Money Flow
Example:
- Yesterday’s Typical Price = 43
- Today’s Typical Price = 45
Since 45 > 43, 45000 is added to the Positive Money Flow.
🔁 This process is repeated for a specific period (for example, 14 days).
Step 4: Calculate the Money Flow Ratio and MFI
Formulas:
Money Flow Ratio = Sum of Positive Money Flow ÷ Sum of Negative Money Flow
MFI = 100 - (100 ÷ (1 + Money Flow Ratio))
Example:
- Sum of Positive Money Flow = 600000
- Sum of Negative Money Flow = 300000
✅ The MFI is a value between 0 and 100 and is often used together with indicators such as the Moving Average.
How to Get Buy and Sell Signals with the MFI
The Money Flow Index (MFI) is calculated using price and trading volume, helping traders identify buy and sell signals. For signal analysis, values above 80 and below 20 are examined.
Overbought and Oversold Zones in the MFI
The overbought zone (above 80) and oversold zone (below 20) are key areas in the MFI. When the MFI moves above 80, it indicates excessive buying pressure and a potential price decrease. In contrast, when it falls below 20, selling pressure dominates and the price may rise. For example, in Apple’s stock chart, if the MFI reaches 85, it does not mean you should immediately start selling.
Note: The overbought and oversold levels indicated by the MFI should not be relied upon alone. It is essential to combine the MFI with other tools such as moving averages or trendlines for more accurate analysis.
Divergence and Reversal Signals in the MFI
A divergence occurs when the MFI and price move in opposite directions.
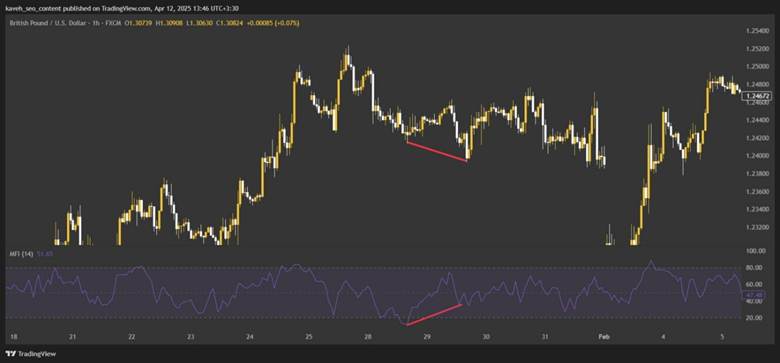
- A positive divergence happens when the price makes a lower low but the MFI forms a higher low, which is a bullish signal.
- A negative divergence occurs when the price makes a higher high but the MFI forms a lower high, which is a bearish signal.
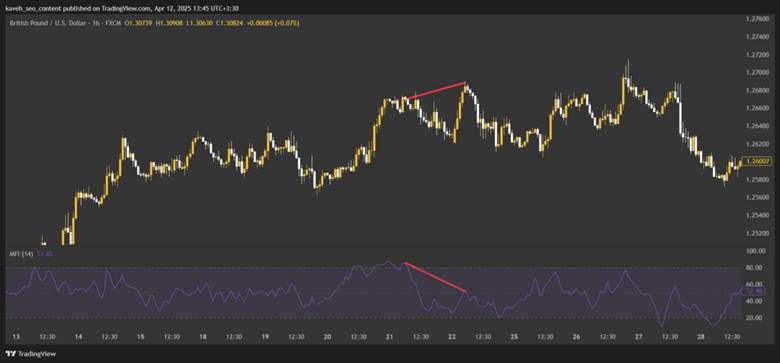
For example, in the GBP/USD currency pair chart, if the price reaches a new high but the MFI declines, identifying divergence with the MFI can help predict a trend reversal. These signals are more reliable when they occur in extreme zones (above 80 or below 20). The relationship between divergence and trend reversal helps traders detect market reversals more accurately, especially when combined with price action.
Optimal Settings for the MFI Indicator
The settings of the MFI indicator are one of the most important factors for using this tool effectively in technical analysis. The Money Flow Index (MFI) by default uses a 14-period timeframe, which is widely accepted as the standard among most traders. This configuration allows you to maintain a balance between the sensitivity and accuracy of the signals.
The default 14-period setting in the MFI indicator serves as an ideal starting point because it collects enough price and volume data to generate reliable signals. If you reduce this period (for example, to 7 or 10), the indicator becomes more sensitive and reacts faster to short-term price changes, which is suitable for short-term strategies.
However, this higher sensitivity may also result in more false signals. On the other hand, increasing the period (for example, to 20 or 30) decreases sensitivity and works better for long-term strategies that require confirmation of stable trends.
Note: In lower timeframes (such as the 1-hour chart), setting the period to 14 may generate false signals. It is better to combine it with tools like moving averages for more reliable analysis.
In the stock market, a 14-period setting on the daily timeframe is often sufficient since there is less volatility compared to forex. In forex, where market movements are faster, a 10-period setting on the 1-hour or 4-hour timeframe can provide more accurate signals.
For cryptocurrencies, due to their high volatility, a 7 to 14 period on the 15-minute or 1-hour timeframe is recommended. The choice of timeframe and MFI settings should match your trading style and market conditions to achieve the best performance from this indicator.
Advantages and Disadvantages of the MFI Indicator
The Money Flow Index (MFI) is a powerful tool in technical analysis that, due to its unique features, offers significant advantages as well as some drawbacks that should be considered for proper risk management. Below, we examine both sides of using this indicator.
Advantages of the MFI Indicator
َAccording to Investopedia, one of the greatest strengths of the MFI indicator is its combination of price and volume data. Unlike indicators such as the RSI that consider only price, the MFI incorporates volume, providing a more accurate picture of liquidity flow. This makes it a valuable tool for detecting smart money movements, as it can show whether significant capital is entering or leaving an asset.
In addition, the MFI is highly effective in identifying divergences. For instance, when the price and MFI move in opposite directions, it can serve as a strong signal of a potential trend reversal, which is particularly useful for traders.
Disadvantages of the MFI Indicator
Despite its advantages, the MFI may perform poorly in low-volume markets with high volatility. In such conditions, limited volume data can cause unrealistic fluctuations in the indicator, leading to misleading analysis.
Another major drawback is its tendency to produce false signals. Especially in highly volatile or sideways markets, the MFI may issue signals that do not align with actual price movements. This highlights the importance of proper risk management and the need to combine the MFI with other tools such as the BW MFI indicator or price action analysis to avoid inaccurate trading decisions.
Summary Table of MFI Pros and Cons:
| Advantages | Disadvantages |
|---|---|
| Combines price and volume data | High volatility in low-volume markets |
| Detects smart money movement | False signals in sideways trends |
| Accurate and reliable divergence detection | Requires confirmation from other tools |
Comprehensive Comparison Between the MFI and OBV Indicators
A complete comparison between the Money Flow Index (MFI) and the On-Balance Volume (OBV) indicators shows that both are volume-based technical analysis tools, but they differ significantly in their calculations and applications.
The MFI indicator combines both price and volume, giving it a more dynamic and oscillating behavior. It moves within a range of 0 to 100 and is mainly used to identify overbought and oversold levels or divergences between price and volume.
In contrast, the OBV indicator (On-Balance Volume) is calculated solely based on trading volume and does not take price values directly into account. OBV adds or subtracts volume depending on the direction of price movement, resulting in a smoother and more stable line that is primarily used to confirm trends.
The calculation methods of these two indicators are naturally different. OBV simply adds volume when the price closes higher and subtracts volume when the price closes lower. This makes OBV a more linear and straightforward tool.
On the other hand, the MFI calculates the Typical Price (High + Low + Close ÷ 3), multiplies it by the volume to determine the raw money flow, and then derives the final MFI value based on the ratio of positive to negative money flow. This more complex calculation makes the MFI more responsive and sensitive to market changes.
For more detailed information about the MFI indicator, you can refer to Investopedia.
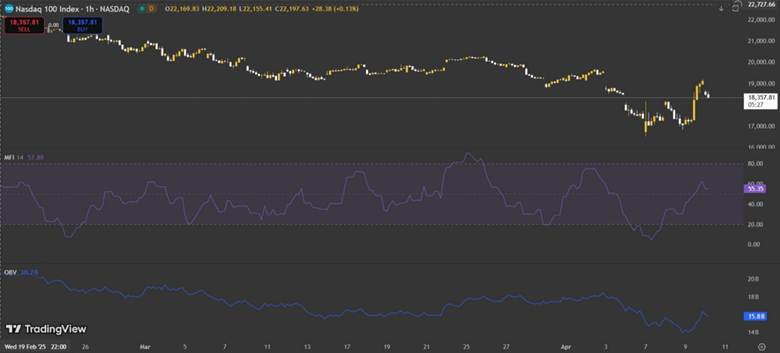
In conclusion, a full comparison between MFI and OBV shows that the choice between the two depends on your trading strategy. The MFI is generally better suited for short-term trading and momentum analysis, while the OBV is more effective for confirming long-term, sustained trends.
The Relationship Between Trading Volume and the MFI Indicator
The relationship between volume and the Money Flow Index (MFI) is a fundamental connection. Unlike many classic indicators that only examine price fluctuations, the MFI also takes trading volume into account as a determining factor for assessing market strength. In fact, the MFI uses the average daily price and volume to calculate money flow and helps the analyst determine whether smart money is entering or leaving the market by comparing positive and negative money flows.
When examining the relationship between volume and the MFI, we encounter the following scenarios:
- When the price increases and trading volume is also high, the MFI rises, indicating strong liquidity inflow into the market.
- When the price decreases and trading volume is high, the MFI drops, which could signal widespread selling.
However, the most significant point arises when there is divergence or misalignment between price and volume. For example, if the price is rising but the MFI is falling due to a decrease in volume (or vice versa), this lack of convergence between price and volume can signal weakness in the current trend and increase the likelihood of a price reversal or a potential correction phase.
Identifying Trend Reversals with the MFI Indicator
The Money Flow Index (MFI) is a powerful tool for identifying trend changes by analyzing liquidity flow. A key factor in predicting trend reversals is the change in momentum within the MFI.
When the MFI rises, it indicates that smart money is entering the market, strengthening the uptrend. However, if the MFI starts to fall from high levels like 80 during an uptrend, this drop in momentum may signal a weakening trend and the start of a downtrend.
In contrast, during a downtrend, if the MFI begins to rise from a low level like 20, it can indicate an increase in momentum, suggesting the potential start of an uptrend.

One important signal to watch for is divergence. For example, if the price makes a new high but the MFI registers a lower high, this negative divergence can confirm a trend reversal.
Another key signal occurs when the MFI crosses critical levels like 80 or 20. If the MFI drops below 80, it could indicate the end of an uptrend and the beginning of a downtrend. This signal is stronger when combined with divergence.
For example, in the EUR/USD daily chart, if the price creates higher highs but the MFI forms lower highs, and then the MFI falls below 80, it signals a bearish divergence and a potential selling opportunity.
As a practical example, if a stock’s MFI has been in the overbought zone (above 80) for a while and then drops below that level, while the price fails to make a new high, this combination can signal a trend reversal and a good time to enter a new trade.
Strategy of Combining the MFI and RSI Indicators
Combining the RSI and MFI indicators is an effective market analysis method that integrates both volume and price perspectives. The MFI (Money Flow Index) focuses on trading volume, while the RSI (Relative Strength Index) is based on price changes. To confirm signals, RSI can be used to examine overbought or oversold areas of the MFI. If both indicators are in the extreme zones (for example, MFI below 20 and RSI below 30) or show similar divergence, the validity of the signal significantly increases.
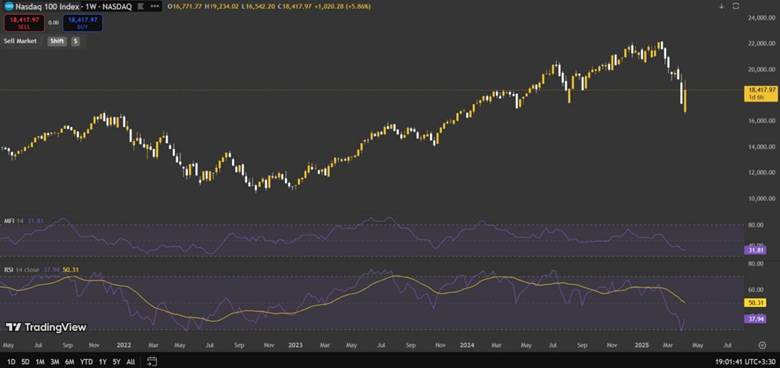
The MFI and RSI indicators provide a broader market view by combining volume-based and price-based data. For instance, in an oversold area, if the MFI is below 20 and the RSI is below 30, this signal indicates excessive selling pressure and the possibility of a price reversal. In this case, traders can enter a buy position with greater confidence.
Combining the MFI and MACD Indicators
Combining the MFI with the MACD indicator is a powerful method for market analysis. The MACD helps identify the direction of the trend, while the MFI (Money Flow Index) determines the best timing for entry.
The MACD indicator shows trend direction through signal line crossovers, and the MFI analyzes buying and selling pressure to identify entry points. A simple strategy works as follows: when the MACD is bullish (the MACD line is above the signal line) and the MFI rises from below 20 (the oversold zone), it signals a potential buying opportunity. This combination confirms the beginning of an upward trend.
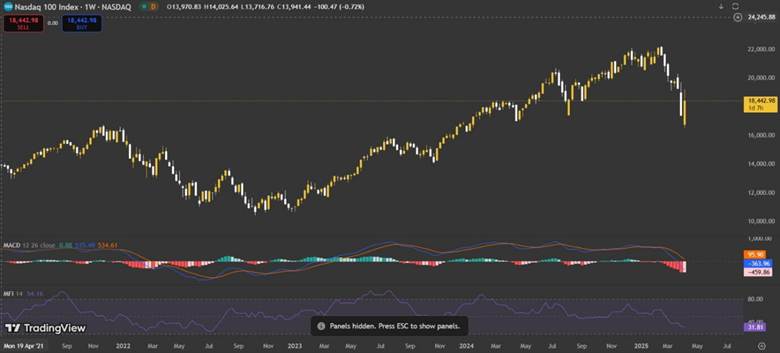
The MACD identifies the trend, and the MFI confirms its strength by showing liquidity flow. For example, if the MACD is bullish and the MFI moves above 50, it strengthens the buying trend.
When the MFI shows a positive divergence (a higher low in the MFI while the price forms a lower low) and the MACD simultaneously gives a bullish crossover, the likelihood of a trend reversal to the upside increases.
Conclusion
The MFI indicator is not just a tool but an intelligent way to view the depth of the market. By using this index correctly, you can recognize when large investors enter the market and when it begins to lose momentum. It serves as a compass that guides you through the confusing fluctuations of the market.
If you adjust this tool properly and combine it with other analytical methods, you can elevate your trading strategy to a higher level, where you are no longer just a trader but a liquidity flow analyst.
Now that you are familiar with the function, settings, and practical strategies of the MFI, it is time to make this indicator an essential part of your daily market analysis.