icon icon Home
icon icon Accounts
icon icon Quick start
icon icon Symbols

Optimal Trade Entry Techniques for ICT Traders

Author
Abe Cofnas
Abe Cofnas
calendar Last update: 27 February 2026
watch Reading time: 11 min

Optimal Trade Entry (OTE) is a way ICT traders use Fibonacci to find a high-probability pullback zone inside a clear swing (usually the 61.8% to 79% retracement), but the real question is this: are you using it as a smart location tool (with structure and liquidity), or just drawing fibs on every dip and hoping it bounces?

bookmark
Key Points:
  • In ICT/SMC, OTE is a location, not a signal. It works best when it aligns with market structure and liquidity.
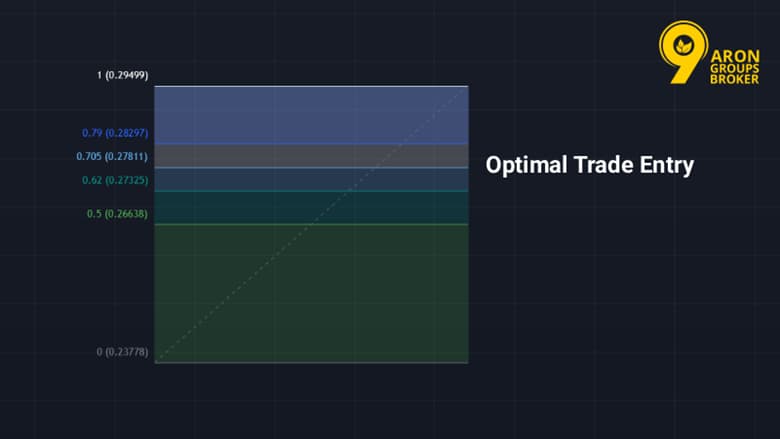
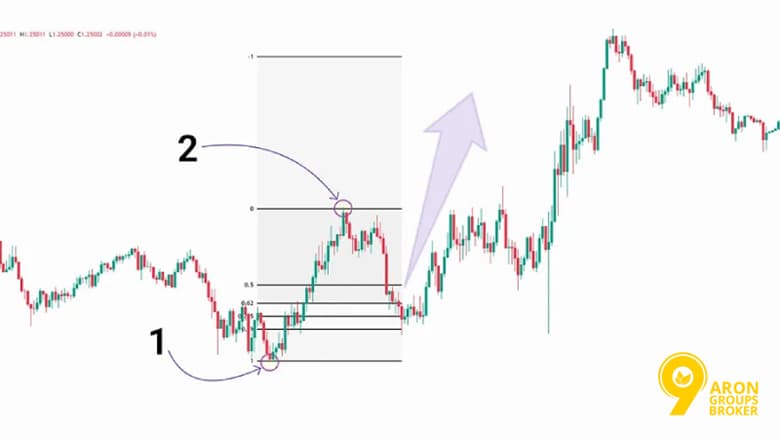
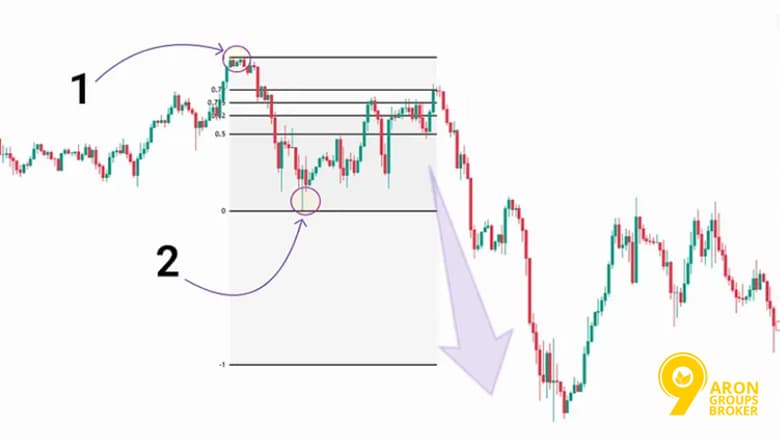
  • The commonly taught OTE sweet spot is 61.8%–79%, with 70.5% (0.705) often highlighted as a key level.
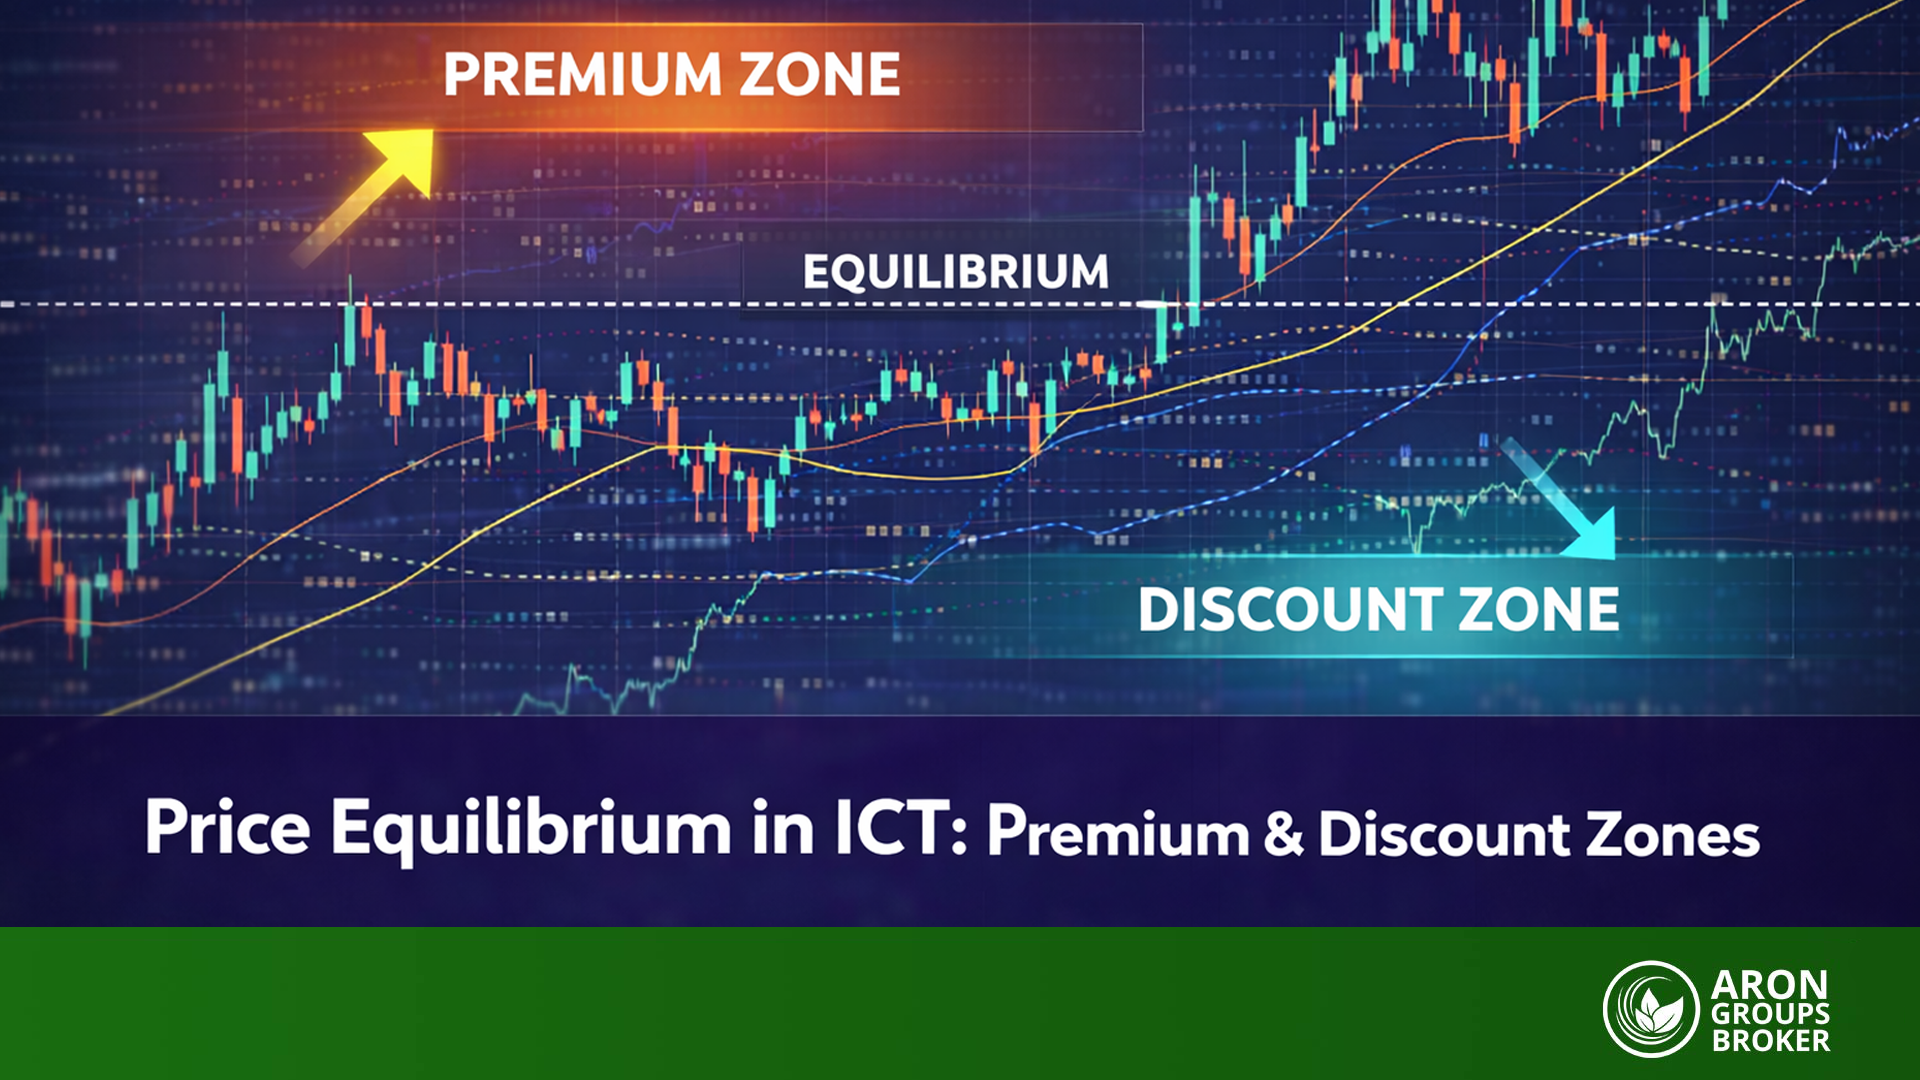
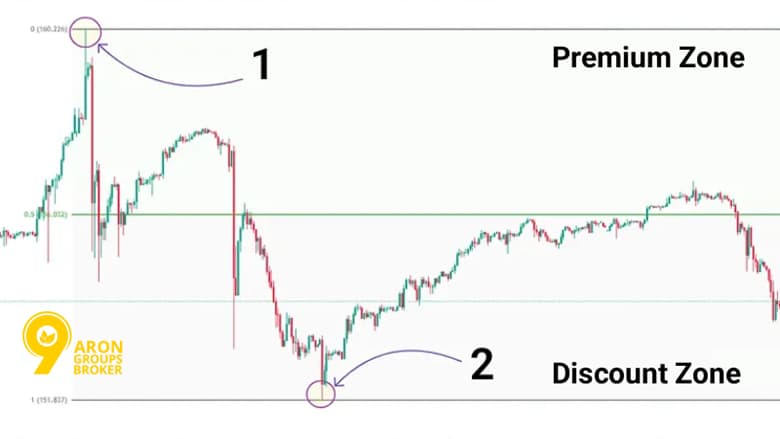
  • Equilibrium (0.50) splits the swing into premium vs discount. OTE sits deeper than EQ and is used to time the pullback entry.
  • OTE is not a Fibonacci retracement. It needs a valid impulse leg and a clear swing high/low.
  • The strongest OTEs often appear after a liquidity sweep, then a pullback into OTE + a clean PD array (OB/FVG).
  • Higher timeframes define the story. Lower timeframes refine the entry.

Understanding Optimal Trade Entry (OTE)

OTE sits inside the ICT / Smart Money Concept as a disciplined way to enter after the market has shown intent. It forces you to wait for a pullback into a defined zone, rather than chasing the move.

What Is ICT Optimal Trade Entry?

According to HowToTrade, ICT Optimal Trade Entry is the idea that, after a clear impulse move, price often retraces into a specific Fibonacci band that offers a better entry location and tighter invalidation.

In most ICT-style teaching, that OTE zone is roughly:

  • 0.62 (61.8%)
  • 0.705 (70.5%)
  • 0.79 (79%)
optimal trade entry

It’s not a magic reversal zone. It’s where you prefer price to pull back if your structure and liquidity narrative make sense.

OTE vs Simple Fibonacci Pullbacks

A simple Fibonacci pullback is often: Price retraced to a level, so I buy/sell.
OTE is more selective: Price retraced into the OTE band after a valid swing, and it aligns with structure and liquidity.

A quick way to tell the difference:

  • Simple pullback: fib first, context later.
  • OTE: context first, fib second.

Market Structure’s Role in OTE

OTE needs a clean impulse leg. That impulse should make structural sense.
If the structure is messy, OTE loses its edge.

Practical structure checklist (keep it short):

  • Was there a clear swing high/swing low?
  • Did the impulse show displacement (not slow drift)?
  • Did it break a prior structure level (even slightly)?

When the structure is clear, OTE becomes a location-finding tool. Then you hunt for the how (PD arrays) later.

OTE Fibonacci Levels

Fibonacci retracement is the measuring tool behind OTE. In ICT, fib is used with specific levels and a premium/discount mindset, not as a generic indicator.

Fibonacci Retracement Structure:

Fibonacci RatioTechnical Interpretation
0.00Initial profit-taking zone (first partial exit level)
0.50Midpoint of the range, representing price balance
0.62Lower threshold of the Optimal Trade Entry (OTE) zone
0.705Core Optimal Trade Entry (OTE) level
0.79Upper threshold of the OTE zone
1.00Full retracement to the origin of the move
-0.50Primary expansion objective (first projected target)

Key Fibonacci Levels: 61.8%–79% Retracement

As TradingFinder pointed out, the OTE zone most commonly referenced in ICT-style material sits between 61.8% and 79% retracement of the impulse leg, with 0.705 often treated as the sweet spot.

How to draw it correctly (most important part):

  • Bullish leg: draw fib from swing low → swing high.
Optimal Trade Entry Techniques for ICT Traders
  • Bearish leg: draw fib from swing high → swing low.
Optimal Trade Entry Techniques for ICT Traders

If you flip the anchors, your OTE zone flips too. Then you’ll keep missing entries for no reason.

Premium vs Discount OTE Logic

Premium/discount is the value lens. It starts with equilibrium (0.50) as the midpoint. Below 0.50 is a discount. Above 0.50 is premium.

So where does OTE fit?

  • For bullish ideas, you want price to pull back into the discount, then into the deeper OTE band (0.62–0.79).
  • For bearish ideas, you want price to retrace into the corresponding OTE band on the premium side of that bearish swing (based on how you draw the fib).
optimal trade entry

Equilibrium vs OTE (simple distinction):

  • EQ (0.50): balance point. Useful filter.
  • OTE (0.62–0.79): deeper pullback zone. Used for better pricing.
sms-star

Remember:
EQ tells you not to chase. OTE tells you to wait for the value.

ICT OTE Fibonacci Settings

You don’t need twenty fib lines. You need the ones you’ll actually use.

A common ICT-style fib set includes:

  • 0.50 (EQ)
  • 0.62
  • 0.705
  • 0.79

Practical setup tip:

  • Add those levels.
  • Hide the rest.
  • Label them clearly (EQ, 62, OTE 70.5, 79).

This keeps your chart readable. It also stops you from level-shopping mid-trade.

OTE and Market Context

OTE becomes powerful when it’s not alone. Context decides whether an OTE pullback is a genuine opportunity or just a pause before continuation against you.

OTE Inside the ICT Dealing Range

OTE works best when it sits inside a clear swing framework like an ICT dealing range (a defined high/low you’re measuring).
That dealing range gives you the boundaries. OTE gives you the preferred entry zone within that move.

A clean way to combine them:

  • Define the dealing range high/low (the swing).
  • Mark EQ (0.50).
  • Treat OTE as your discount entry band inside that same swing.

This reduces random fib drawings. You’re always measuring one meaningful leg.

OTE After Liquidity Sweeps

According to Fluxcharts, OTE improves when it follows a liquidity sweep.
Why? Because the sweep often clears stops and creates the conditions for a cleaner reversal or continuation leg.

A practical sequence to study on charts:

  • Price runs an obvious high/low (sweep).
  • Price displaces away (shows intent).
  • Price retraces into OTE.
  • You look for confirmation (later: OB/FVG).
sms-star

Important note:
Don’t assume every wick is a sweep. You want a level that was obvious and liquid.

OTE and Liquidity Alignment

OTE should align with a destination.
In ICT terms, price is often drawn toward liquidity pools (previous highs/lows, equal highs/lows).

So before you use OTE, ask two short questions:

  • What liquidity was just taken?
  • What liquidity is likely next?

If you can’t answer those, you’ll enter OTE with no directional reason. That’s when OTE feels inconsistent.

sms-star

Remember:
The best OTE is the one that sits on the path to a clear liquidity target — not the one that looks perfect on a fib tool.

OTE with PD Arrays (Order Blocks & FVGs)

OTE tells you where you want price to retrace (often 61.8%–79%). PD Arrays tell you what to execute from inside that zone. Think of OTE as the discount/premium address, and PD Arrays as the front door. ICT-style checklists often group FVGs and Order Blocks as PD Arrays used for entry models.

Integrating OTE with Order Blocks

An order block is commonly described as the last opposing candle/zone before a strong impulsive move.
Your goal is simple: find an order block that sits inside the OTE band, not one that sits near it.

Practical workflow (bullish example):

  • Identify the impulse leg (swing low to swing high).
  • Draw fib and mark the OTE zone (62–79, with 70.5 as a key line).
  • Locate the bullish order block that preceded the impulse.
  • Wait for price to retrace into OTE + the order block.
  • Enter only after you see a clean reaction (rejection + follow-through).

Quality filters (fast):

  • The order block caused real displacement, not a slow drift.
  • The return happens in the OTE band, not above it.
  • The trade has a clear liquidity draw (next high/low).
sms-star

Important Point:
OTE without a usable entry model is waiting. An order block without OTE is guessing.

Using Fair Value Gaps for OTE Confirmation

MetroTrade defines a Fair Value Gap (FVG) as a three-candle imbalance where price moves so fast that it skips a zone.
In OTE trading, the FVG helps you time the entry. It gives you a clean area to lean on.

How to use FVG with OTE (simple):

  • First, define the impulse leg and OTE zone (62–79).
  • Then, mark the nearest FVG created by that impulse.
  • Wait for price to retrace into OTE and react off the FVG.
  • Enter the reaction, not on the first touch.

What good looks like:

  • FVG sits inside the OTE band.
  • Reaction is sharp and clean (not choppy).
  • Invalidation is obvious (price should not go deep through the FVG).

Timeframe & Timing Considerations

OTE is easy to draw. Timing is harder. The clean approach is: a higher timeframe gives direction, a lower timeframe gives precision. If you reverse that, you’ll enter perfect OTE zones in the wrong market phase.

Higher vs Lower Timeframe OTE

Use a higher timeframe OTE for the idea, and a lower timeframe OTE for the execution.

A practical split:

  • HTF (e.g., 4H/Daily): define the key swing, premium/discount, and likely liquidity draw.
  • LTF (e.g., 15m/5m): find the OTE retracement and execute using OB/FVG.

A quick rule that keeps you safe:

  • If HTF is in a discount and building higher lows, I only hunt bullish OTE.
  • If HTF is in a premium and building lower highs, I only hunt bearish OTE.
sms-star

Practical Tip:
The lower timeframe is for entries, the higher timeframe is for selecting the entry direction and zone.

Step-by-Step Entry Timing

Here’s a tight routine you can repeat daily.

  • Pick your HTF swing (clear high/low).
  • Decide bias: where is price drawn (next liquidity pool)?
  • Wait for a clean impulse leg in that direction.
  • Draw fib on the impulse and mark OTE (62–79).
  • Identify your PD Array inside OTE (OB or FVG).
  • Let price retrace into the OTE zone.
  • Demand reaction (rejection + follow-through).
  • Only then execute, with clear invalidation and a mapped target.

If any step is missing, you’re early.

Avoiding Timing Mistakes

Most OTE losses are timing errors, not Fibonacci errors.

Common mistakes (and the fix):

  • Drawing fib on a weak leg → Only fib a clear impulse with displacement.
  • Entering the first touch → Wait for a reaction and confirmation candle.
  • Taking OTE in the middle of the swing → OTE is a deeper retracement, not any pullback.
  • Ignoring liquidity → Always name your next draw (high/low/equal highs/lows).
  • Forcing confluence → One clean PD Array is better than five messy ones.
sms-star

Important note:
If price chops through OTE with no reaction, it’s not still loading. It’s telling you the idea is weak.

Practical Strategies and Advanced Techniques

OTE is most useful when you treat it as a repeatable framework, not a one-off setup. The goal is simple: use OTE to get better pricing, then use context to decide whether that pricing is worth taking.

Combining Equilibrium Levels with OTE

Start with Equilibrium (0.50). It tells you whether price is in premium or discount inside your chosen swing. Then use OTE (62–79%) as the deeper entry zone.

A clean two-step filter:

  • Step 1 (EQ filter):
    • Below 0.50 = discount zone
    • Above 0.50 = premium zone
  • Step 2 (OTE entry zone):
    • Wait for retracement into 0.62–0.79, with 0.705 often used as the sweet spot.

Use it like this (quick and practical):

  • Bullish idea: don’t chase above EQ. Wait for price to deliver into discount, then into OTE.
  • Bearish idea: don’t short below EQ. Wait for price to rally into premium, then into OTE.

A simple distinction that keeps you disciplined:

ToolWhat it answersWhat it doesn’t answer
EQ (0.50)Am I chasing?Where is the best entry?
OTE (0.62–0.79)Where is the better pricing?Is the idea valid?
sms-star

Remember:
EQ helps you stop doing the wrong thing. OTE helps you do the right thing at a better price.

Advanced Techniques with ICT OTE

Advanced OTE has no more indicators. It’s a stronger alignment: structure + liquidity + OTE + a clean execution model.

Technique 1: Liquidity event to displacement to OTE

  • Let price take an obvious high/low (liquidity event).
  • Wait for a clear impulsive move away (displacement).
  • Only then measure the retracement and wait for OTE.

Technique 2: OTE + one PD Array, not five

Choose one clean execution model inside OTE:

  • Order block inside OTE, or
  • FVG inside OTE
    Then wait for a reaction. Don’t force confluence.

Technique 3: HTF OTE, LTF trigger

  • Use the higher timeframe to define the swing you care about.
  • Mark EQ and OTE on that swing.
  • Drop down to a lower timeframe only to time the entry (reaction, break-and-retest, clean candle close).

Filtering False Signals in OTE Fib Retracement

Most OTE failures are not failures of the levels. They’re failures of context or timing.

Common false signals

  • You fib a weak leg (no real impulse).
  • You anchor the fib on the wrong swing.
  • Price retraces into OTE, but there is no liquidity narrative.
  • You enter the first touch with no reaction.

Filters that actually help (quick checklist)

  • Impulse quality: Was the move away sharp and obvious?
  • Location: Is OTE sitting on the correct side of EQ (premium/discount)?
  • Confirmation: Did price react and show follow-through, or did it just drift through?
  • Invalidation: Do you have a clear I’m wrong point? If not, skip.

A simple rule that saves accounts:

  • If price trades into OTE and accepts through it with no reaction, treat it as information. Don’t average into hope.

Conclusion

Optimal Trade Entry is best understood as a pricing zone inside a valid swing, usually anchored around 0.62–0.79 with 0.705 as a key reference. Use equilibrium (0.50) to stop chasing, and use OTE only when it aligns with structure and liquidity. Then keep execution simple: one clear PD Array inside OTE, one clear invalidation, one clear liquidity target. That’s how OTE becomes a tool you can repeat, not a pattern you chase.

Continue Reading
not-found
calendar 27 February 2026
Rate this article
Plugin not installed

Leave a Reply

Your email address will not be published. Required fields are marked *

No thanks