icon icon Home
icon icon Accounts
icon icon Quick start
icon icon Symbols

Comprehensive Guide to the PPO (Percentage Price Oscillator) Indicator

Author
Abe Cofnas
Abe Cofnas
calendar Last update: 18 November 2025
watch Reading time: 10 min

The PPO indicator, or Percentage Price Oscillator, is a simple yet practical tool used in financial market analysis, including stocks, forex, and crypto. It helps traders understand price trends more clearly and make better buy or sell decisions.

In this article, we’ll explain what the PPO is, how it works, and how you can apply it in your trading strategy.

bookmark
Key Points:
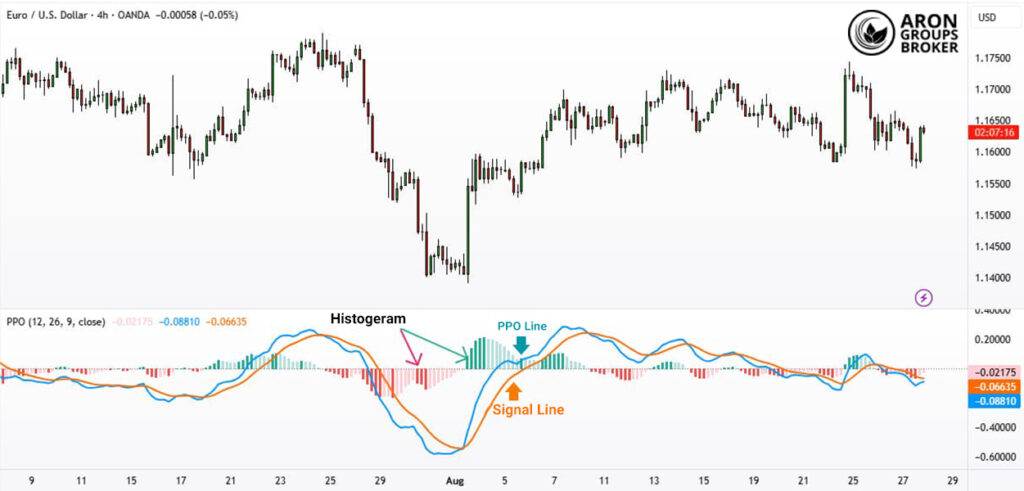
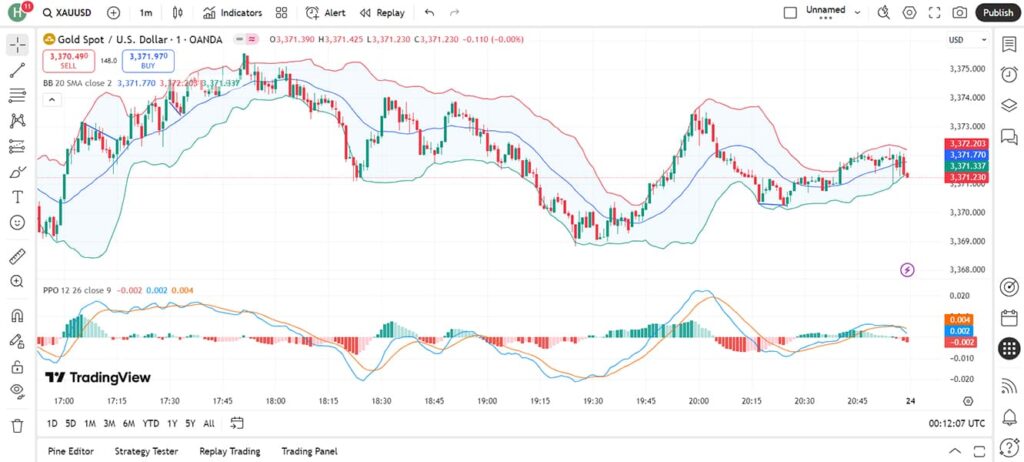
  • Rapid changes in the PPO histogram can signal an upcoming increase or decrease in market volatility even before the main trend reverses.
  • Unlike the MACD, which is based on absolute price values, the PPO expresses movements as percentages, making it easier to compare momentum across different assets (such as stocks, forex pairs, and cryptocurrencies) at a glance.
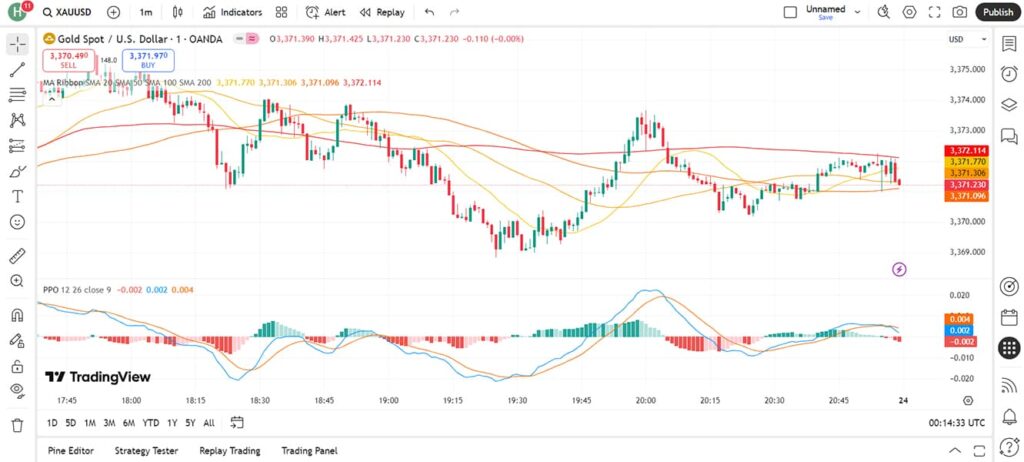
  • Some traders use the PPO as a screener tool, selecting only assets with strongly positive or negative PPO values to identify strong trends.
  • When price breaks a key support or resistance level, a sharp rise or drop in the PPO can confirm the validity of the breakout and increase confidence in trend continuation.

What Is the PPO (Percentage Price Oscillator) Indicator?

According to Investopedia, the PPO (Percentage Price Oscillator) is one of the most widely used tools in technical analysis, designed to measure market momentum. This momentum indicator calculates the difference between two exponential moving averages (EMAs), typically the 12 and 26-period EMAs, and expresses that difference as a percentage of the longer-term EMA (EMA 26).

As shown in the chart, the PPO consists of three main components:

  • PPO Line (Blue): Displays the percentage difference between the two EMAs.
  • Signal Line (Orange): A 9-period EMA of the PPO line, used to confirm buy and sell signals.
  • Histogram (Green and Red Bars): Represents the gap between the PPO line and the signal line, helping visualize the strength and acceleration of the trend.
ppo indicator

The PPO typically provides trading signals in three main ways:

  • Line Crossovers:
    • A buy signal occurs when the PPO line crosses above the signal line.
    • A sell signal occurs when the PPO line crosses below the signal line.
  • Zero-Line Crossovers:
    • When the PPO is above zero, momentum is positive.
    • When it’s below zero, momentum is negative.
  • Divergence with Price Action:
    • A divergence between PPO and price can signal a potential trend reversal.

The main difference between PPO and MACD is that PPO values are percentage-based and therefore independent of the asset’s price level.

For example, whether an asset is priced at $30 or $3,000, PPO values are expressed as percentages, allowing direct comparison of momentum across instruments.

How to Calculate the PPO Indicator (with Example)

According to StockCharts, the PPO indicator is based on Exponential Moving Averages (EMAs) and is calculated using the following formula:

PPO = ((12-day EMA – 26-day EMA) / 26-day EMA) × 100

  • Short-term EMA (12-day): Reacts faster to price changes.
  • Long-term EMA (26-day): Reflects the broader market trend.
  • Signal Line: A 9-day EMA of the PPO value.
  • Histogram: The difference between the PPO and the Signal Line.

Example
Assume a stock has the following data on a specific date:

12-day EMA = 102
26-day EMA = 100

PPO = ((102 – 100) / 100) × 100 = +2%

This means the short-term trend is 2% stronger than the long-term trend.

If the Signal Line is at +1.5%, then:

 Histogram = PPO – Signal = 2 – 1.5 = +0.5

A positive histogram indicates stronger buying momentum.

sms-star

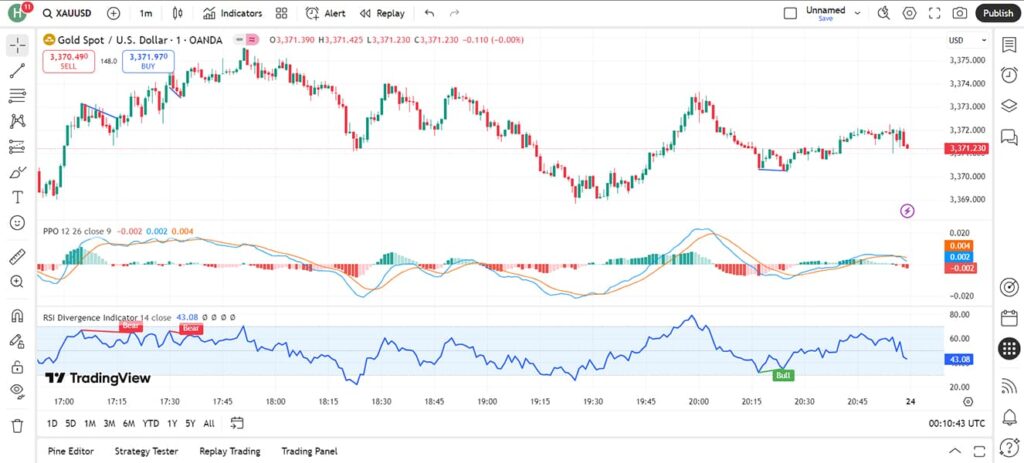
 Sharp changes in the PPO signal line slope can sometimes act as an early warning of a potential market structure break, often ahead of traditional indicators.

Trading Strategies Using the PPO Indicator

The PPO indicator can be applied in various ways within trading strategies. Its main uses include identifying buy and sell signals, analyzing trend strength, and combining with other technical analysis tools for confirmation.

PPO Signal Line Crossovers: Buy and Sell Signals

The PPO indicator consists of two main lines: the PPO Line (blue) and the Signal Line (orange).

ppo indicator
  • Buy Signal: When the PPO line crosses above the signal line, it suggests strong buying momentum. This crossover often coincides with the start of an upward price move (green candles).
  • Sell Signal: When the PPO line crosses below the signal line, it signals that sellers are gaining control. These moments usually align with a price decline (red candles).

As seen on the chart, the crossover of the two lines often matches a color shift in the histogram (from green to red or vice versa), providing stronger confirmation for entries or exits.

This method is especially popular among scalpers on short-term timeframes like 1-minute or 5-minute charts.

Identifying Trends and Divergences with PPO

The PPO is also useful for detecting divergences when price movement and indicator momentum differ, hinting at a possible trend reversal.

ppo indicator
  • Bullish Divergence: When price forms a lower low, but PPO forms a higher low, it signals weakening selling pressure and a potential upward reversal. This setup often aligns with a “Bull” tag on the RSI chart.
  • Bearish Divergence: When price creates a higher high, but PPO shows a lower high, it indicates fading buyer strength and a possible downtrend ahead. This is usually confirmed by a “Bear” signal on the RSI.

Combining PPO with momentum indicators such as RSI or MACD improves divergence accuracy and is particularly effective for swing trading and identifying major trend shifts.

sms-star

Some studies also suggest that PPO alignment with market sentiment data on higher timeframes can help identify large-scale market phase transitions.

Combining PPO with Bollinger Bands

Using PPO alongside Bollinger Bands helps traders spot more reliable entry and exit points.

Comprehensive Guide to the PPO (Percentage Price Oscillator) Indicator
  • Buy Signal: When the PPO line crosses above the signal line while price is near the lower Bollinger Band, it may indicate the end of selling pressure and the start of a bullish move.
  • Sell Signal: When the PPO line crosses below the signal line while price touches the upper Bollinger Band, it suggests growing selling pressure and a potential downside reversal.

This strategy effectively filters false signals, as it combines momentum confirmation (PPO) with price range validation (Bollinger Bands).

Combining PPO with Moving Averages

Integrating PPO with Moving Averages (MA) allows traders to compare momentum signals with the market’s overall trend.

ppo indicator
  • Strong Uptrend: When the PPO is above zero (positive) and price trades above key moving averages such as MA50 or MA200, it confirms a sustained bullish trend.
  • Dominant Downtrend: When the PPO moves below zero (negative) and price remains under MA100 or MA200, it reflects strong selling pressure and a continuing bearish trend.

This combination is valuable for medium-term traders, as PPO provides momentum-based entry and exit signals while moving averages confirm the broader trend direction.

Combining PPO with RSI

While the PPO alone offers valuable momentum insights, pairing it with the RSI (Relative Strength Index) enhances signal accuracy and reduces false entries.

ppo indicator
  • Strong Buy Signal: When the PPO line crosses above the signal line and the RSI simultaneously rebounds from the oversold zone (below 30), it confirms buyer entry and a potential bullish reversal.
  • Strong Sell Signal: When the PPO line crosses below the signal line while the RSI turns down from the overbought zone (above 70), it warns of increasing selling pressure.

This dual confirmation approach helps traders enter only when both indicators align, minimizing false signals. It works well for both short-term and medium-term trades.

Advantages and Disadvantages of Using the PPO Indicator

Let’s review the main strengths and weaknesses of the PPO indicator.

Advantages of the PPO Indicator

  • Cross-asset comparability: Since PPO is percentage-based, it allows comparison across different assets such as stocks, currencies, and commodities, regardless of their price levels.
  • Clear trend direction and momentum: The zero line and histogram make it easy to identify bullish or bearish momentum in the market.
  • Multiple trading signals: Crossovers, divergences, and zero-line breaks offer various opportunities for trade entries and exits.
  • Easy integration with other indicators: PPO works well with tools like RSI, Bollinger Bands, and Moving Averages, improving signal accuracy.
  • Applicable across timeframes: Suitable for both short-term scalping and medium-term trading strategies.
sms-star

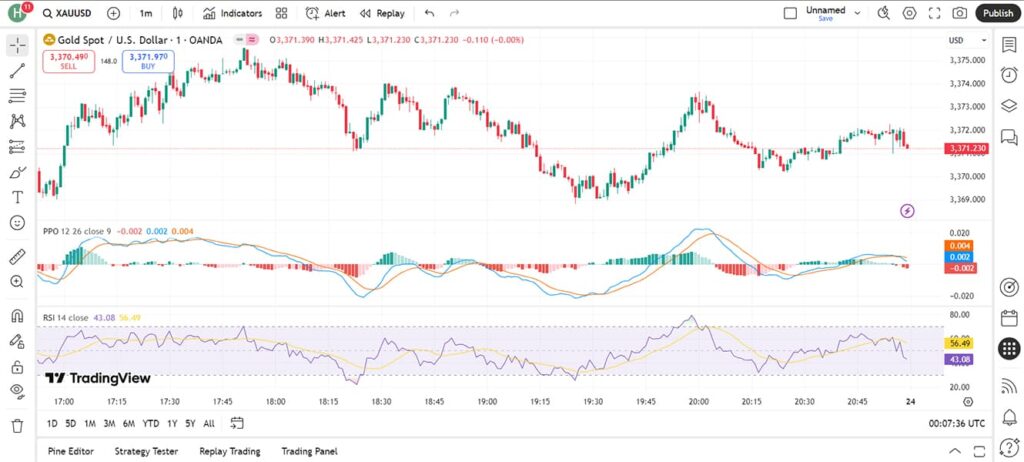
In advanced price action models, the PPO is sometimes used to validate false breakouts, as percentage changes between EMAs often react faster than price itself.

Disadvantages of the PPO Indicator

  • Lagging signals: Like most moving average-based indicators, the PPO reacts after price changes occur.
  • False signals in ranging markets: In sideways or low-volatility markets, PPO crossovers may generate misleading signals.
  • Requires confirmation: The PPO should not be used in isolation and needs validation through complementary indicators or price action.
  • Sensitivity to default settings: Changing the default 12, 26, and 9 periods can produce different outcomes; finding optimal parameters for each market requires experience.
  • Less effective during sharp volatility spikes: During major news events or price shocks, PPO may fail to reflect sudden trend reversals in time.

How to Enable and Set Up the PPO Indicator in MetaTrader and TradingView

To use the PPO indicator effectively, it’s important to know how to activate and configure it in MetaTrader and TradingView. Below is a quick guide for both platforms.

How to Add and Configure the PPO Indicator in TradingView

Follow these steps to add PPO to your chart:

  • At the top of the screen, click Indicators.
  • In the search bar, type PPO.
  • From the list, select PPO (Percentage Price Oscillator).
Comprehensive Guide to the PPO (Percentage Price Oscillator) Indicator
  • Once added, open Settings (the gear icon next to the indicator name) and adjust the parameters as follows:
    • Fast EMA Length = 12
    • Slow EMA Length = 26
    • Signal Smoothing = 9
Comprehensive Guide to the PPO (Percentage Price Oscillator) Indicator
  • Customize the colors of the PPO line, signal line, and histogram for better visibility.
  • In TradingView, you can save your custom settings and apply them across multiple charts.

How to Download and Activate the PPO Indicator in MetaTrader (MT4 / MT5)

To add PPO to MetaTrader, follow these steps:

  1. Download the PPO Indicator
  • Visit reputable MetaTrader indicator websites such as MQL5.com or trading forums.
  • The file extension is usually .mq4 / .ex4 for MT4 and .mq5 / .ex5 for MT5.
  1. Move the File to the MetaTrader Folder
  • Open MetaTrader and go to File > Open Data Folder.
  • Navigate to MQL4 > Indicators (for MT4) or MQL5 > Indicators (for MT5).
  • Copy the downloaded PPO file into this folder.
  1. Restart MetaTrader
  • Close and reopen MetaTrader so the new indicator appears in the list.
  1. Add PPO to Your Chart
  • Go to Navigator > Indicators > Custom Indicators.
  • Select PPO and apply it to your chart.
  1. Adjust the Parameters
    Default settings are typically:
  • Fast EMA = 12
  • Slow EMA = 26
  • Signal EMA = 9

You can also modify line colors, thickness, or histogram style for clarity.

ppo indicator
sms-star

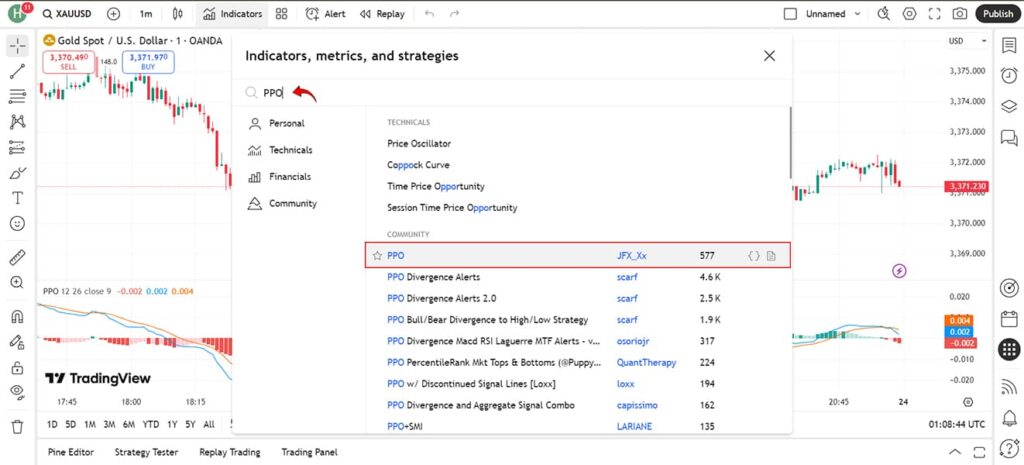
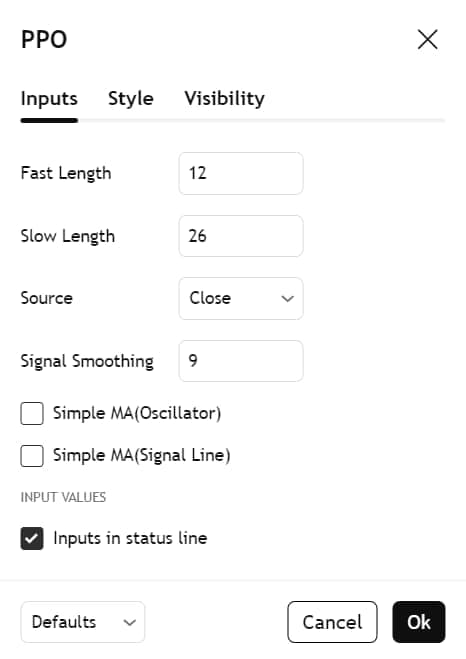
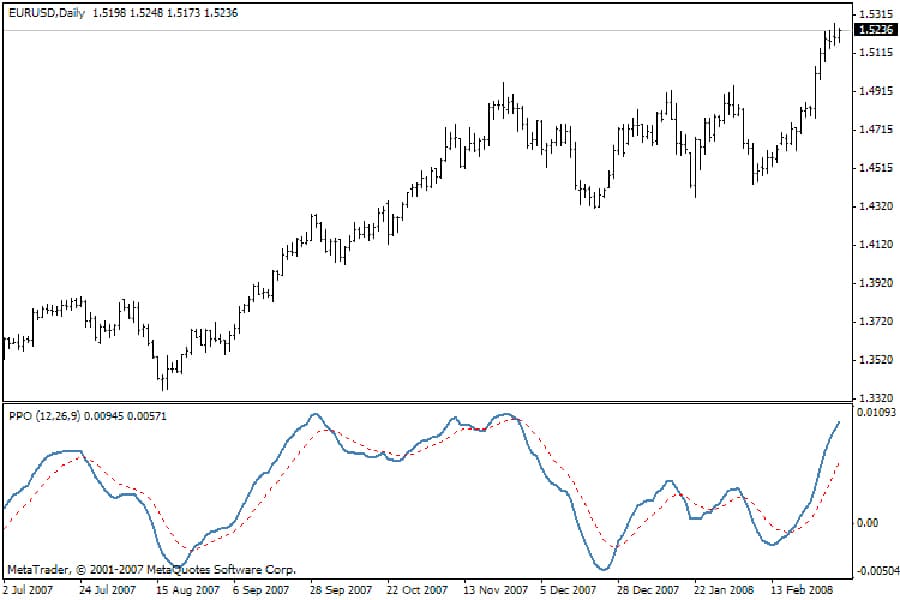
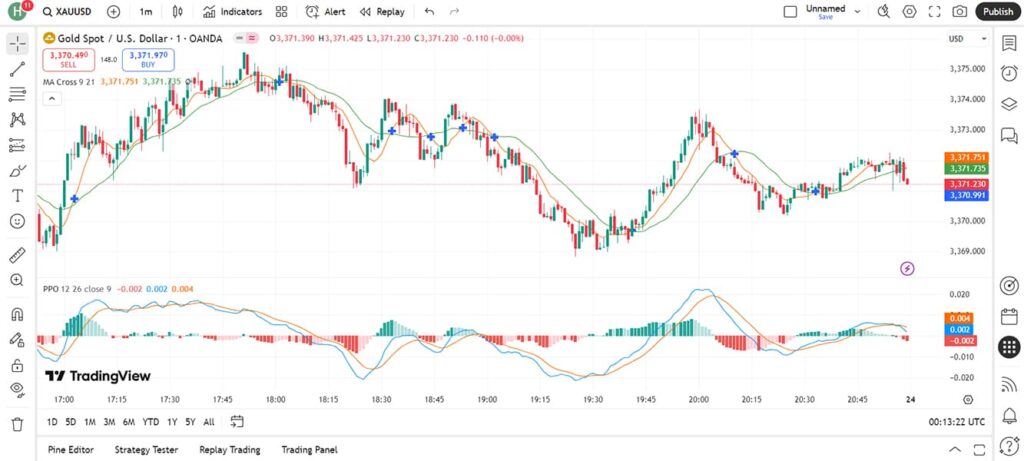
If you can’t find the PPO indicator in your MetaTrader platform, you can use the built-in MACD indicator with adjusted settings, since PPO is essentially the MACD expressed in percentage terms.

Common Mistakes When Using the PPO Indicator

In most cases, trading losses or inaccurate analyses come not from the indicator itself but from how traders use it. Some of the most common mistakes include:

  • Ignoring a personal trading strategy and relying on PPO as a stand-alone decision-making tool.
  • Failing to test settings on a demo account before applying them in live trades.
  • Interpreting PPO signals the same way across all markets and timeframes, even though its behavior varies with market conditions.
  • Neglecting risk management and depending solely on PPO signals for entry or exit decisions.
  • Not reviewing or updating the indicator’s settings due to market volatility and structure change.

Unlike the indicator’s inherent limitations, these errors are fully preventable through proper education, practice, and consistent review.

Conclusion

The PPO indicator is a powerful tool for analyzing momentum and trend strength, as it expresses the difference between moving averages in percentage terms, allowing for cross-asset comparison. However, its real value appears when used alongside other tools such as RSI, moving averages, or Bollinger Bands, which help validate signals and reduce trading risk.

Traders who rely only on crossovers or the histogram are more prone to false signals and poor decisions. The best approach is to treat PPO as a complementary indicator, used together with trend analysis, risk management, and fundamental insights, to ensure more realistic decisions and consistent trading results.

Continue Reading
not-found
calendar 18 November 2025
Rate this article

Leave a Reply

Your email address will not be published. Required fields are marked *

No thanks