If your entire focus is only on net profit, you’re likely overlooking the hidden side of your trading system’s performance. Profit Factor (PF) is a metric that, with a single number, tells you how much profit you’ve earned for every unit of loss. However, the real value of this metric becomes clear only when analyzed alongside other measures such as drawdown, win rate, and the risk-to-reward ratio.
In this article, you’ll learn how to extract the profit factor from a MetaTrader statement, interpret it correctly, and use this powerful tool to select or optimize the best trading strategy.
- Evaluate profit factor over at least 50 to 100 trades; a high PF based on a small sample size can be misleading.
- Very large profit factors (e.g., above 4) are often the result of limited data, exceptional market conditions, or overfitting in backtests.
- When analyzing a statement, always assess profit factor alongside drawdown to ensure profitability is accompanied by reasonable risk.
What Is the Profit Factor and Why Does It Matter?
Profit Factor (PF) is one of the most important metrics used to evaluate the performance of a trading system or account statement. Put simply, it shows the ratio of profits earned to losses incurred.
Profit factor matters because:
- It serves as a key measure of a strategy’s overall health.
- It indicates whether the risk-to-reward profile of the trades is reasonable.
- It helps you compare multiple trading systems and choose the best strategy to move forward with.
How to Calculate Profit Factor in a Trading Statement
Profit Factor is calculated directly from trading data and tells us the ratio of total profits to total losses.
The formula for Profit Factor (PF) is:
Profit Factor=Gross Profit/Gross Loss
To obtain this number, simply download your trade report or statement from MetaTrader or any portfolio management software. These reports usually include columns such as Gross Profit and Gross Loss. By dividing these two values, you get the profit factor.
Practical Example
Suppose in the past month you had 30 trades:
- Total profits = $8,000
- Total losses = $4,000
In this case, the Profit Factor would be:
PF=8000/4000=2
Which means during this period, for every $1 of loss, you generated $2 of profit. The result shows that your strategy performed consistently and profitably over that timeframe.
Where to Find Profit Factor in a MetaTrader Statement
One of the biggest advantages of MetaTrader is that after completing your trades—or over any selected period—you can generate a detailed report of your trading performance. This report, known as the trading statement, includes information such as the number of trades, win rate, total profit and loss, average win and loss, drawdown, and of course, the profit factor.
How to Download a Trading Statement
- Log in to your trading account.
- From the View menu, click on Toolbox to open the Toolbox window at the bottom of the chart.

- Next, go to the History tab, right-click, and under Report, select either Open XML or HTML.
- By choosing Open XML, you’ll receive a more detailed version of the trading statement.

- By selecting Open XML, a window will appear prompting you to choose the location on your computer where you want to save the statement file.

- After saving and opening the statement file, you can view the profit factor along with the gross profit and gross loss at the bottom of the file.

How to Interpret and Analyze Profit Factor in a Trading Statement
Profit Factor is one of the key metrics for evaluating the quality of a trading strategy’s performance. It shows how much profit is generated for every unit of loss.
For example, imagine your trading statement displays the following:
- Gross Profit: $4,000
- Gross Loss: $6,000
The Profit Factor would then be:
PF=4000/6000=0.66
This means that for every $1 of loss, your system generated only $0.66 in profit. Such a strategy is considered unprofitable, and if this pattern continues, your capital will gradually decrease.
What Is a Good Profit Factor?
In general:
- PF below 1: Losing strategy, unreliable;
- PF between 1 and 1.5: Profitable but weak or high-risk strategy;
- PF between 1.5 and 2: Acceptable and sustainable strategy for long-term trading;
- PF above 2: Very strong and highly profitable.
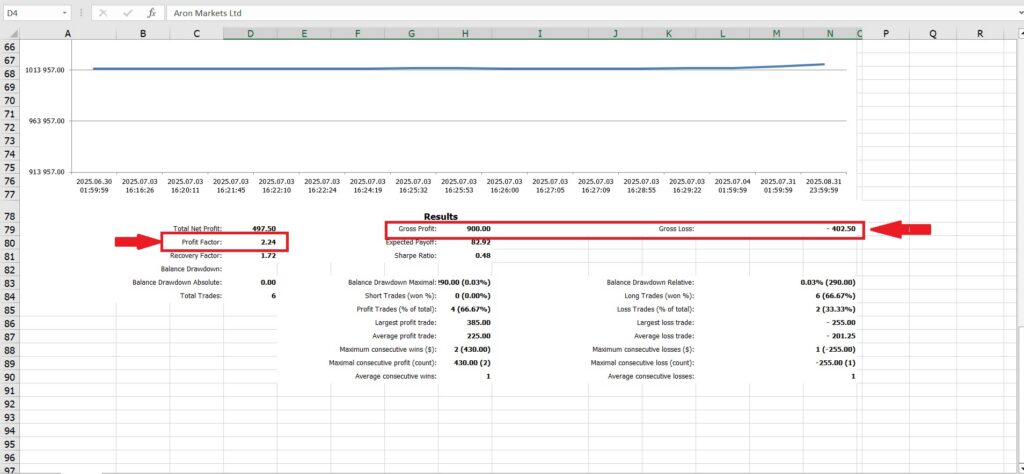
According to Quantified Strategies, the number of trades plays a crucial role when analyzing profit factor. For example, a Profit Factor of 2 across 100 trades is far more reliable than a Profit Factor of 4 based on just 10 trades.
Analyzing High and Low Profit Factors and Their Implications in Trading
- Low Profit Factor (below 1):
Indicates an unprofitable system. Continuing with such a strategy will inevitably reduce capital, meaning it should either be stopped or fundamentally revised. - Moderate Profit Factor (1 to 1.5):
Usually reflects a volatile system. The win rate may be high, but the risk-to-reward ratio is weak. In this case, a single large loss can wipe out many smaller gains. - Acceptable Profit Factor (1.5 to 2):
Shows a healthy balance between risk and return. This range is considered ideal for many sustainable strategies. - High Profit Factor (above 2):
A PF between 2 and 3 is excellent, signaling profitability and consistency. However, values above 3—and especially over 4—should be interpreted with caution.
Profit factors above 4 are often less desirable because:- They are typically based on a small number of trades and lack stability.
- They may result from exceptional market conditions that are unlikely to repeat.
- They can be a sign of hidden risk or overfitting in backtests.
- They are typically based on a small number of trades and lack stability.
The optimal and realistic range for profit factor is usually between 1.5 and 3, where both solid profitability and stability are present.
Limitations and Common Mistakes in Interpreting Profit Factor in a Statement
The most important limitations and common mistakes in analyzing profit factor include:
- Ignoring the number of trades:
A high profit factor based on just 5 trades is unreliable, while the same figure across 200 trades is far more meaningful. - Over-focusing on a single metric:
Some traders look only at PF while ignoring other indicators such as drawdown or win rate. This can create a misleading picture of the strategy’s true performance.
Read more: Drawdown Calculator
- Market-specific conditions:
A high profit factor may have been achieved during a particular phase (e.g., a strong trending market) but might not hold up in a ranging or highly volatile environment. - Hidden risk in trades:
Strategies with small gains and large losses may appear to have a good profit factor, but one or two bad trades can wipe out the entire system.
Table of Limitations and Common Mistakes in Interpreting Profit Factor
Common Mistake | Consequences | Suggested Solution |
---|---|---|
Ignoring the number of trades | A high profit factor over a few trades may just be luck and lacks real credibility. | Always evaluate PF over a larger sample size (e.g., at least 50 trades). |
Over-focusing on a single metric | Provides an incomplete picture of strategy performance; high drawdown or low win rate may be overlooked. | Analyze PF together with other metrics such as drawdown and win rate. |
Dependence on specific market conditions | A strategy may perform well in one type of market (e.g., trending) but lose money in others. | Backtest the strategy across different timeframes and market conditions. |
Hidden risk in trades | A system with small gains and large losses may show a good PF, but one or two bad trades can wipe out the account. | In addition to PF, review profit/loss distribution, risk management, and max loss per trade. |
How to Use Profit Factor to Choose the Best Trading System
When it comes to selecting the best trading strategy, many traders focus only on net profit. However, professionals know that a solid strategy must be repeatable, consistent, and reliable. One of the best tools for evaluating these qualities is the Profit Factor (PF).
Profit factor helps in choosing the best trading system by:
- Comparing multiple trading systems:
If you have two different strategies, simply extract their statements and check the profit factor of each. The system with the higher PF has delivered better returns under the same conditions. - Assessing consistency and risk:
A profit factor within the ideal range of 1.5 to 3 indicates that the strategy is profitable over the long run and more stable compared to systems with extremely high or very low PF values.
Identifying weaknesses in the system:
A low profit factor is a red flag, suggesting that the trading system is either poorly designed or has risk management issues. In such cases, you need to analyze the system layer by layer to identify the root cause of its weakness.
To evaluate the risk and money management of a strategy, review position sizing, stop-loss levels, and the risk-to-reward ratio.
To assess the core structure of the strategy, examine the quality of entry and exit signals, market conditions, and potential overfitting.
Practical Example
Suppose you have two different strategies with the following one-month results:
Strategy A
- Gross Profit: $10,000
- Gross Loss: $7,000
- Profit Factor = 10,000 ÷ 7,000 = 1.43
Strategy B
- Gross Profit: $15,000
- Gross Loss: $6,000
- Profit Factor = 15,000 ÷ 6,000 = 2.5
As a result, Strategy B demonstrates better returns and stronger risk management compared to Strategy A. In this case, choosing Strategy B is more logical—especially if the number of trades is sufficient and the drawdown is under control.
A low profit factor acts like an alarm. If the root cause lies in risk management, it can be fixed by adjusting position sizing, refining stop-loss levels, and improving the risk-to-reward ratio. However, if the weakness is in the strategy itself, the trading system must be redesigned or replaced.
Reward-to-Risk Ratio and Its Relationship with Profit Factor
The risk-to-reward ratio shows how much profit you earn on average in each trade relative to the amount of risk you take. In other words, it measures the quality of each individual trade. By contrast, the profit factor looks at all trades collectively, reflecting the overall quality of the trading system in the long run.
In general:
- Even if the win rate is high, if the losses are larger than the gains, the profit factor will drop.
- Sometimes, even with a low win rate, if the reward-to-risk ratio is high enough, the profit factor can still remain positive and acceptable.
The Impact of Win Rate on Profit Factor
Profit factor represents the ratio of total profits to total losses, while win rate only shows the percentage of winning trades. Combining these two metrics provides a much clearer picture of a strategy’s quality.
To see how win rate and reward-to-risk interact and influence the profit factor, let’s look at the following example comparing two strategies, A and B:
Practical Example
Suppose in Strategy A, after 10 trades, the following conditions apply:
- Average loss: 50 pips;
- Average profit: 25 pips;
- Risk-to-reward ratio: 0.5 (risk is twice the reward);
- Win rate: 80% (8 winning trades out of 10, 2 losing trades);
- Total profit = 8 × 25 = 200 pips;
- Total loss = 2 × 50 = 100 pips.
Profit Factor = 200 ÷ 100 = 2
So, although the risk-to-reward ratio is low (0.5), thanks to the high win rate (80%), the system achieves a solid profit factor.
Now, suppose in Strategy B, after 10 trades, the following conditions apply:
- Average loss: 20 pips;
- Average profit: 60 pips;
- Risk-to-reward ratio: 3 (reward is three times the risk);
- Win rate: 30% (3 winning trades out of 10, 7 losing trades);
- Total profit = 3 × 60 = 180 pips;
- Total loss = 7 × 20 = 140 pips.
Profit Factor = 180 ÷ 140 = 1.28
As a result, although this strategy has a much higher risk-to-reward ratio, its low win rate makes the profit factor significantly weaker.
An ideal strategy is usually a combination of a reasonable win rate (not necessarily very high) and a sound risk-to-reward ratio, which ultimately results in a profit factor between 1.5 and 3.
Average Profit and Loss per Trade and Its Role in Interpreting Profit Factor
Profit Factor only shows the ratio of total profits to total losses, but to understand how that profitability is achieved, you also need to look at the average wins and losses.
Average profit and loss matter because:
- If your average loss is much larger than your average win, even with a high win rate you may still end up with a weak profit factor.
- If you have a high profit factor but your average loss is significantly greater than your average win, just one or two bad trades could wipe out the entire system.
Practical Example
Strategy A:
- Number of trades: 20
- Average profit per trade: $40
- Average loss per trade: $30
- Win rate: 60% (12 wins, 8 losses)
- Total profit = 12 × 40 = $480
- Total loss = 8 × 30 = $240
Profit Factor = 480 ÷ 240 = 2
Here, the average win is larger than the average loss, and with a decent win rate, the system performs stably and profitably.
Strategy B:
- Number of trades: 20
- Average profit per trade: $15
- Average loss per trade: $50
- Win rate: 80% (16 wins, 4 losses)
- Total profit = 16 × 15 = $240
- Total loss = 4 × 50 = $200
Profit Factor = 240 ÷ 200 = 1.2
In Strategy B, despite the high win rate, the much larger average loss compared to the average win drags down the profit factor, making the strategy weak.
The best case for any strategy is a balance where the average profit is greater than the average loss, combined with a reasonable win rate—ultimately leading to a stable profit factor.
The Difference Between Profit Factor and Drawdown
Drawdown represents the maximum decline in equity over a given period and reflects the level of risk and psychological pressure associated with a strategy. In general, a system may show a high profit factor but still be impractical if it suffers from deep drawdowns.
For example:
- A strategy with a 10% drawdown and a profit factor of 2.2 is considered profitable and low-risk.
- In contrast, a strategy with a 50% drawdown and a profit factor of 2.5, while profitable on paper, carries extremely high risk and is often impractical for most traders.
The Difference Between Profit Factor and Sharpe Ratio
Both Profit Factor (PF) and the Sharpe Ratio are used to evaluate trading strategies, but they measure different aspects:
- Profit Factor shows how many dollars of profit are earned for every dollar of loss.
- Sharpe Ratio measures how valuable the returns are relative to volatility and risk. (A ratio above 1 is considered good, while above 2 is excellent.)
For example:
- A strategy with a Sharpe Ratio of 1.8 and a Profit Factor of 2 is both profitable and stable.
- In contrast, a strategy with a Sharpe Ratio of 0.7 and a Profit Factor of 2.5 may be profitable but carries high risk.
Profit Factor is a simple measure of profitability, but it does not reflect risk. The Sharpe Ratio, on the other hand, evaluates returns relative to actual risk. The best systems combine a Profit Factor above 1.5 with a Sharpe Ratio above 1.
The Difference Between Profit Factor and Sortino Ratio
While both Profit Factor (PF) and the Sortino Ratio are tools for analyzing strategies, they focus on different aspects of system performance.
- Profit Factor measures the ratio of total profits to total losses.
- The Sortino Ratio focuses on the quality of returns relative to downside risk only. A value above 1 indicates a good strategy, while above 2 is considered excellent.
For example:
- A strategy with a Sortino Ratio of 1.8 and a Profit Factor of 2 is both profitable and stable.
In contrast, a strategy with a Sortino Ratio of 0.9 and a Profit Factor of 2.2 may be profitable but comes with significant drawdowns.
Profit Factor shows overall profitability but does not measure its quality. The Sortino Ratio tells us whether that profitability has been achieved with reasonable and acceptable risk. The best systems combine a PF above 1.5 with a Sortino Ratio above 1.
Conclusion
Profit Factor is a quick and powerful metric for assessing the overall quality of a strategy, but it is not sufficient on its own. The best trading decisions are made when PF is viewed in the right context: a sufficient number of trades, controlled drawdown, and a proper balance between win rate and risk-to-reward ratio. In practice, a PF range of 1.5 to 3 usually provides the optimal balance between profitability and stability. Whenever your PF is low, start by adjusting risk management; if the problem persists, then redesign the structure of your strategy.