


The PVO Indicator, or the Percentage Volume Oscillator, is a tool in technical analysis used to evaluate trading volume. This indicator helps analysts understand volume changes in financial markets and use them to confirm trends or detect trade signals.
In this article, we will explain what the PVO Indicator is, how it works, and how you can use it in your trading.

- The PVO Indicator shows whether trading volume is higher or lower than its normal baseline.
- Changes in the PVO Indicator can help you identify potential buy or sell signals in real time.
- This indicator helps you judge whether a price breakout is supported by strong participation or likely false.
- You can customize PVO Settings TradingView based on your strategy and preferred timeframe for better alignment.
- For higher accuracy, combine PVO vs MACD or use it alongside other Volume Analysis Indicators like OBV.
PVO Indicator: What Is It?
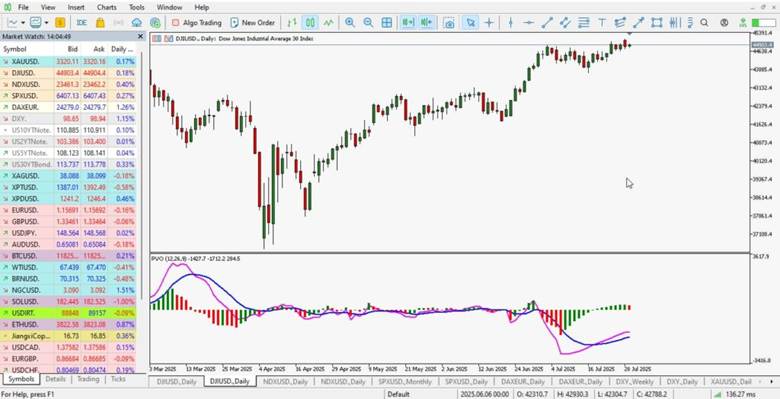
The PVO Indicator, short for Percentage Volume Oscillator, is a volume-based oscillator that shows the percentage difference between two volume EMAs. It is similar in structure to MACD, but it focuses on volume rather than price, which supports clearer volume-based confirmation.
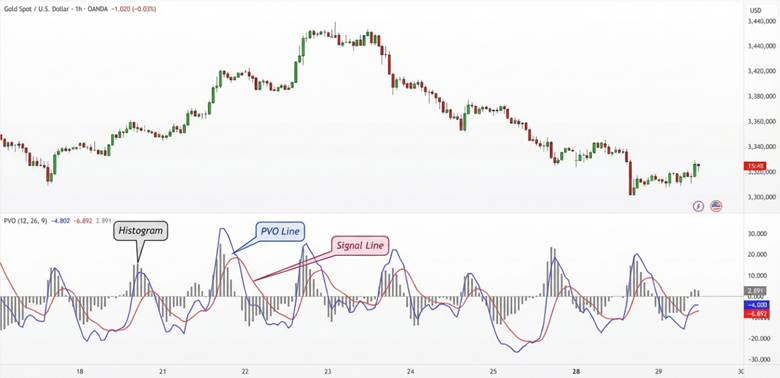
The PVO Indicator includes three main parts:
- PVO line: The difference between a short-term volume EMA (for example, 12) and a long-term volume EMA (for example, 26).
- Signal line: A 9-period EMA calculated from the PVO line, used to smooth volume momentum and reduce noise.
- PVO Histogram: The difference between the PVO line and the signal line, which highlights acceleration in volume changes.
When the PVO line is positive, it indicates rising volume and stronger participation in the market’s current move. When the PVO line is negative, it signals falling volume and weaker participation, which can affect breakout strength and trend confidence.
How to Calculate the PVO Indicator
The PVO Indicator is calculated using exponential moving averages (EMA) of trading volume, and its formula is shown below.
PVO = ((12-period volume EMA − 26-period volume EMA) ÷ 26-period volume EMA) × 100
- Signal line = 9-period EMA of the PVO
- PVO Histogram = PVO line − Signal line
PVO shows the percentage change in average volume over 12 periods compared with the average volume over 26 periods. If PVO is positive, short-term volume is higher than long-term volume, and if it is negative, volume is lower.
Example
Assume the volume EMAs are as follows.
- 12-period volume EMA = 120,000 units
- 26-period volume EMA = 100,000 units
Step 1: Calculate PVO
PVO = ((120,000 − 100,000) / 100,000) × 100
PVO = (20,000 / 100,000) × 100 = 20%
This means the 12-period average volume is 20% higher than the 26-period average volume.
Step 2: Calculate the Signal Line
Assume the PVO value over the last 9 periods averages 15% for the signal line calculation.
That 15% value is used as the signal line.
Step 3: Calculate the Histogram
PVO Histogram = PVO line − Signal line
Histogram = 20% − 15% = 5%
A positive histogram (5%) shows PVO is above the signal line and trading volume is increasing.
How the PVO Indicator Works in Technical Analysis
In this section, we use real examples and analysis charts to review three important uses of the PVO Indicator.
Using the PVO Indicator to Identify Volume Trends
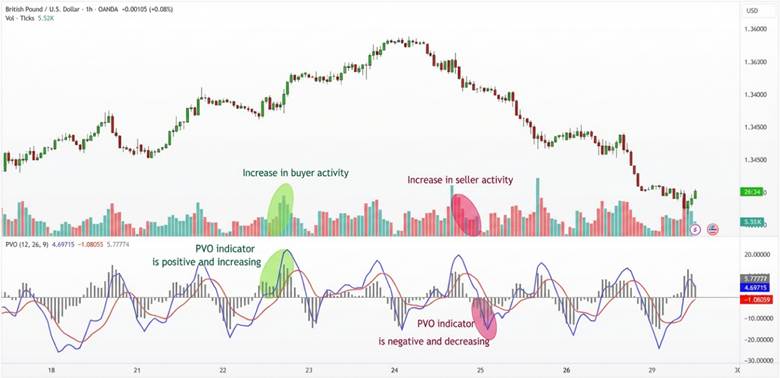
The PVO Indicator helps you see whether trading volume is rising or falling compared with its recent baseline. If PVO is positive, volume is above average, and if it is negative, volume is below average.
- When PVO is positive and rising, it signals increasing activity from buyers or sellers in the current move.
- When PVO is negative and falling, it suggests the market is quieter and overall trading volume is shrinking.
How to Identify Buy and Sell Signals With the PVO Indicator
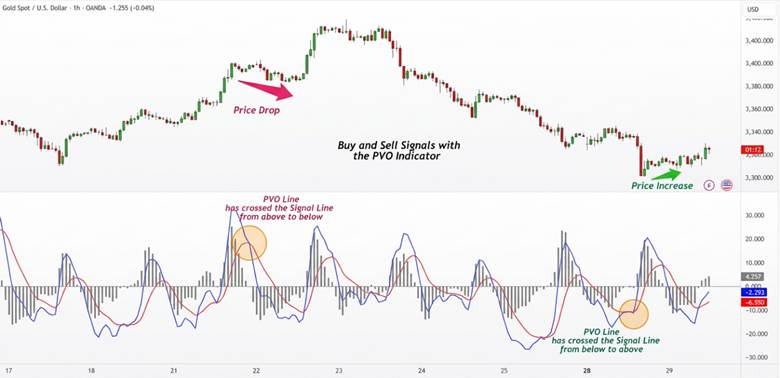
The PVO Indicator can confirm buy and sell signals using line crossovers and shifts into positive or negative territory. The PVO Histogram can make crossovers easier to spot, because it measures the gap between the two lines.
- Buy signal: When the PVO line crosses above the signal line and moves into positive territory, volume may support upside.
- Sell signal: When the PVO line crosses below the signal line and turns negative, volume may support downside.

If you trade PVO vs MACD together, use MACD for price momentum and PVO for participation confirmation.
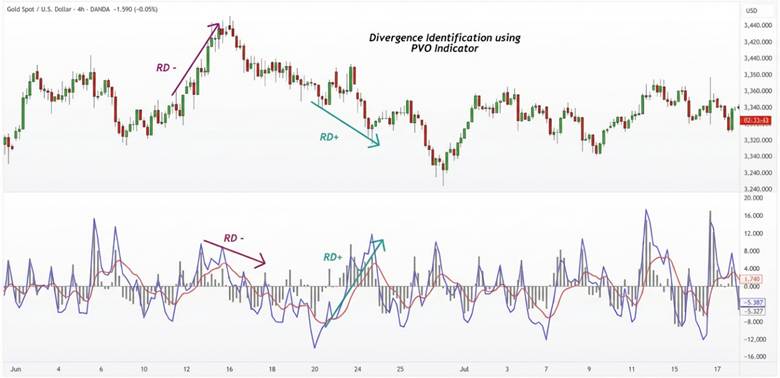
Volume Divergence: Detecting Divergence Between Price and Volume With the PVO Indicator
Volume Divergence happens when price movement and volume behavior do not align, and PVO can help highlight these situations clearly.
- Bullish divergence: Price falls, but PVO rises toward positive territory, suggesting new buyers may enter and reverse the downtrend.
- Bearish divergence: Price rises, but PVO shifts toward negative territory, showing fading volume and a weaker uptrend.
These rules can form a simple Volume Oscillator Strategy when you combine them with price structure and solid risk management.
PVO vs MACD
The PVO Indicator and MACD share a similar structure because both use differences between EMA values. The main difference is the data each one analyzes in technical analysis. The PVO Indicator focuses on trading volume, while MACD focuses on closing price momentum.
The table below summarizes the key differences between PVO vs MACD.
| Feature | PVO (Percentage Volume Oscillator) | MACD (Moving Average Convergence Divergence) |
|---|---|---|
| Analysis focus | Trading volume | Closing price |
| Input data type | Daily volume | Close price |
| Signal type | Volume swings and capital inflow or outflow acceleration | Price momentum, convergence, and divergence |
| Best for | Confirming support or resistance breaks with strong volume | Spotting divergence and trend starts or endings |
| Primary use | Measuring hidden strength behind price moves | Measuring trend direction changes and trend strength |
| Divergence signals | Often less reliable and more volatile | Often more accurate for bullish and bearish divergence |
| Market sensitivity | Weaker in low-volume markets | Reliable across many markets |
| Histogram structure | Difference between PVO and its volume signal line | Difference between MACD and its price signal line |
The PVO Indicator is rarely used alone to predict price direction, because it confirms volume behind price moves. MACD can work alone as a signal tool, but it often improves when combined with volume confirmation.
PVO Indicator Settings TradingView and PVO Indicator MT4
The PVO Indicator is not built into some platforms by default, so you may need to add it manually. Fortunately, you can use the PVO Indicator on both MetaTrader and TradingView with simple setup steps.
In low-liquidity markets, PVO often generates false signals. Therefore, combining it with indicators like ATR or CMF is recommended.
Below, you will learn how to install and adjust the PVO Indicator MT4 and configure PVO Settings TradingView.
How to Add and Set Up the PVO Indicator MT4
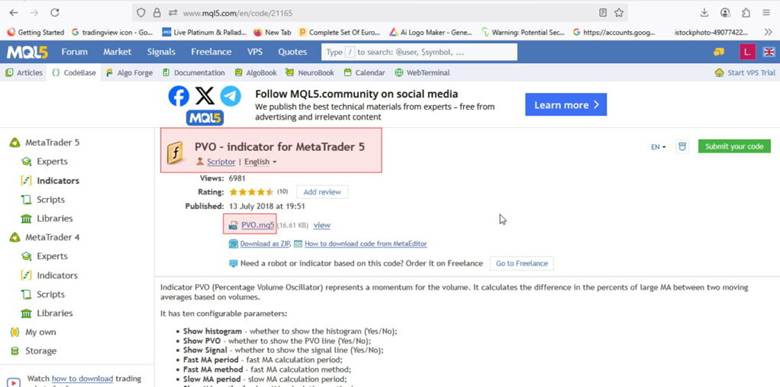
The PVO Indicator MT4 is usually not included in MetaTrader by default, so you must install it manually.
You can download a PVO file from a trusted source, typically in .mq5 or .ex5 format.
Steps to add the PVO Indicator MT4
- Download the indicator file: Get the PVO file from a trusted and reputable source.
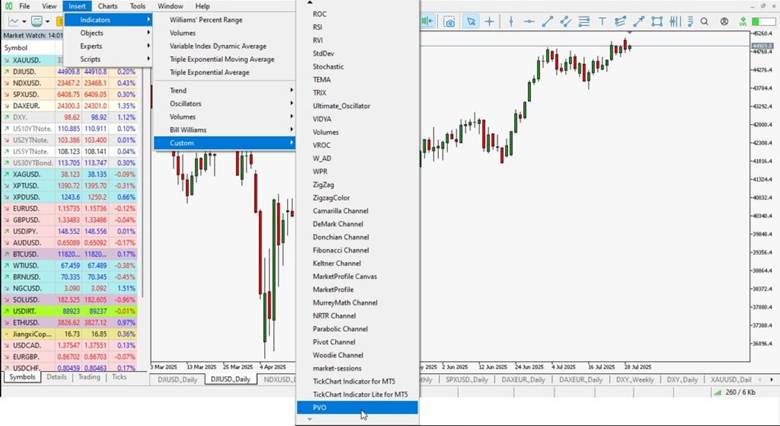
- Open the indicators folder: In MetaTrader, go to the following path from the top menu.
- File > Open Data Folder > MQL5 > Indicators
- Copy the indicator file: Place the downloaded file inside the Indicators folder.
- Restart MetaTrader: Close and reopen the platform so the indicator appears in the list.
- Add PVO to the chart: In the Navigator window, double-click PVO or drag it onto the chart.
- Set the periods: Enter the fast, slow, and signal periods, usually 12, 26, and 9.
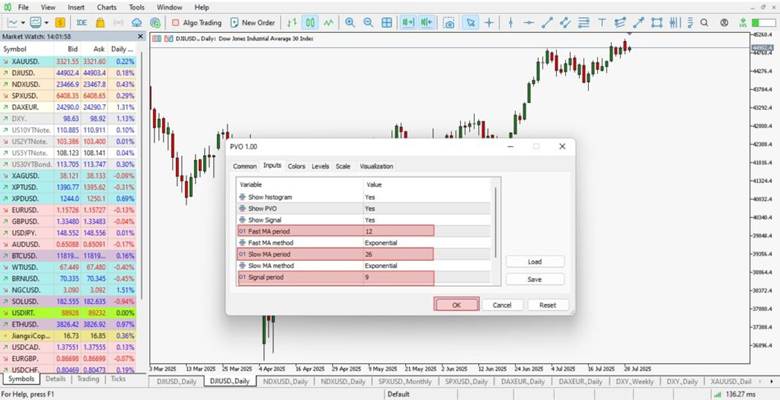
- Use it on the chart: The PVO Indicator is now ready for volume confirmation analysis.
How to Add and Configure PVO Settings TradingView
On TradingView, the PVO Indicator is easy to access and does not need manual installation.
You can add it directly from the built-in indicators library in seconds.
Steps to enable PVO Settings TradingView
- Log into your account: Open TradingView and load the chart of your selected symbol.
- Add an indicator: Click the Indicators button at the top of the chart window.
- Search PVO: Type “PVO” or “Percentage Volume Oscillator” in the search bar.
- Select the indicator: Click the result to add it to your chart instantly.
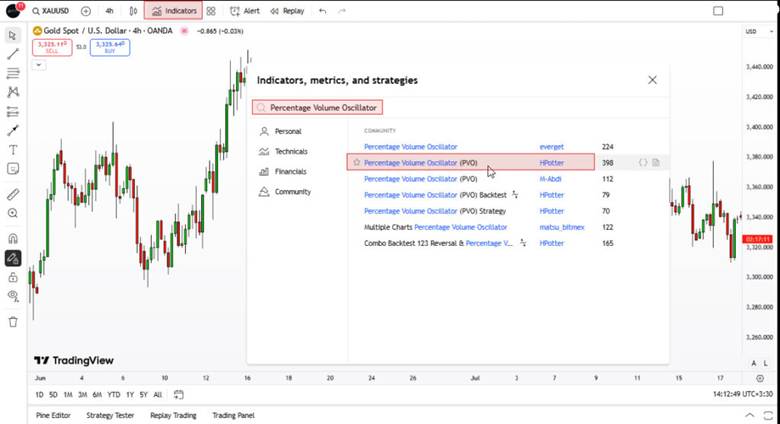
- Customize settings: Use the gear icon to change periods, such as 12, 26, and 9.
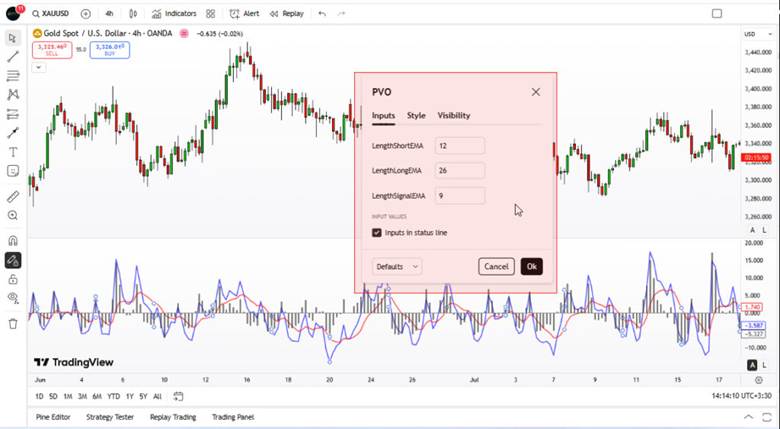
- Adjust appearance: You can also change colors and visual display options inside settings.
Best Timeframes for Using the PVO Indicator
You can use the PVO Indicator across many timeframes, from a few minutes to several weeks, but the best choice depends on your strategy. Below, we review the best timeframes for different trading styles.
For short-term analysis or scalping (day trading and scalping)
Timeframes like 15 minutes, 30 minutes, and 1 hour are ideal options for short-term volume analysis. In these ranges, volume changes appear faster, and PVO can make quick trade entries and exits easier.
However, the indicator may show more noise, so it should be used with filters like RSI or candlestick patterns.
For medium-term analysis (trades lasting several days or weeks)
Using the 4-hour or daily timeframe helps traders get more stable and lower-error PVO signals. In this range, the indicator follows volume trends better and can confirm price breakouts more reliably.
For long-term analysis or investing (Position Trading)
On weekly or monthly timeframes, it is better to adjust the default PVO settings of (12, 26, 9).
For example, settings like (5, 100, 9) or (10, 250, 9) can better reflect yearly volume averages.
This approach, known as position trading, fits investors who seek entry and exit points over several months.
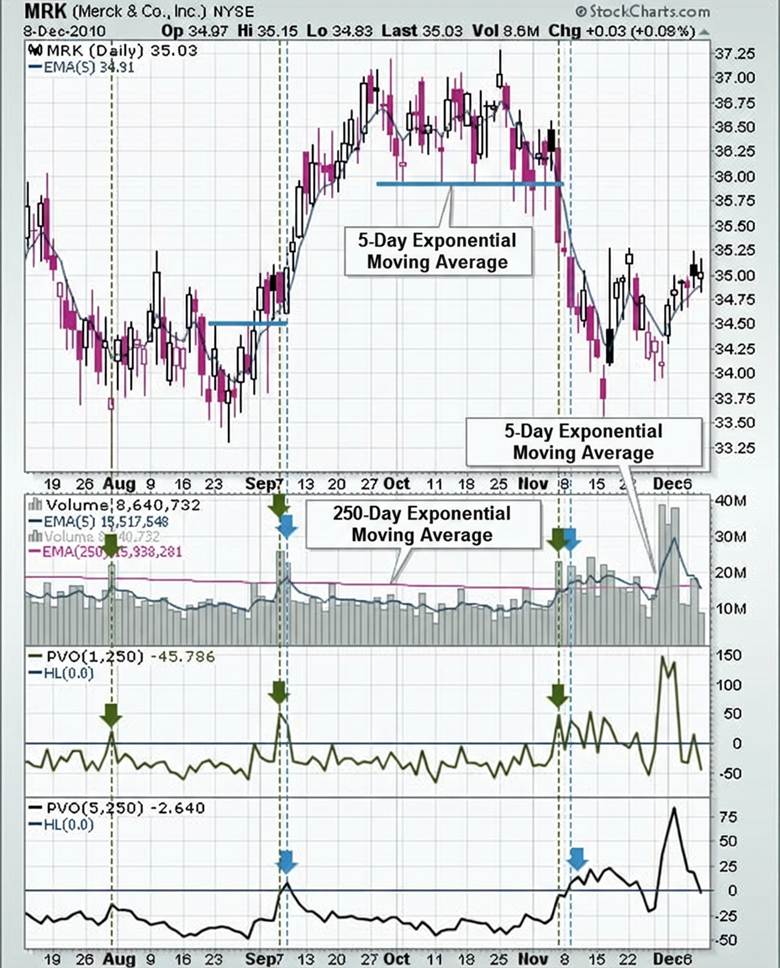
In this image of the MRK stock, a comparison is shown between PVO with (1, 250) and (5, 250) periods. As you can see, PVO(1, 250) reacts earlier than PVO(5, 250). This chart clearly shows the importance of adjusting the timeframe and indicator periods based on your analysis goal.
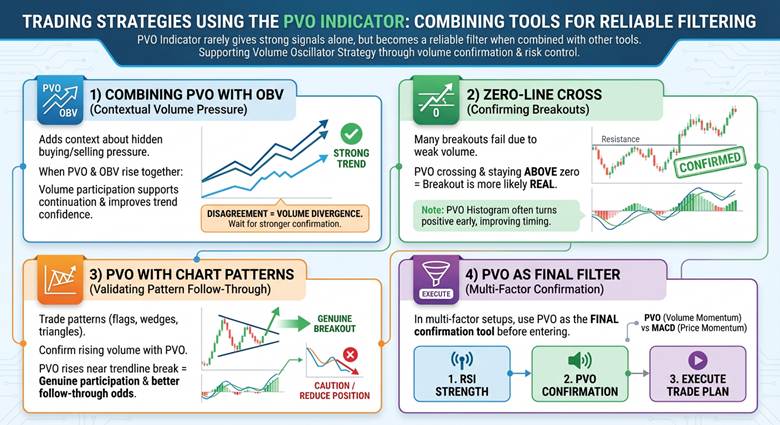
Trading Strategies Using the PVO Indicator
The PVO Indicator rarely gives strong signals alone, but it becomes a reliable filter when combined with other tools. These strategies support a practical Volume Oscillator Strategy built around volume confirmation and risk control.
1) Combining the PVO Indicator With OBV
Using OBV with the PVO Indicator adds context about hidden buying and selling pressure behind price moves. When both indicators rise together, volume participation supports continuation and improves trend confidence.
When they disagree, treat it as Volume Divergence and wait for stronger confirmation before entering.
2) Confirming Breakouts With a Zero-Line Cross
Many breakouts fail because volume participation is weak, even if price briefly clears resistance. If the PVO Indicator crosses above zero and stays positive, the breakout is more likely real.
The PVO Histogram often turns positive early, which can improve timing around the breakout candle.
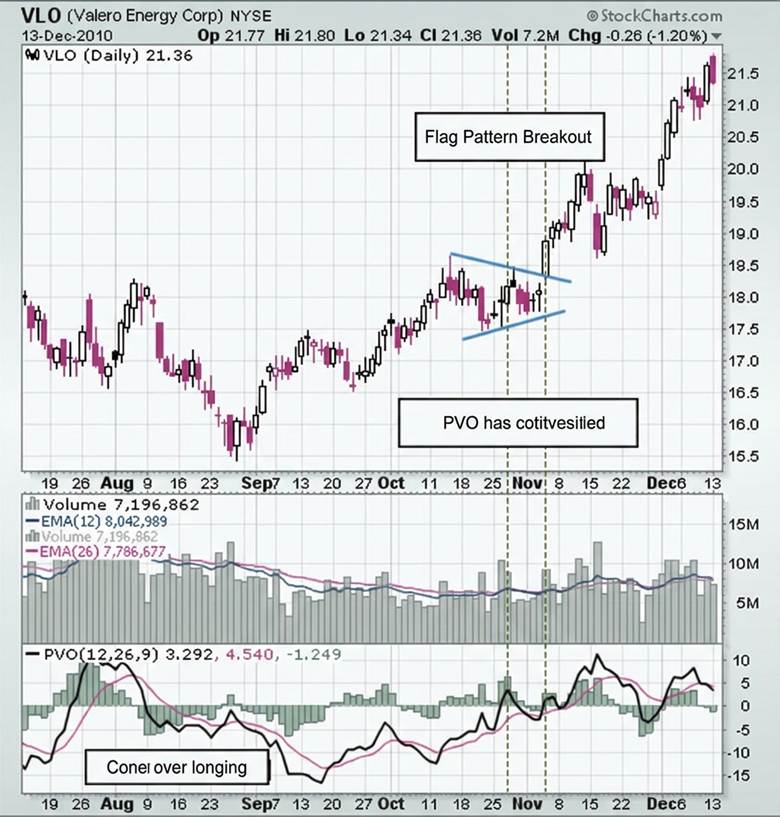
In this image, the VLO stock chart first forms a small triangle pattern called a pennant. After this pattern, trading volume increases and the PVO Indicator moves into positive territory. At the same time, price breaks above resistance and starts a strong upward move. This chart clearly shows how the PVO Indicator can confirm a price breakout.
3) Using the PVO Indicator With Chart Patterns
When you trade patterns like flags, wedges, or triangles, confirm rising volume using the PVO Indicator. If PVO rises near the trendline break, participation looks genuine and the pattern has better follow-through odds.
If PVO falls during the breakout, treat the move cautiously and reduce position size.
4) Using PVO as the Final Filter With Other Indicators
In multi-factor setups, use the PVO Indicator as the final confirmation tool before you enter.
For example, confirm RSI strength, then confirm volume using PVO, then execute the trade plan.
This approach works well alongside PVO vs MACD, because MACD tracks price momentum while PVO tracks volume momentum.
Sharp PVO moves during major economic news often reveal irrational market reactions, which can help contrarian traders.
Pros and Cons of the PVO Indicator
Like any analysis tool, this indicator has strengths and limitations, and knowing them is essential for effective use.
Pros of the PVO Indicator
The main advantages of the PVO Indicator include the following points.
- Accurate analysis of price-move strength through volume: The PVO Indicator helps you judge whether a price move is supported by strong volume participation.
This matters because real moves often come with higher volume, which improves trend confirmation. - Simple interface for beginners and advanced traders: PVO signals are easy to understand, because it uses a main line, a signal line, and a PVO Histogram.
With practice, both new and experienced traders can apply it confidently in daily analysis. - Customizable for different strategies and timeframes: You can adjust PVO periods to fit your trading style and market behavior across multiple timeframes.
For long-term trading, you can use settings like 50 and 200, while 12 and 26 fit faster setups.
Cons of the PVO Indicator
The main disadvantages of the PVO Indicator include the following points.
- Lag in signal generation: Because PVO is built on moving averages, its signals naturally lag behind real-time market changes. In fast moves, this delay can cause late entries or late exits for some traders.
- Higher error risk in low-volume or quiet markets: In low-volume markets, small volume changes can create noisy spikes and false PVO signals. This is why volume tools can perform weaker when liquidity and participation are inconsistent.
- Needs confirmation from other tools: The PVO Indicator is not enough alone, so you should confirm it with other indicators. Many traders compare PVO vs MACD or combine it with RSI and OBV to avoid false signals.
| Pros | Cons |
|---|---|
| Confirms whether price moves are backed by strong volume. | EMA-based signals can lag in fast markets. |
| Simple lines and histogram, easy to read. | Noisy and less reliable in low-liquidity markets. |
| Adjustable settings for different timeframes. | Works best with other indicators, not alone. |
Conclusion
The PVO Indicator is a simple and practical tool for analyzing trading volume in financial markets. It helps you identify volume trends, confirm buy and sell signals, and detect Volume Divergence. With proper settings and support from tools like PVO vs MACD or OBV, PVO can improve your trading decisions. For best results, use the PVO Indicator alongside other analysis methods and choose a timeframe that fits your strategy.


