


The Rally Base Drop (RBD) pattern is one of the most powerful reversal patterns in technical analysis, helping traders identify market trend changes and profit from them. This pattern, which forms within supply and demand strategies, creates a key area known as the Supply Zone, offering selling trade opportunities. Stop hunting, where large market entities exploit the liquidity of retail traders, plays an important role in the success of this pattern. In this article, we will guide you through how to identify, trade, and combine the Rally Base Drop pattern with other technical tools so you can capture strong market reversals.

- The Rally Base Drop (RBD) pattern is especially effective in identifying supply zones, which typically form after a strong upward move, followed by price consolidation and then a sharp decline.
- In the Base phase, a decrease in trading volume and in the Drop phase, an increase in volume can indicate the strength of the supply zone.
- Combining the Rally Base Drop (RBD) pattern with tools like Fibonacci, support and resistance, and price action can enhance the accuracy of the analysis.
- The Rally Base Drop pattern offers strong reversal opportunities in markets like Forex and crypto due to rapid price movements.
What is the Rally Base Drop (RBD) Pattern?
The Rally Base Drop (RBD) pattern is a simple and practical method in financial market analysis, such as Forex or cryptocurrencies, that helps you understand when the price shifts direction from an uptrend to a downtrend. Imagine the price like a car: it speeds up at first, then pauses for a bit, and finally drops quickly. This pattern shows you where to enter a trade to sell.
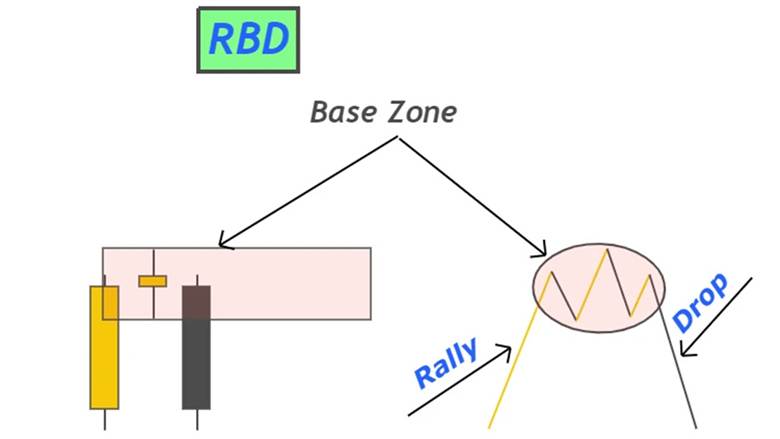
The Rally Base Drop consists of three parts:
- Rally: The price rises quickly, like when everyone wants to buy a stock or currency.
- Base: The price consolidates for a while, moving slightly up and down, like a brief rest.
- Drop: The price suddenly falls as strong sellers enter the market.
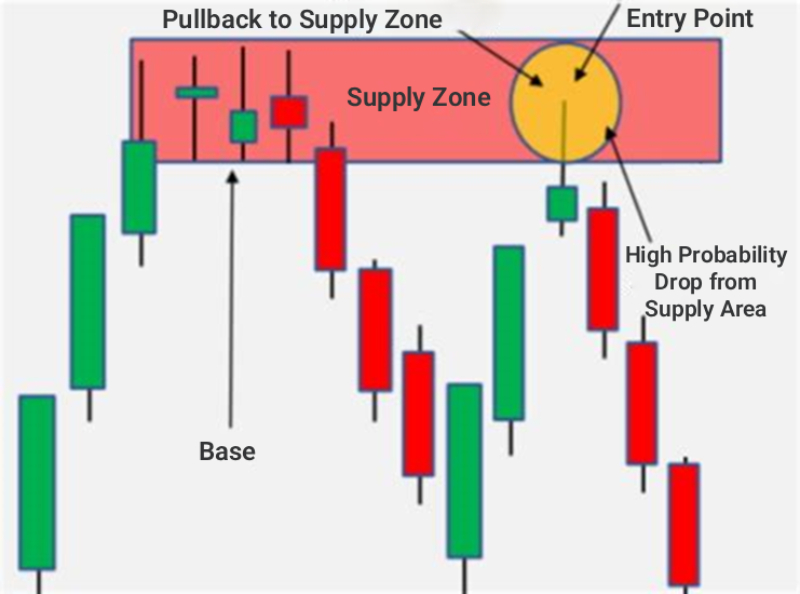
This pattern creates a supply and demand zone, known as the supply zone, where large sellers (such as banks) are ready to sell. This is where stop hunting occurs, meaning that large market players deceive smaller traders into making wrong positions, allowing themselves to profit. The Rally Base Drop helps you identify these key points and trade with more confidence.

In lower timeframes, the RBD pattern can act as an "advanced" structure of the Drop Base Rally (DBR) pattern. In this case, after the Drop, the price enters the Base phase and then continues with an upward movement (Rally).
Rally Base Drop Pattern in Forex and Other Financial Markets
The Rally Base Drop (RBD) pattern is widely used in markets such as Forex, stocks, crypto, and commodities because the price structure is fractal and repeats across all timeframes, from 1-minute to daily charts. For example, in currency pairs like GBP/USD or cryptocurrencies like Bitcoin, this pattern is easily identified and provides a good entry point for selling trades, especially in volatile markets where the sharp and rapid market movements create an excellent opportunity to capture reversals.
One of the key features of the Rally Base Drop pattern is the involvement of stop hunting by major market players. They target the stop-loss levels of retail traders, creating adequate liquidity to make the supply zone or supply areas more reliable for creating peaks.
Due to the fractal nature of the pattern, this three-phase structure (Rally, Base, Drop) can be used in smaller timeframes for scalping and in larger timeframes for swing trading. Especially in fast markets like Forex or crypto, the pattern combined with increased volume during the Drop phase enhances the reliability of the signal and reduces trade risk.
Components of the Rally Base Drop Pattern
The Rally Base Drop (RBD) pattern is a bearish reversal pattern composed of three main parts: Rally, Base, and Drop. This pattern is used in financial markets like Forex and crypto to identify price reversal points. Each part plays a specific role in forming the supply zone, and stop hunting by large market entities provides the necessary liquidity for this pattern. Below, each part is explained with real chart examples.
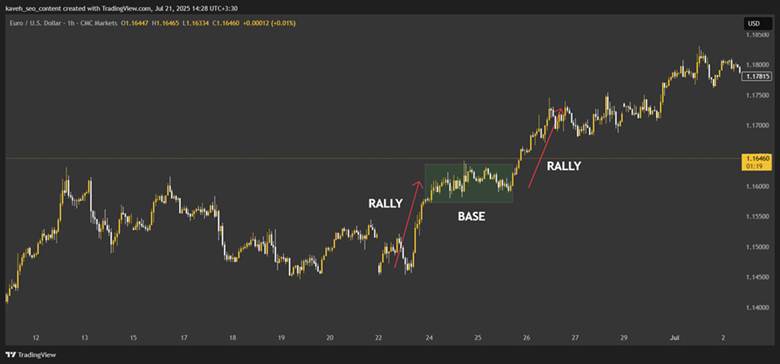
Rally (Initial Upward Move)
The Rally is the first step in the Rally Base Drop pattern. In this phase, the price moves up rapidly, like a car speeding. This usually happens when many buyers enter the market or positive news is released. Stop hunting enters the scene here, as large players deceive smaller traders, gathering liquidity to prepare for the next move.
Base (Consolidation or Order Accumulation Zone)
After the Rally phase, the price enters a zone where it consolidates and price fluctuations remain within a narrow range. During this phase, buyers and sellers reach an equilibrium, and the price temporarily pauses. This zone represents a period of rest for the market. In this stage, large market players may intentionally activate retail traders’ stop-loss orders through stop hunting to accumulate the desired liquidity.
In the Base phase, a decrease in trading volume can indicate price consolidation and preparation for the next move.
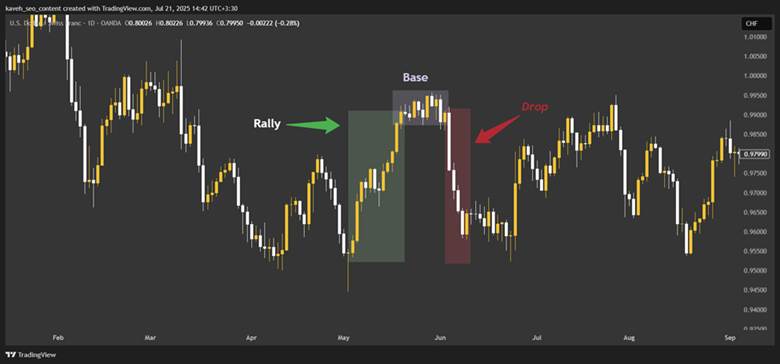
Drop (Sharp Price Decline)
The Drop is the final phase of the Rally Base Drop pattern, where the price rapidly falls. This indicates that sellers have taken control of the market. Stop hunting during this phase traps late buyers, strengthening the supply zone (selling area).
How to Identify the Rally Base Drop (RBD) Pattern
To find the Rally Base Drop (RBD) pattern on a chart, you need to carefully observe price movements and use technical analysis tools. Stop hunting, conducted by large market players, helps identify reliable zones. Below are two main methods for detecting this pattern, explained with real examples.
Using Candlesticks to Filter Out Fake Base Zones in the Rally Base Drop Pattern
In the Base phase, the price enters a consolidation period, often accompanied by small candlesticks with relatively short bodies. To identify valid zones, you should pay attention to the body-to-wick ratio of the candlesticks. If the body of the candlestick is less than 25% of the total length of the candlestick, this zone may indicate an equilibrium between buyers and sellers.
The presence of candlestick patterns like pin bars or engulfing patterns in this zone can confirm its validity. Additionally, it is important to consider stop hunting in this phase, as large market entities may activate retail traders’ stop-loss orders to gather the necessary liquidity for the next move.
Furthermore, price action analysis helps filter out weak Base zones that could be mistakenly identified as strong supply zones. Given that stop hunting may occur in this phase, large market players might trigger retail traders’ stop-losses to absorb the liquidity needed for subsequent moves.
This point is especially important in price action, as specific candlesticks and price behavior in the Base zone directly indicate whether this zone has the necessary validity for a trend reversal.
According to Forexbee: The Rally Base Drop pattern is a price pattern that indicates the supply zone in Forex trading, where large traders place their sell orders for short-term trades.
The Role of Volume in Confirming the Base Zone in the Rally Base Drop Pattern
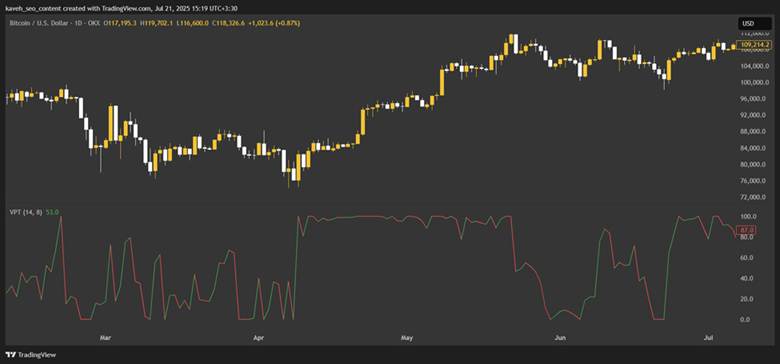
In the Base phase, trading volume typically decreases, indicating price consolidation. After this phase, during the Drop phase, trading volume should increase to indicate the strength of the downward move. Using tools like volume profile or VPT (Volume Price Trend) can help identify these volume changes. These volume changes, combined with stop hunting, can confirm the formation of the supply zone and increase the likelihood of a successful trade.
How to Trade with the Rally Base Drop (RBD) Pattern
Trading with the Rally Base Drop (RBD) pattern is an effective way to capture reversal points in financial markets. This pattern, which includes the Rally, Base, and Drop phases, creates a supply zone that is ideal for selling trades. Stop hunting, conducted by large institutions to deceive retail traders, plays a key role in timing and the success of trades. Risk management is also crucial to protect capital. Below is a step-by-step guide to trading with this pattern, along with real examples.
How to Enter a Trade Using a Limit Order in the Base Zone
To trade with the Rally Base Drop, you can use a sell limit order above the Base zone. This method can be executed in two ways:
- Conservative Approach: Waiting for confirmation of the pullback and then entering the trade.
- Aggressive Approach: Entering directly with a limit order in the Base zone.
In this approach, stop hunting can act as a key strategy for timing the entry. As retail traders’ stop-losses get triggered in key areas, liquidity is generated for the next move.
How to Set a Stop Loss in a Trade Using the Rally Base Drop Pattern
To reduce risk, the stop loss can be placed above the Base zone. This helps protect the capital from stop hunting. By doing this, if the price temporarily returns to the Base zone, the trader can avoid potential losses.
How to Set Price Targets and Risk-to-Reward Ratio in the Rally Base Drop Pattern
To set price targets, you can use previous support levels or the risk-to-reward ratio. For example, a 1:2 ratio could be appropriate. In this context, stop hunting can play a role in determining precise price targets. By analyzing key zones and price behavior, the trader can identify potential reversal points.
Combining the Rally Base Drop Pattern with Other Technical Analysis Methods
Combining the Rally Base Drop with technical tools increases the chances of successful trades. Using methods like Fibonacci, support and resistance, and price action provides stronger signals.
Combining the Rally Base Drop with Fibonacci
Using Fibonacci levels like 61.8% or 78.6% can be useful to confirm the Base zone. In this approach, stop hunting can act as a signal to confirm Fibonacci reversal points.
Combining the Rally Base Drop with Support and Resistance
The Base zone in the Rally Base Drop often aligns with previous resistance levels, turning into a supply zone. For example, in a Bitcoin chart, the Base zone aligns with a broken resistance level. Stop hunting at these levels turns them into strong selling points by gathering retail traders’ liquidity. This combination helps you find more reliable reversal signals.
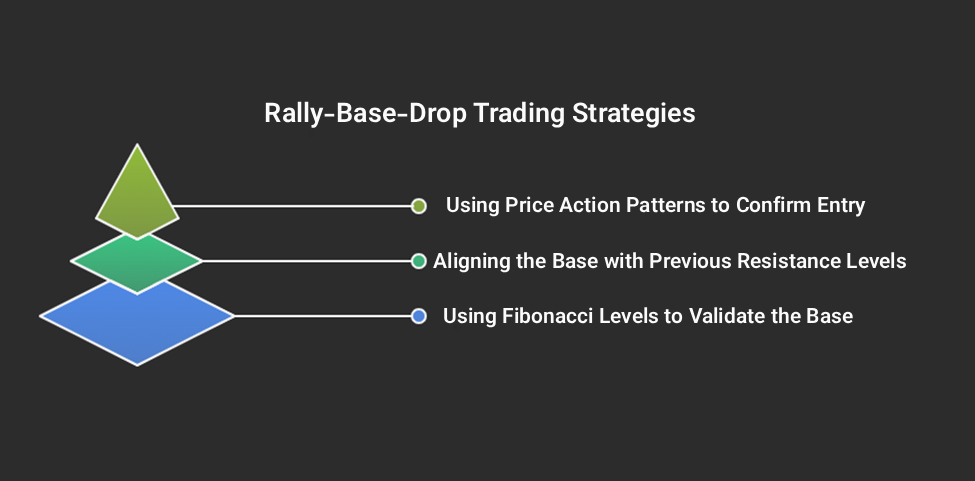
Combining the Rally Base Drop with Price Action
Price action patterns like pin bars or bearish engulfing patterns confirm entries into Rally Base Drop trades. For example, on a currency pair chart, a bearish pin bar in the Base zone gives a strong sell signal. Stop hunting, by creating false moves in these patterns increases the credibility of the signal. Combining price action with RBD increases the success rate of trades.
Common Mistakes When Trading with the Rally Base Drop (RBD) Pattern
Trading with the Rally Base Drop (RBD) pattern can be highly profitable, but simple mistakes can lead to losses. This pattern, used to identify price reversal points to the downside, requires precision. Stop hunting, conducted by large market players to deceive retail traders, is often the cause of these mistakes. Below are three common mistakes when using the Rally Base Drop pattern.
Entering a Trade Too Early Before Confirming the Structure
Entering a trade before the Rally Base Drop pattern is complete or without confirming the pullback can carry high risk. If you enter a sell trade without waiting for the Base zone to form or for a confirming candlestick like a pin bar, you may end up with a loss. For success, you should wait for confirmation of the pattern. Patience is a key part of a strong trading strategy that increases the likelihood of success.
Ignoring Higher Timeframes
Analyzing higher timeframes to confirm the overall market trend is extremely important. Ignoring these timeframes can lead to identifying weak Base zones and unsuccessful trades. In higher timeframes, the Base zone in a lower timeframe may not be considered a valid supply zone. Therefore, to enhance the accuracy of your analysis, it’s recommended to also check higher timeframes and only enter trades when the Base zones align with the overall market trend.
Mistaking a Weak or Fake Base Zone
Identifying weak or fake Base zones can be challenging. Features like large candlesticks or high volume in the Base zone may indicate a weak structure of the pattern. In such cases, the chances of a successful trade decrease. Stop hunting can also play a role in creating fake zones, as large market players may activate retail traders’ stop-loss orders to gather liquidity for the next move. To avoid this mistake, it is recommended to use technical analysis tools such as trading volume and candlestick patterns to confirm the validity of Base zones.
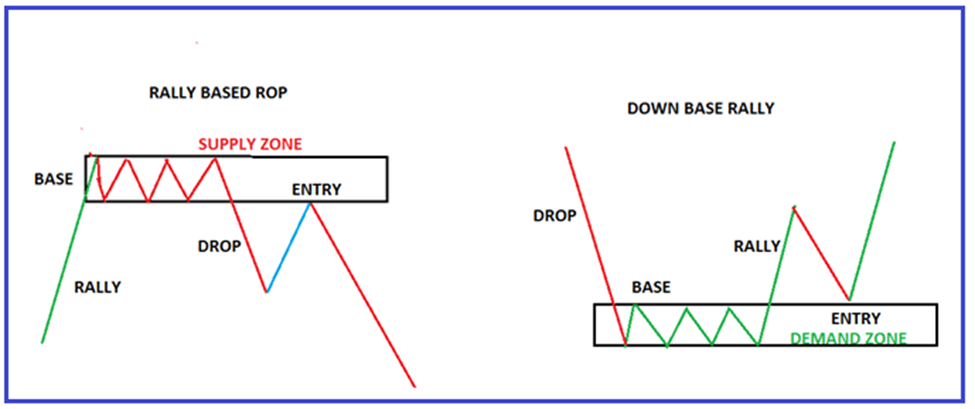
The Difference Between the Rally Base Drop (RBD) Pattern and the Drop Base Rally (DBR) Pattern
Both the Rally Base Drop (RBD) and Drop Base Rally (DBR) patterns are important patterns in technical analysis used to identify supply and demand zones. The main difference between these two patterns lies in the direction of the price movement and the type of zone they create.
In the Rally Base Drop (RBD) pattern, the price starts with a strong upward move (Rally), then enters a consolidation phase (Base), and finally continues with a sharp downward move (Drop), which usually leads to the formation of a supply zone. In contrast, the Drop Base Rally (DBR) pattern starts with a strong downward move (Drop), followed by a consolidation phase (Base), and ends with a strong upward move (Rally), creating a demand zone.
In both patterns, stop hunting plays an important role in deceiving traders and activating stop-loss orders, which helps create liquidity for the next move. Therefore, understanding these differences allows traders to better identify supply and demand zones and make more successful trades.
Conclusion
The Rally Base Drop (RBD) pattern is a powerful tool for identifying downward reversal points in financial markets. By pinpointing supply zones, this pattern helps traders capture selling opportunities. Stop hunting, which is used by large entities to gather liquidity, enhances the accuracy of this pattern. For success, traders should learn the Rally Base Drop through practice and backtesting on charts, and combine it with tools like Fibonacci or price action. Additionally, using proper risk management to minimize losses and increase profitability is essential. With patience and the right strategy, this pattern can improve the profitability of your trades.


